



Baidu, Inc. stock closed at $90.87 on August 18, down from an open near $94.35 and testing lows around $89.60. A Q2 2026 earnings miss and weakening advertising revenue drove the selling, even as AI revenue reached roughly 50% of the core business.
Summary
Key takeaways
- Baidu, Inc. stock closed at $90.87 on August 18, below its daily pivot at $92.64.
- Q2 2026 EPS came in at RMB7.22, missing Wall Street estimates as advertising revenue weakened.
- AI Cloud and robotaxi growth pushed AI revenue to roughly 50% of the core business.
- Daily RSI fell to 22.82, while hourly RSI dropped to 16.73, signaling deeply oversold conditions.
- Analyst views are split between Hold and Buy after the earnings print.
Daily Structure: Baidu, Inc. Stock in a Confirmed Bearish Regime
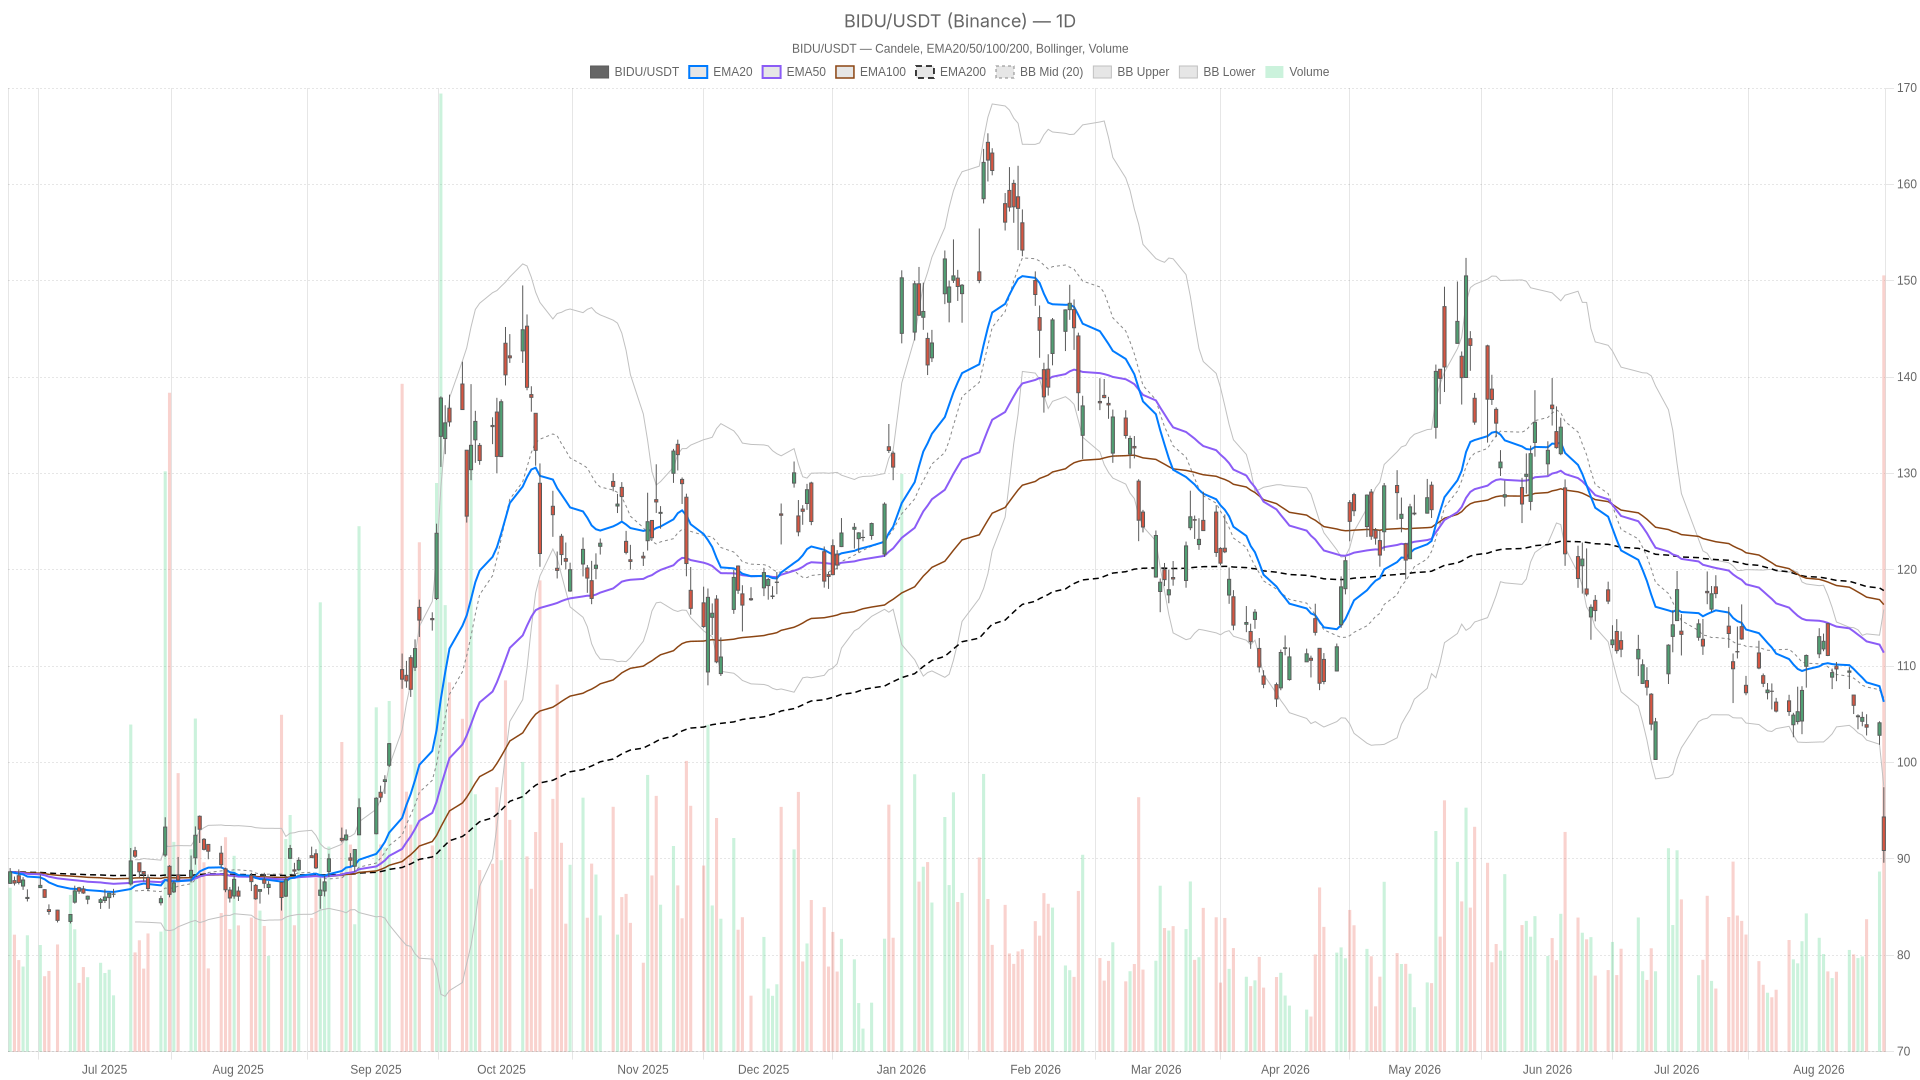
The daily chart confirms a bearish regime. Price sits below every major moving average, and all three averages point lower.
EMA20 sits at 106.3, EMA50 at 111.4, and EMA200 at 117.84. All three averages are stacked above price and sloping lower. The close near $90.87 is well beneath every major moving average. RSI14 at 22.82 shows the selling has pushed into oversold territory, though oversold alone does not mean reversal. MACD reinforces the pressure. The line sits at -3.15 against a signal of -2.03, and the histogram of -1.12 shows momentum still widening to the downside.
Meanwhile, volatility has expanded accordingly. ATR14 stands at 3.75, a wide range for this stock. Price has broken below the lower Bollinger Band at 97.49. That extension typically signals either exhaustion or a more disorderly leg lower. The daily pivot sits at 92.64, with resistance at 95.67 and support at 87.83. Price closing beneath the pivot keeps sellers in control heading into the next session.
1H Timeframe: Momentum Confirms, Even Accelerates
The hourly chart confirms the daily bearish bias. Short-term momentum is even more stretched.
EMA20 at 97.4, EMA50 at 101.94, and EMA200 at 107.25 replicate the same bearish stack seen on the daily. Notably, RSI14 has dropped further to 16.73, deeper into oversold than the daily reading. That suggests short-term sellers are still pressing rather than pausing. MACD on the 1H mirrors the daily histogram at -1.12. The line sits at -3.87, well below the signal at -2.75. In short, the hourly timeframe confirms rather than weakens the daily bias.
At the same time, price is pinned right at the hourly pivot of 90.85. It is trapped in a tight band between resistance at 91.05 and support at 90.45. That narrow range, combined with an ATR14 of 1.77, points to a market pausing after a sharp drop rather than reversing. Baidu, Inc. stock is consolidating at the edge of its most recent selling wave.
15-Minute View: Execution Context, Not a New Trend
The 15-minute chart shows a short-term pause, not a reversal.
RSI14 has ticked up to 28.13 from the more extreme hourly reading. The MACD histogram has flipped slightly positive at +0.47. This is a modest divergence worth noting: short-term momentum is stabilizing even as the higher timeframes remain heavily bearish. Price is hovering near the Bollinger midline at 90.78. Bands are compressed between 89.5 and 92.06, and ATR14 is down to just 0.48. That is a low-volatility pause, not a trend change.
Therefore, traders watching intraday price action should treat this stabilization as execution context only. It may offer short-term bounce attempts toward the pivot cluster near 91.05. However, it does not override the bearish structure defined on the daily and confirmed on the hourly chart.
The Bullish Case for Baidu Stock
The bullish case rests almost entirely on the AI narrative.
Baidu’s AI Cloud infrastructure and GPU services grew strongly in Q2. One Seeking Alpha analysis argues the stock remains a Buy because AI-Cloud is taking over as the legacy search and advertising business shrinks. The Hong Kong dual-primary listing progress adds another structural point in the company’s favor.
Still, for the technical picture to turn constructive, price would need to reclaim the daily pivot at 92.64 and push through resistance at 95.67. A recovery back above the 1H EMA20 near 97.4 would also be an important signal. It would suggest oversold conditions are resolving through a genuine bounce rather than a dead-cat rally.
The Bearish Case and What Invalidates a Recovery
The bearish case still holds the weight of evidence. The key invalidation level sits at $87.83.
On the other hand, a separate Seeking Alpha piece initiated coverage at Hold after the weak Q2 print. It noted that AI Cloud growth stands out, but advertising weakness and margin compression remain real drags. Yahoo Finance’s coverage framed the quarter around a revenue miss driven by advertising softness. It questioned whether the AI thesis alone can offset that decline.
In contrast, a break below that daily support would confirm sellers remain firmly in control. EMA20, EMA50, and EMA200 are all still sloping lower on both the daily and hourly charts. Continued MACD histogram widening on the higher timeframes would further undercut any near-term bounce attempt.
Positioning and Volatility Outlook
Baidu, Inc. stock sits at a technical extreme. The fundamental picture is genuinely split.
Overall, the stock is oversold on both daily and hourly RSI and trading outside its lower Bollinger Band. At the same time, the 15-minute chart shows early signs of short-term stabilization. AI Cloud and robotaxi momentum run against a shrinking advertising base. That split explains why analyst opinion is divided between Hold and Buy.
Meanwhile, the elevated ATR readings across timeframes suggest volatility is likely to remain high in the sessions ahead. Uncertainty is elevated. The conflict between deeply oversold momentum and a still-bearish trend structure means this is not a clean setup in either direction.
FAQ
What caused Baidu, Inc. stock to fall?
The August 18 drop followed a Q2 2026 report that missed Wall Street estimates. EPS landed at RMB7.22 as advertising revenue continued to deteriorate. At the same time, AI-driven segments pushed AI revenue to roughly 50% of the core business.
How oversold is BIDU on the technical charts?
Daily RSI fell to 22.82, and the hourly RSI dropped further to 16.73. The stock also closed below its lower Bollinger Band. The 15-minute RSI ticked up to 28.13, showing only short-term stabilization.
What price levels matter for a recovery?
Price would need to reclaim the daily pivot at 92.64 and push through resistance at 95.67. A move back above the 1H EMA20 near 97.4 would signal a genuine bounce. A break below daily support at 87.83 would confirm sellers remain in control.
Are analysts bullish or bearish on Baidu stock?
Analyst opinion is divided. One Seeking Alpha analysis argues the stock remains a Buy on AI-Cloud growth. A separate piece initiated coverage at Hold, citing advertising weakness and margin compression.
Disclaimer: This article is for informational purposes only and does not constitute financial advice, an investment recommendation, or a solicitation to buy or sell any financial instrument or cryptocurrency. The analysis provided is not indicative of future results. Investing in crypto assets and financial markets carries a high risk of capital loss. Always do your own research (DYOR) and consult a qualified financial advisor before making any decision.
Article produced with the assistance of artificial intelligence and reviewed by the editorial team.
