




Boeing stock closed Thursday at $215.10, below every key daily moving average. Yet the daily regime remains neutral, not bearish. This looks like a stalling uptrend losing steam rather than a confirmed reversal, but shorter-timeframe technical damage deserves close attention.
Summary
Key takeaways
- Boeing stock closed Thursday at $215.10, below its 20-day, 50-day, and 200-day EMAs.
- The daily RSI14 sits at 40.77, while the 1-hour RSI14 has dropped to a deeply oversold 18.42.
- The daily pivot is at 216.77, with first support at 212.47 and the lower Bollinger Band at 208.07.
- Boeing’s $174 million in U.S. defense contracts and a $1.5 billion private-bond deal offer supportive headlines.
- Air Force One repair reports threaten the 2028 delivery schedule for the 747-8.
Daily Chart: Boeing Stock Loses Ground Below Key EMAs
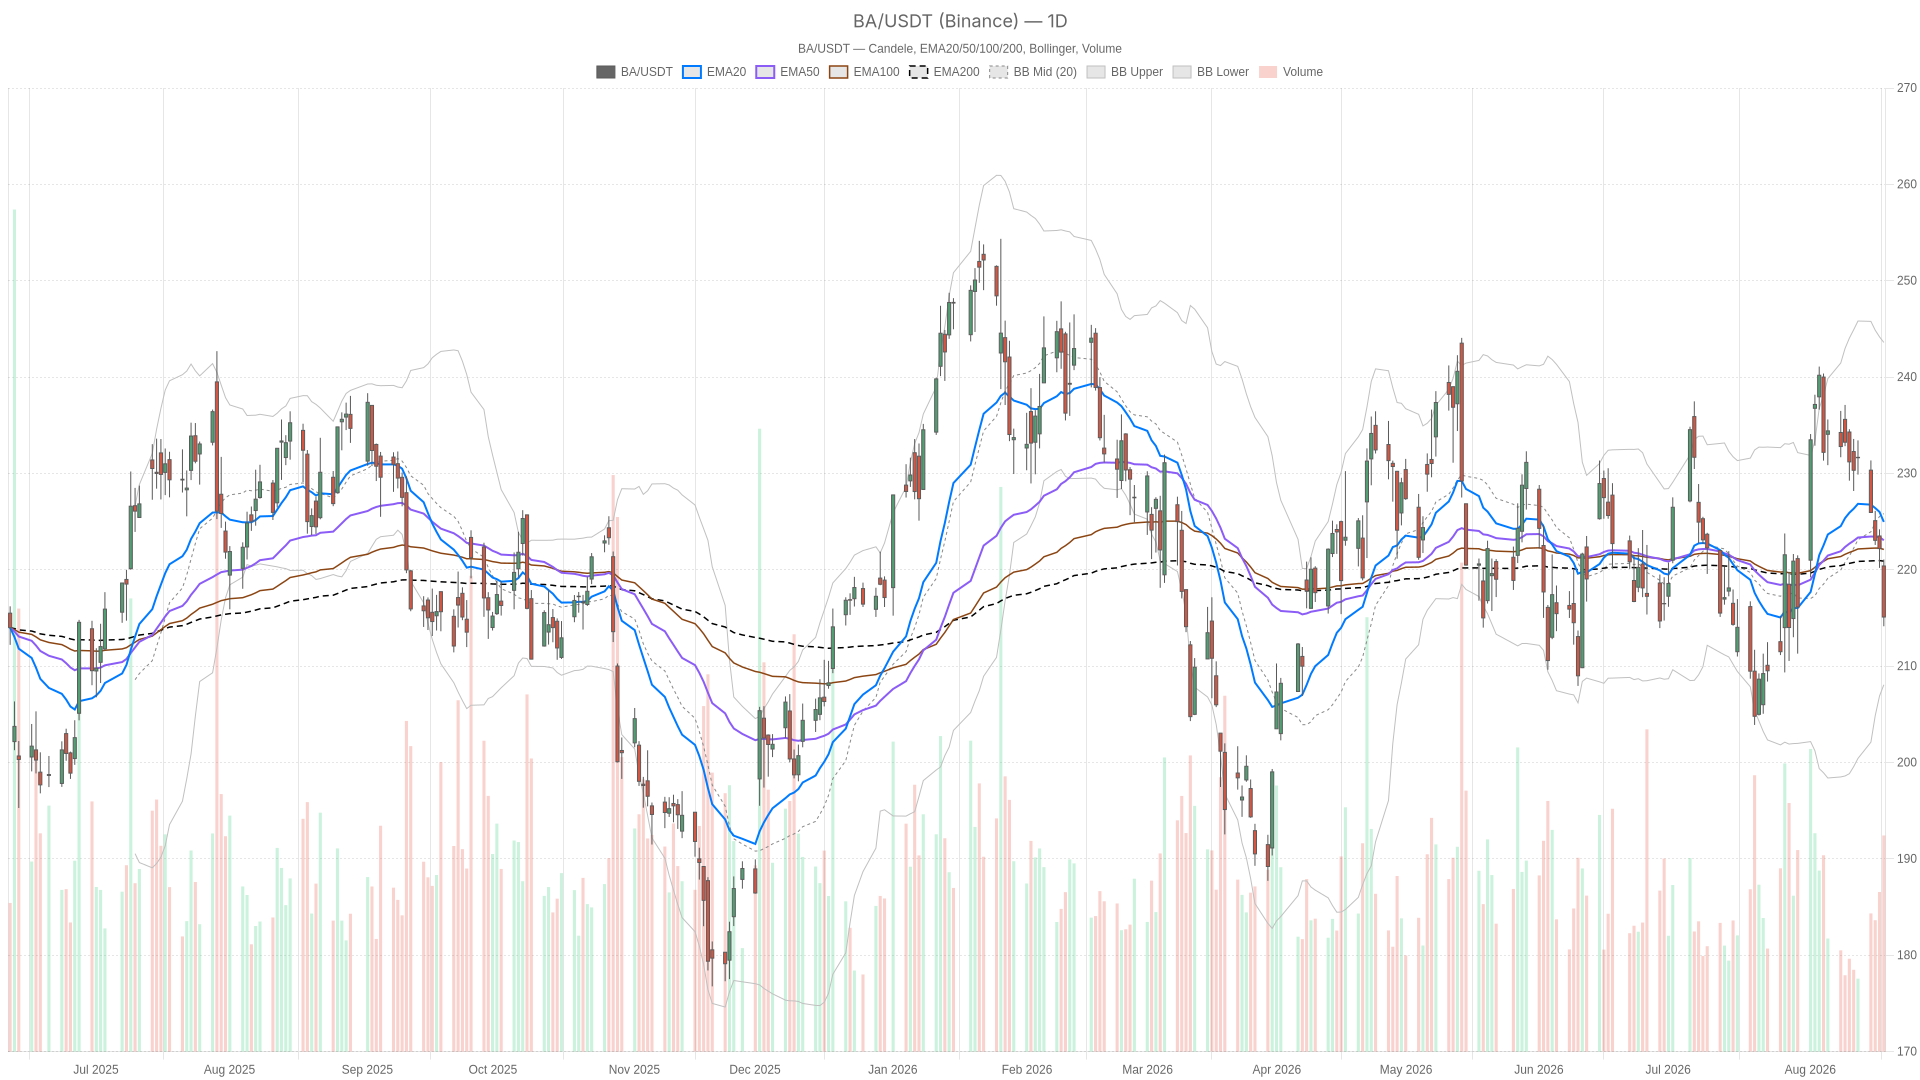
Boeing stock has slipped beneath all three of its major daily EMAs, confirming that short-term upside momentum has faded.
On the daily chart, price now trades below all three major EMAs. The 20-day EMA sits at 224.97, the 50-day at 223.06, and the 200-day at 220.90. That stack — price under all three averages — is a textbook bearish alignment. RSI14 sits at 40.77, below the neutral 50 line but not yet oversold. Sellers currently hold the upper hand, yet the move is not exhausted.
MACD reinforces that read. The line at 0.88 has crossed below the signal at 2.48, leaving a negative histogram of -1.61. In practical terms, upside momentum has faded and the cross has already flipped bearish.
Bollinger Bands add context. The mid-band sits at 225.83, with the upper band at 243.59 and the lower band at 208.07. Price is well below the midline and trending toward the lower boundary. There is still room to fall before conditions would be considered stretched on this timeframe. Daily ATR14 stands at 6.16, so average daily swings of roughly six dollars remain normal for this stock. Volatility itself is not unusual.
The pivot picture matters too. With the pivot point at 216.77 and price trading beneath it, the next reference is first support at 212.47. However, the system still labels the daily regime as neutral rather than bearish. This reads as an early-stage correction within a wider consolidation, not yet a structural trend change.
Hourly Timeframe: Oversold Readings Complicate the Bearish Case
The 1-hour chart confirms the bearish structure, but a deeply oversold reading complicates any straight-line downside case.
Boeing stock closed the hour at 215.20, essentially flat against the daily close. EMA20 at 220.17, EMA50 at 224.41, and EMA200 at 224.35 all sit above price. This mirrors the bearish structure seen on the daily chart. Where the hourly timeframe diverges is momentum. RSI14 has dropped to 18.42, a deeply oversold level that typically reflects sharp, fast selling rather than orderly distribution.
MACD is negative. The line sits at -3.18 against a signal of -2.76. Yet the histogram at -0.42 is narrower than the line-signal gap alone would imply. That is an early hint that downside pressure may be decelerating.
Bollinger Bands on the hourly chart show price hovering near the lower band at 213.91. The midline sits at 220.64 and the upper band at 227.37. That proximity to the lower band, combined with the oversold RSI, is the clearest tension in this setup. Meanwhile, the hourly pivot sits at 215.22, with resistance at 216.02 and support at 214.41. The tight range points to consolidation right after the drop rather than continued acceleration lower.
Therefore, the daily and hourly timeframes agree on direction but disagree on urgency. The daily chart looks like a stalling trend. The hourly RSI near 18 is the kind of reading that has historically preceded at least a short-term bounce.
15-Minute Chart: Execution Context Near the Session Pivot
The 15-minute chart is the only timeframe explicitly tagged bearish, yet its internals show early stabilization rather than accelerating downside.
Price at 215.20 sits below its own EMA20 at 216.27, EMA50 at 218.69, and EMA200 at 225.50. This is consistent with the broader bearish stack. RSI14 reads 36.25 — soft, but not extreme. Notably, the MACD histogram has turned slightly positive at +0.20. The line at -1.13 still remains below the signal at -1.33. That small shift suggests a short-term stabilization attempt is underway, even inside a bearish intraday regime.
Bollinger Bands here show price sitting near the midline at 215.87, between the upper band at 217.74 and the lower band at 214.00. There is no immediate breakout signal in either direction. The 15-minute pivot at 215.04, alongside resistance at 215.66 and support at 214.59, frames a tight intraday battle. In this context, the 15-minute chart is useful mainly for timing entries around these levels. It is less useful for reading direction on its own.
Bullish Scenario for Boeing Stock
A bullish case requires the deeply oversold hourly RSI to trigger a relief bounce toward the nearby pivot cluster.
For that to develop, the oversold hourly RSI of 18.42 would need to fuel a move toward the pivot cluster. Daily resistance sits at 219.40 and hourly resistance at 216.02. A recovery that reclaims the 20-day EMA at 224.97 would shift the daily bias into more constructive territory. The improving 15-minute MACD histogram, now slightly positive, is an early tell worth watching for confirmation of this kind of stabilization.
On the news side, Boeing’s $174 million in new U.S. defense contracts for engines and training offer a supportive headline. The $1.5 billion private-bond deal completed for the Boeing-Lockheed space venture adds another. Both could help sentiment if the technical bounce materializes.
Bearish Scenario for Boeing Stock
The bearish case strengthens if Boeing stock fails to hold above the daily pivot at 216.77 and breaks below first support at 212.47.
A move like that would open the door toward the lower daily Bollinger Band at 208.07. Continued bearish EMA alignment across the daily, hourly, and 15-minute charts — all currently pointing the same direction — would validate this path. Operationally, news around Air Force One repairs is a relevant overhang. Reports note that windows, interior work, and staffing issues are threatening the 2028 delivery schedule for the 747-8. This headline risk could weigh on sentiment if the technical picture deteriorates further. A daily close decisively below 212.47 would be the clearest invalidation of the bullish scenario.
Closing Thoughts: Positioning and Volatility
Boeing stock (BA) sits at a genuine crossroads between timeframes, with mixed signals that argue against chasing either scenario prematurely.
Overall, the daily chart shows a fading uptrend that has not yet been reclassified as bearish. The hourly chart shows an oversold condition that often precedes a bounce. The 15-minute chart shows early signs of stabilization inside a still-bearish intraday regime. With daily ATR14 at 6.16 and hourly ATR14 at 1.93, volatility remains present but not extreme by the stock’s own recent standards.
Given the mixed signals, positioning around the immediate pivot levels will likely matter more than chasing either scenario. Those levels are 216.77 on the daily and 215.22 on the hourly. Uncertainty is elevated. The next few sessions around these levels should clarify whether this is a pause or the start of something more sustained.
FAQ
Is Boeing stock in a bearish trend?
The daily regime is still classified as neutral, not bearish. Price sits below its 20-day, 50-day, and 200-day EMAs, but the system reads this as an early-stage correction within a wider consolidation rather than a confirmed reversal.
Why is the 1-hour RSI reading significant for Boeing stock?
The 1-hour RSI14 has dropped to 18.42, a deeply oversold level that typically reflects sharp, fast selling. Readings near that level have historically preceded at least a short-term bounce.
What are the key support levels to watch?
The daily pivot sits at 216.77, with first support at 212.47. A break below that would open the door toward the lower daily Bollinger Band at 208.07.
What news could affect Boeing stock near term?
Boeing’s $174 million in new U.S. defense contracts and the $1.5 billion private-bond deal for the Boeing-Lockheed space venture are supportive headlines. On the risk side, Air Force One repair reports threaten the 2028 delivery schedule for the 747-8.
Disclaimer: This article is for informational purposes only and does not constitute financial advice, an investment recommendation, or a solicitation to buy or sell any financial instrument or cryptocurrency. The analysis provided is not indicative of future results. Investing in crypto assets and financial markets carries a high risk of capital loss. Always do your own research (DYOR) and consult a qualified financial advisor before making any decision.
Article produced with the assistance of artificial intelligence and reviewed by the editorial team.
