




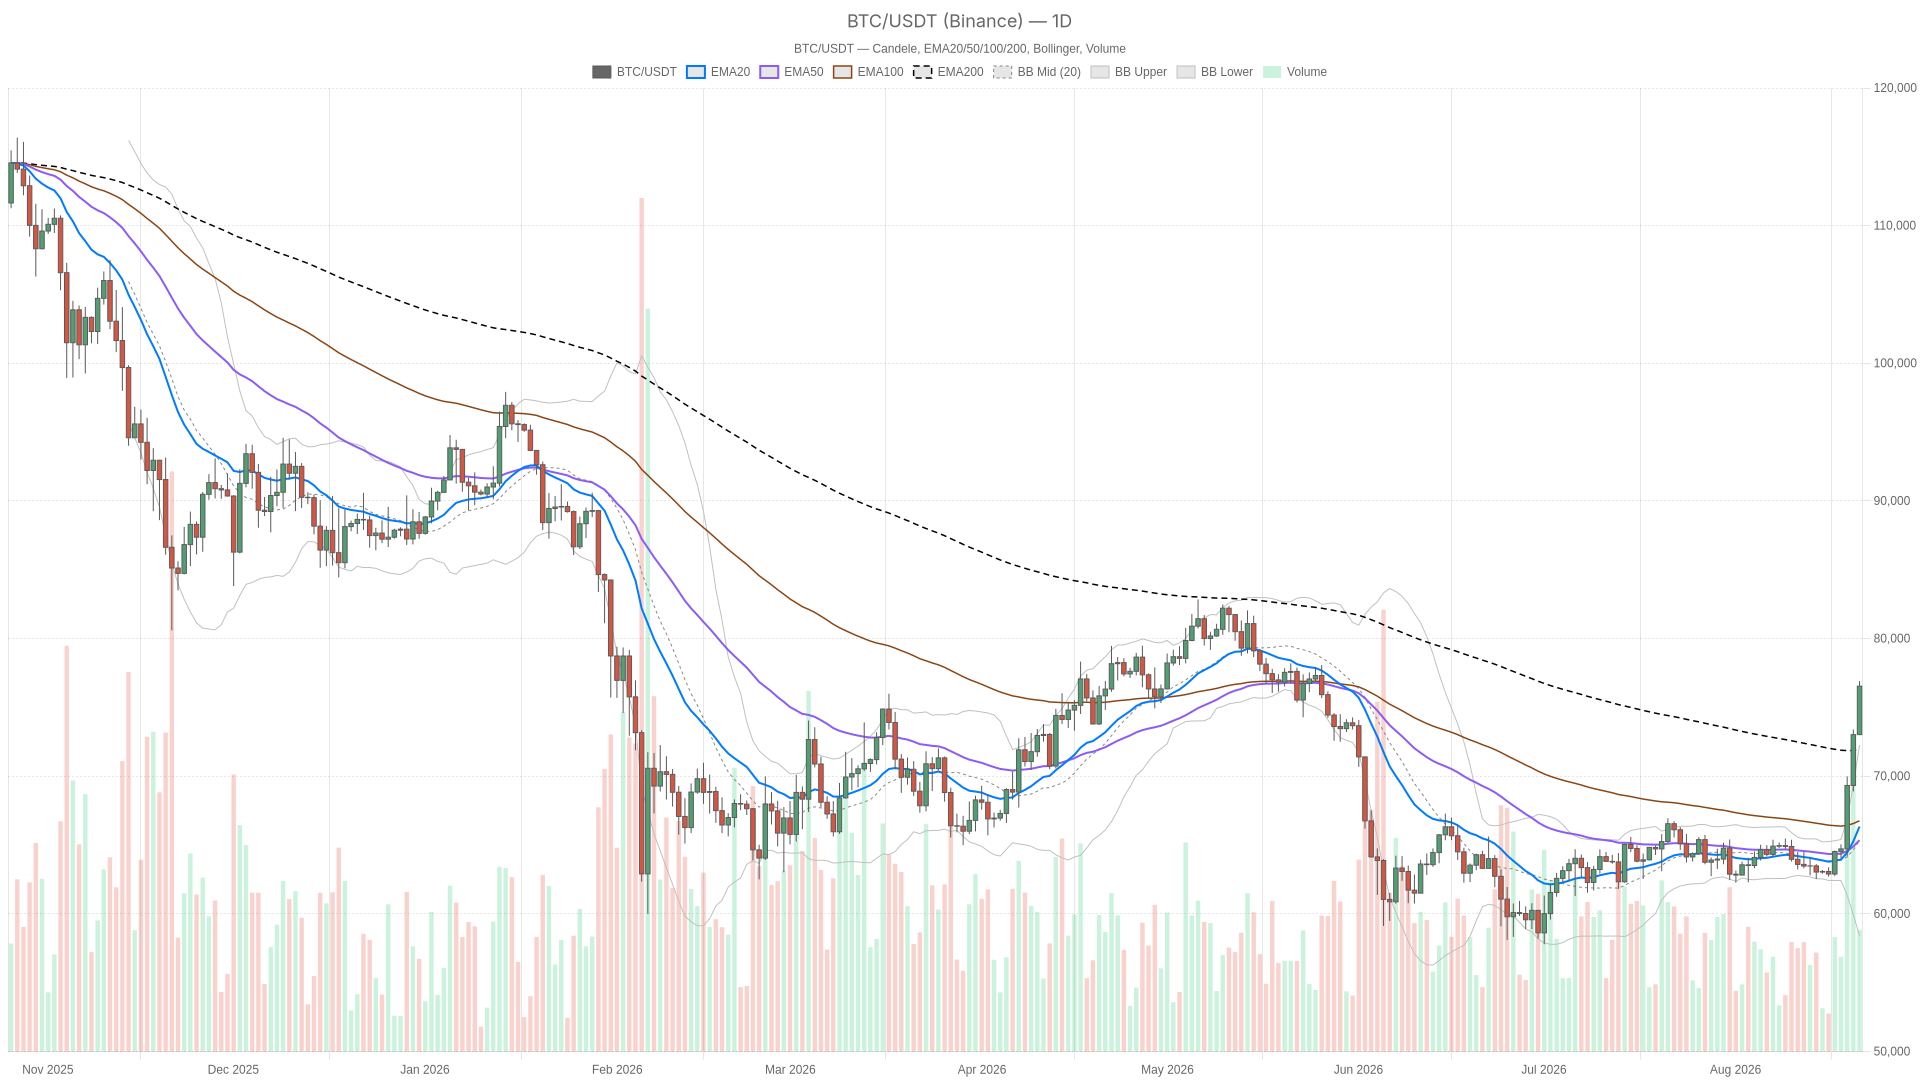
A violent repricing sent Bitcoin surging to $76,548 on August 21, 2026, as falling bond yields and a last-minute regulatory push combined to drive the BTC value sharply higher. The move marks Bitcoin’s biggest weekly gain in over two years.
Summary
Key takeaways
- Bitcoin closed at $76,548 on August 21, marking its largest weekly gain in more than two years.
- Daily RSI hit 84.45, a level typically seen during blow-off legs or powerful trend ignitions.
- Price closed above the daily upper Bollinger Band at $72,259.65, a pattern often preceding sharp mean-reversion snaps.
- Bitcoin dominance rose to 59.32%, confirming BTC is leading the rally rather than riding altcoin momentum.
- The Fear & Greed Index registered 72, squarely in Greed territory and aligned with overbought technical readings.
Price Breaks Above Key Averages as Daily Momentum Turns Extreme
The breakout above the EMA200 at $71,923.96 signals a structural trend shift from recovery to re-established bullish territory, yet the daily RSI at 84.45 warns the move is dangerously stretched. On the daily timeframe, BTC closed at $76,548 against an EMA20 of $66,349.6, an EMA50 of $65,358.5, and an EMA200 of $71,923.96. What stands out is not simply that price sits above all three averages — it is that the EMA200 was above both the EMA20 and EMA50 before this rally, meaning Bitcoin had spent time languishing below its long-term average.
Meanwhile, RSI14 on the daily sits at 84.45. That is not garden-variety overbought — it is a reading associated with blow-off legs or genuinely powerful trend ignitions. MACD backs the momentum story: the line sits at 1771.78 against a signal of 517.51, leaving a histogram of 1254.28 that is still expanding. There is no bearish crossover, no hesitation. This market has committed fully to the upside on the higher timeframe, even if it is arguably overextended.
However, the Bollinger Bands tell the more uncomfortable part of the story. The daily upper band sits at $72,259.65, with the midline at $65,335.43. Price at $76,548 is trading well above the upper band — a “walking the band” pattern common in strong trends but also a classic precursor to sharp mean-reversion snaps once buying exhausts itself. Daily ATR14 of 1825 confirms volatility has expanded meaningfully beyond typical ranges, consistent with the 12% two-day move CNBC flagged.
Moreover, the daily pivot sits at $75,497.32, with resistance (R1) at $77,967.63 and support (S1) at $74,077.7. Price is currently trading above pivot and pressing toward that R1 zone, which is the next real test for continuation.
Multi-Timeframe Picture: Daily Extension vs Intraday Confirmation
While the daily chart shows price detached above its Bollinger Bands, the hourly and 15-minute charts are consolidating just under resistance, creating a clear disagreement between timeframes. The hourly chart is unambiguous in a way the daily is not — its regime reads outright bullish. EMA20 at $73,892.86, EMA50 at $71,194.65, and EMA200 at $66,693.28 are all stacked in proper bullish order beneath the current price of $76,550.
RSI14 on the 1H is at 84.13, essentially mirroring the daily’s overbought extreme. Furthermore, MACD shows a line of 1568.32 versus a signal of 1430.94, a histogram of 137.38 — positive but notably thinner than the daily histogram. This hints that momentum is decelerating slightly at the intraday level even as the broader trend holds.
What is interesting, however, is how the Bollinger Band picture diverges between timeframes. On the 1H, price at $76,550 is sitting just under its upper band of $76,685.15 — tight, not detached like on the daily. The 15-minute chart shows the same story: close at $76,546.35 against an upper band of $76,673.4, with RSI14 easing to 75.11, still overbought but less extreme than the higher timeframes. MACD on the 15m is barely positive at a histogram of 71.44.
In plain terms, the daily chart has already blown past its statistical range, while the lower timeframes are consolidating right up against local resistance rather than confirming a fresh breakout. Both the 1H and 15m pivots are almost identical — pivot around $76,510–76,512, R1 near $76,785–76,788, S1 near $76,271–76,274 — which tells you price has been coiling in a tight band just under intraday resistance.
Consequently, ATR readings shrink from 748.72 on the 1H down to 418.6 on the 15m, confirming the big directional move already happened and the market is now digesting it in real time. That is the core disagreement in this setup: the higher timeframe is stretched, while the lower timeframes are simply holding near the highs, waiting for a trigger either way.
Sentiment and Market Backdrop Behind the Rally
This rally is backed by genuine capital inflows across on-chain venues, with Bitcoin dominance at 59.32% and the Fear & Greed Index at 72 confirming risk appetite is broad-based rather than isolated to spot BTC buying. Total crypto market capitalization sits at roughly $2.57 trillion, up 4.63% over 24 hours according to aggregated market-cap data. Bitcoin’s dominance level means BTC is leading this rally rather than riding altcoin momentum.
The Fear & Greed Index reading of 72 lands squarely in Greed territory, which lines up with the overbought technical readings across every timeframe. Sentiment and price action are both stretched in the same direction, reinforcing each other rather than diverging. Additionally, a broader risk-on signature is showing up in DeFi activity. Fee data shows Uniswap V3 fees up 124.6% over seven days, Fluid DEX up 135.32%, and Ekubo up a striking 209.68% over the same period — even as Curve DEX fees fell 15.61%.
That is a market where risk appetite is broadly returning across on-chain venues, not just concentrated in BTC spot buying. This supports the idea that the move has real capital flow behind it rather than being a thin, easily-reversed squeeze.
Bullish Case: Continuation Toward New Highs
Holding above the daily pivot at $75,497.32 and defending the EMA200 breakout would open a path toward R1 at $77,967.63 and potentially new highs. If BTC value holds above these levels on any pullback, the MACD histogram expansion points toward R1 and beyond.
Moreover, the Clarity Act push reported by CNBC and the yield-driven rotation flagged by Bloomberg both give this move a fundamental backbone beyond pure technicals. With dominance rising, BTC looks like the vehicle of choice for this risk-on wave. For this scenario to keep working, the 1H needs to hold its EMA20 at $73,892.86 — a loss of that level while RSI remains this extended would be an early warning that momentum is cracking before the daily trend actually turns.
Bearish Case: Overbought Risk and Mean-Reversion Potential
An RSI of 84.45 on the daily chart cannot sustain indefinitely, and price trading above the upper Bollinger Band at $72,259.65 creates a mean-reversion risk toward the midline near $65,335.43. Even in strong trends, some cooling is typically needed. Price trading well above the daily upper Bollinger Band is the kind of extension that often resolves with a snap back toward the midline, or at minimum a retest of the daily EMA20 at $66,349.6.
However, a more moderate version of this pullback would simply see price lose the 1H pivot at $76,511.92 and slide toward the 1H support (S1) at $76,273.84, testing whether dip-buyers show up at all. This scenario gains weight if the MACD histogram on the hourly — already thinner than the daily at just 137.38 — starts contracting further. It also gains traction if the regulatory optimism around the Clarity Act stalls out in Congress rather than translating into an actual vote.
Positioning, Risk, and What Comes Next
The market is caught between a powerful news-backed trend and technical readings that are stretched across every timeframe, demanding patience around entries and clear invalidation levels. The daily chart wants to keep running on pure momentum; the intraday charts are consolidating right under resistance rather than confirming fresh strength.
However, sentiment is greedy rather than fearful, which cuts both ways — it can fuel further upside chasing, or it can be the ingredient that makes a reversal sharper once it starts. Volatility, as measured by ATR across all three timeframes, is elevated and expanding. This means whichever direction this resolves in, the moves are likely to be fast rather than gradual.
Traders watching this setup should pay close attention to whether the daily can hold above its pivot and reclaimed EMA200, and whether the 1H can defend its EMA20. Those are the levels that will tell you if this is trend continuation or the early stages of a cooldown. Given how far RSI has pushed on both the daily and hourly charts, patience around entries and clear invalidation levels matter more than usual here. Chasing an already-extended move without a plan for where you are wrong is how overbought conditions turn painful.
FAQ
What drove Bitcoin’s surge to $76,548 on August 21, 2026?
The rally was fueled by a combination of falling bond yields, which pushed capital toward risk assets, and a last-minute lobbying effort by Trump and crypto executives for the Clarity Act. Bloomberg reported the move as Bitcoin’s biggest weekly gain in more than two years, while CNBC flagged a 12% surge in just two days.
Is Bitcoin overbought after reaching $76,548?
Yes, by multiple measures. The daily RSI14 sits at 84.45 and the hourly RSI14 at 84.13 — both well above the 70 overbought threshold. Additionally, price closed above the daily upper Bollinger Band at $72,259.65, a pattern often associated with short-term mean-reversion risk.
What key levels should traders watch next?
On the upside, resistance sits at R1 near $77,967.63. On the downside, the daily pivot at $75,497.32 and the reclaimed EMA200 at $71,923.96 are critical support levels. The 1H EMA20 at $73,892.86 is an early warning line — losing it while RSI remains extended could signal momentum cracking.
Is the rally supported by genuine capital inflows?
Yes. Bitcoin dominance rose to 59.32%, DeFi fee data showed Uniswap V3 up 124.6%, Fluid DEX up 135.32%, and Ekubo up 209.68% over seven days. The total crypto market cap reached roughly $2.57 trillion, up 4.63% in 24 hours, suggesting broad-based risk appetite rather than an isolated BTC squeeze.
Disclaimer: This article is for informational purposes only and does not constitute financial advice, an investment recommendation, or a solicitation to buy or sell any financial instrument or cryptocurrency. The analysis provided is not indicative of future results. Investing in crypto assets and financial markets carries a high risk of capital loss. Always do your own research (DYOR) and consult a qualified financial advisor before making any decision.
Article produced with the assistance of artificial intelligence and reviewed by the editorial team.
