




Circle Stock is having a moment. CRCL closed at $94.24 after a crypto rally tied to a White House summit lifted sentiment. Yet price is now pressing into a major daily resistance zone. The technical picture across timeframes is not as unanimous as the headlines suggest.
Summary
Key takeaways
- CRCL closed at $94.24, up from a $90.36 intraday low, after a crypto rally lifted sector sentiment.
- The daily RSI14 at 71.64 signals overbought conditions as price tests the 94.57–96.87 resistance cluster.
- Hourly and 15-minute momentum is fading, with the 15-minute MACD histogram negative at -0.22.
- Daily ATR14 at 5.98 points to nearly $6 average swings, keeping volatility elevated.
- CRCL remains down more than 70% from its all-time high and 33% over the past year.
Circle Stock Daily Trend: Overbought Strength Meets a Wall
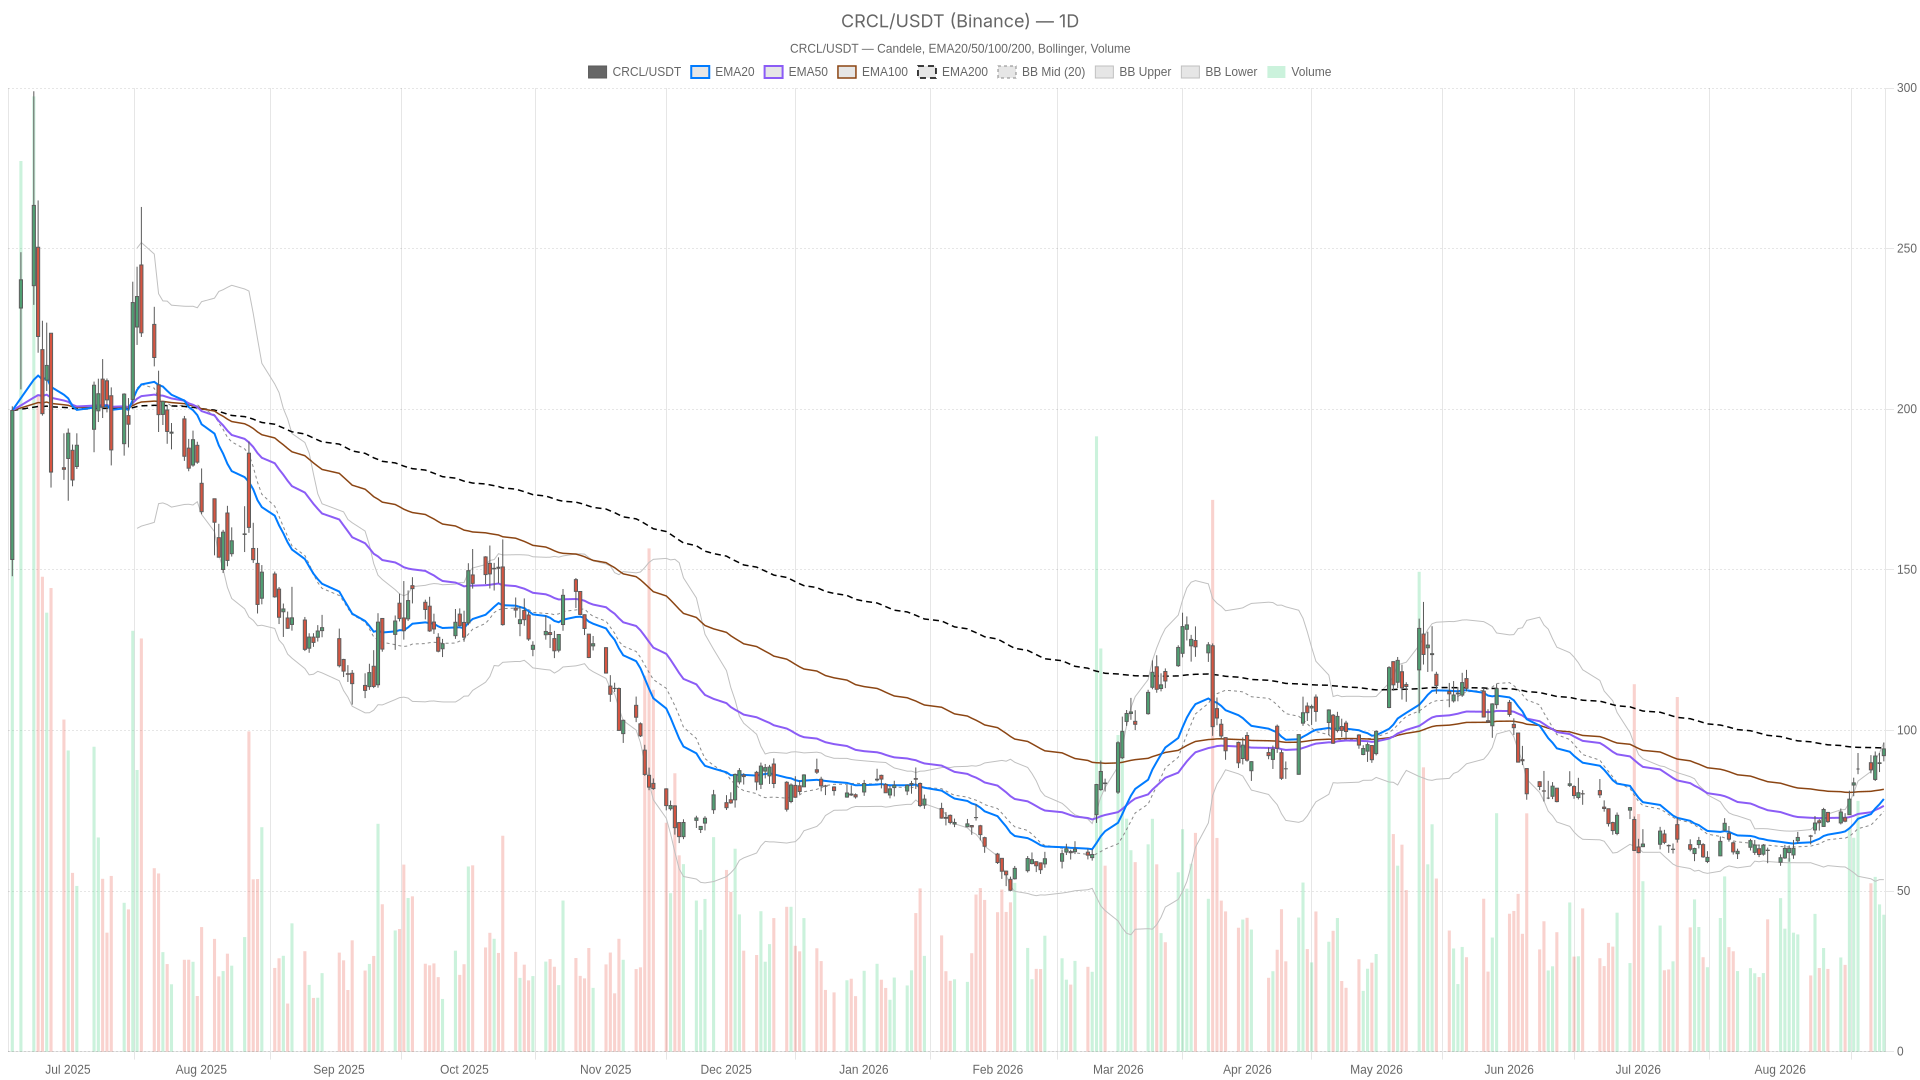
The daily trend is steeply bullish, yet price has run straight into a major resistance wall. CRCL’s 20-day EMA sits at 78.66 and the 50-day EMA at 76.51. That means price is trading well above both, signaling a fast, aggressive move rather than a slow grind higher. The real battleground is the 200-day EMA at 94.57. Wednesday’s close of $94.24 landed just beneath it. As a result, the stock is knocking on the door of a long-term resistance level it has not yet reclaimed on a closing basis.
Momentum and Volatility Readings
Momentum backs the bullish case, at least for now. The daily RSI14 reads 71.64, comfortably in overbought territory. MACD is firmly positive, with the line at 6.18 versus a signal of 3.6 and a histogram of 2.58. That is a strong bullish reading. However, an RSI above 70 also flags stretched conditions. These are the levels where rallies often pause or digest sideways before continuing.
The Bollinger setup tells a similar story. The mid-band sits at 74.82, the upper band at 96.1, and price is riding right near that upper boundary. Combined with a daily pivot resistance (R1) at 96.87, there is a tight cluster of resistance between roughly 94.57 and 96.87. That 94.57–96.87 resistance cluster is the level bulls need to clear convincingly. Daily ATR14 stands at 5.98. That means average daily swings of nearly six dollars, so this is a genuinely volatile name right now. Notably, the system still tags the daily regime as “neutral.” That likely reflects the fact that price has not yet closed above the 200-EMA, leaving the broader trend context unresolved.
Hourly Chart Confirms the Uptrend, But Momentum Is Fading
The 1-hour chart still confirms an uptrend, but momentum is fading right at resistance. Price at 94.23 sits above all three EMAs: 91.91 (20-period), 87.44 (50-period), and 75.75 (200-period). That clean bullish alignment confirms the intraday uptrend. RSI14 at 62.61 is bullish without being overextended, leaving room before hourly conditions get stretched.
At the same time, MACD on the hourly is telling a more cautious story. The line sits at 1.95 versus a signal of 1.92, with a histogram of just 0.03 — essentially flat. That is a sign of decelerating momentum right at the resistance zone identified on the daily chart. In other words, the trend structure is intact, but the fuel behind it is thinning exactly where it matters most. The hourly pivot point at 94.25 is basically where price is trading, underscoring a market in indecision at this exact level.
15-Minute View: Short-Term Pullback Inside the Bigger Trend
The 15-minute chart shows a short-term pullback within a still-bullish bigger trend. Price at 94.23 sits just above its 20-period EMA of 94.13. It also holds above the 50-period EMA of 92.9. That is still a bullish short-term structure, but a tight one. RSI14 at 53.68 is neutral, offering no clear directional edge on this timeframe.
More notably, the 15-minute MACD histogram has flipped negative at -0.22, conflicting with the bullish readings on the daily and hourly charts. This points to a short-term pullback or consolidation phase within the broader uptrend rather than a trend reversal. Price is also trading below the 15-minute Bollinger mid-band of 94.7, closer to the lower portion of the range near 93.32. For execution purposes, the intraday pivot support at 94.07 is the level to watch for signs of the pullback stabilizing.
Bullish Scenario for Circle Stock
The bullish case depends on a clean break above the 94.57–96.87 resistance cluster. That is where the 200-day EMA, the upper Bollinger Band, and the daily R1 pivot all converge. A confirmed close above that zone, ideally on strong volume, would represent meaningful technical validation of the recent rally. This would align with the more optimistic analyst calls in the news flow. Bernstein has flagged 60% upside potential, while another analyst has pointed to as much as 75% surge potential. Cathie Wood has also continued to call Circle a “disrupter”. She argues the stock’s recent weakness reflects short-term market inefficiency rather than a broken thesis. For the bullish scenario to hold on lower timeframes, hourly price needs to stay above its 20-EMA at 91.91. Losing that level would undercut the intraday bullish regime even if the daily trend stays intact.
Bearish Scenario and What Would Invalidate the Rally
On the other hand, the bearish case rests on a rejection at resistance while momentum fades. The overbought daily RSI at 71.64 is a legitimate warning sign. It combines with a fading hourly MACD and an already-negative 15-minute MACD histogram. A rejection at the 94.57–96.87 resistance zone could trigger a retreat toward the daily S1 pivot at 90.99. That level lines up closely with the prior session’s low of 90.36. A deeper pullback would put the daily EMA20 near 78.66 back into focus over a longer horizon. The bigger picture also matters. CRCL is still down more than 70% from its all-time high and down 33% over the past year, according to recent reporting. That context matters. This rally needs to prove itself as a genuine trend shift, not simply be assumed as one.
Closing Take on Circle Stock
Circle Stock is at a genuine inflection point between overbought strength and fading momentum. The daily trend is strong and momentum has been undeniably bullish. Still, price is testing serious resistance exactly where RSI is overbought and hourly momentum is flattening. Meanwhile, the 15-minute chart shows the market already digesting some of that strength through a short-term pullback. Given the daily ATR near six dollars, volatility is elevated. The reaction at the 94.57–96.87 zone in the sessions ahead should be the key tell. Positioning here calls for patience rather than conviction in either direction, given how mixed the signals are across timeframes right now.
FAQ
What is the key resistance level for Circle Stock (CRCL)?
The key resistance cluster sits between 94.57 and 96.87. It includes the 200-day EMA at 94.57, the daily upper Bollinger Band at 96.1, and the daily R1 pivot at 96.87.
Is Circle Stock overbought right now?
On the daily chart, yes. The daily RSI14 reads 71.64, above the 70 overbought threshold, while MACD remains positive with a histogram of 2.58.
What would invalidate the bullish case?
A rejection at the 94.57–96.87 zone could send price toward the daily S1 pivot at 90.99, near the prior session low of 90.36. Losing the hourly 20-period EMA at 91.91 would also undercut the intraday bullish regime.
How far is CRCL from its all-time high?
CRCL is still down more than 70% from its all-time high and down 33% over the past year, according to recent reporting.
Disclaimer: This article is for informational purposes only and does not constitute financial advice, an investment recommendation, or a solicitation to buy or sell any financial instrument or cryptocurrency. The analysis provided is not indicative of future results. Investing in crypto assets and financial markets carries a high risk of capital loss. Always do your own research (DYOR) and consult a qualified financial advisor before making any decision.
Article produced with the assistance of artificial intelligence and reviewed by the editorial team.
