Over the past weekend, the crypto market has witnessed movements testing the support levels of the altcoins, which continue to suffer due to the dominance of bitcoin, which has returned to 70%, the highest level since March 2017.
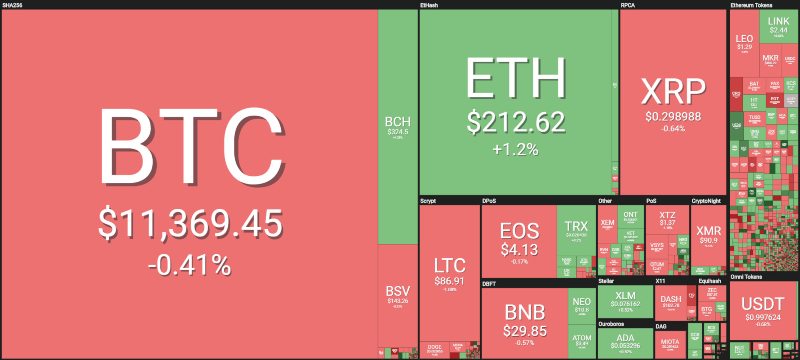
With a marked decrease in trading volume, falling below $65 billion on a daily basis – the lowest level in the last two months – it is clear that investors are probably on holiday, although always with an eye on the movements of the crypto market.
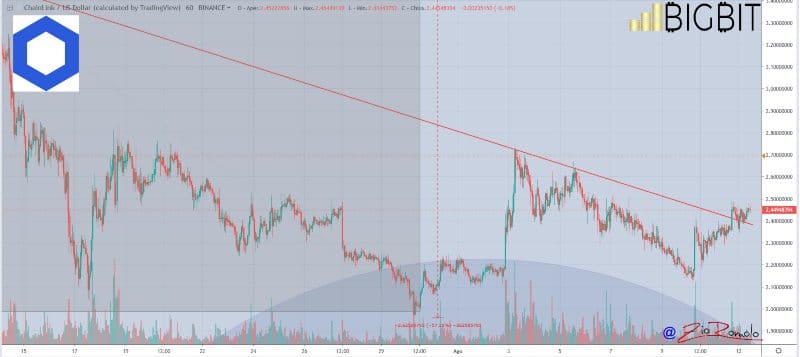
During the last weekend, we also witnessed the double-digit fluctuations of some of the major altcoins, in particular, Chainlink (LINK) which, after marking a drop of about 60% from the tops reached at the end of June, is trying to recover with a rise of 10%, reaching 2.5 dollars.
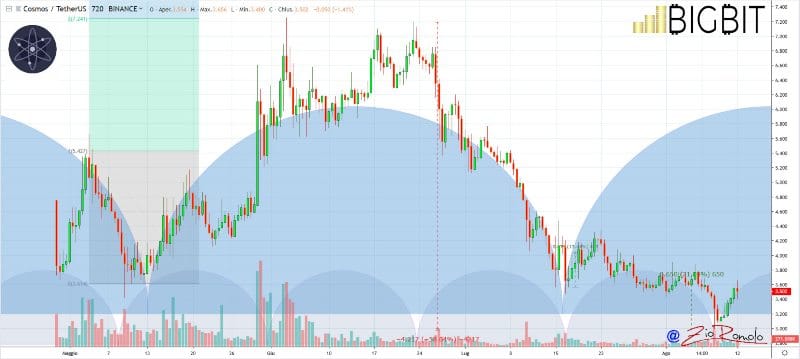
The same is true for Cosmos (ATOM), which has reached its lowest level since its launch in April and now is trying to recover 3.5 dollars, attempting to reverse the decidedly bearish trend that from the tops at the end of June shows a loss in value of about 60%. The rebound of the last 3 days allows Cosmos to recover 20%, returning to 3.5 dollars.
Iota (MIOTA), on the other hand, continues to sink and fluctuate amidst the 2019 lows, swinging dangerously around 25 cents of a dollar.
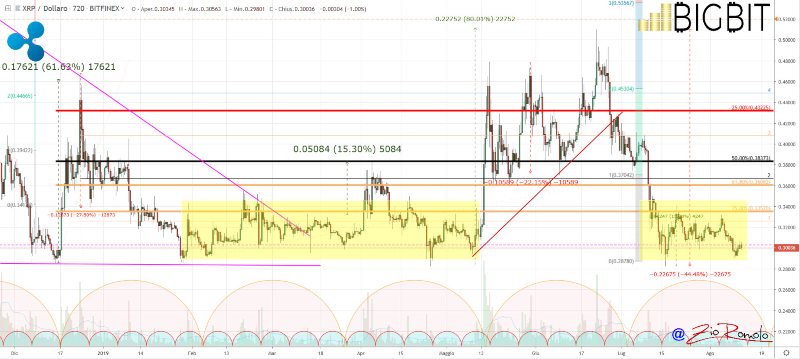
Ripple (XRP), third in the ranking by capitalisation, oscillates dangerously below 30 cents with a trend that seems to disregard the petition that has collected about a thousand signatures and that urges Ripple Labs not to continue the sale of its proprietary tokens at the expense of investors. In contrast to many other altcoins, including bitcoin, Ripple’s value has fluctuated to the lows of the last 10 months.
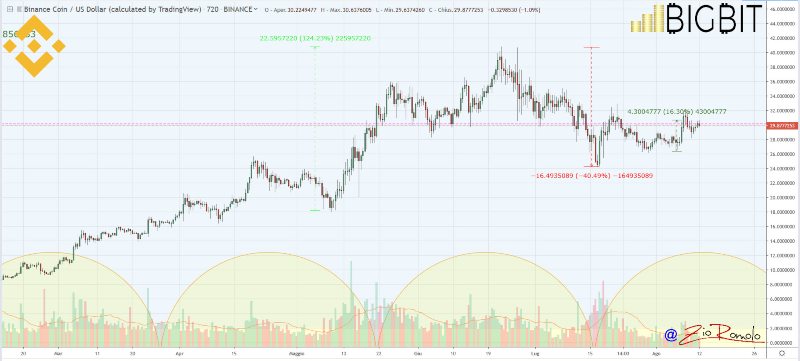
Binance Coin (BNB), despite the regressive movement that occurred in July, in recent days has been trying to climb the slope recovering 30 dollars. BNB marks one of the biggest rises of the week with a recovery of 15%.
The rise that allowed Binance Coin to recover between 15 and 20% also allows the crypto to get one step closer to the 5th position occupied by litecoin. There is now a difference in capitalisation of about 800 million dollars between the two.
Litecoin (LTC) in these last hours oscillates around 85 dollars, suffering the blow after the halving that for many was supposed to be an opportunity for redemption: LTC is not able to maintain the 100 dollars quota, the level recorded last Monday, the day of the halving.
The movements of the market bring the capitalisation of the crypto sector to slide under the 300 billion dollars, with the altcoins enduring the strength of bitcoin. BTC’s dominance remains at the peak of the last few days, clinging to 69% of dominance.
This continues at the expense of both Ethereum, which remains above 7.7% dominance, and Ripple, which despite the difficulties and a day that sees the prices of XRP fluctuate around parity, remains around 4.5% market share.
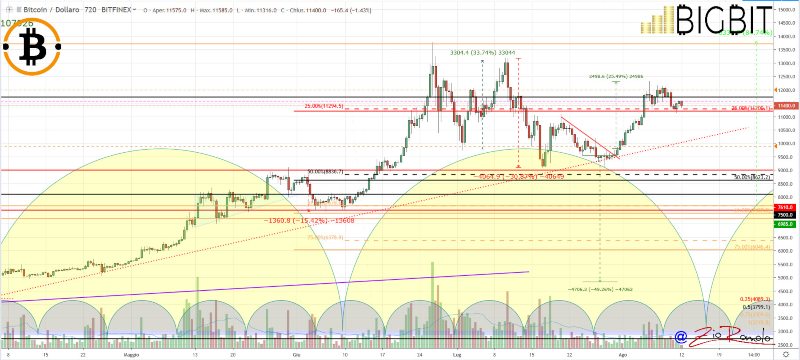
The movement of bitcoin (BTC)
For about a week, Bitcoin has been showing how the $11,500 area is a watershed in the short term, giving no signs of weakness despite the uncertain period of the weekend, with prices testing the support level of the short term at $11,200.
It is important for the price of bitcoin to go beyond the $12,000 threshold, tested several times last week without particular success. If this is not the case, it is important for the price not to fall below $10,800.
Given the low volumes, there is a risk of intraday speculation that would push prices to test the dynamic trendline that started from the lows of early April and which passes through 10,200-10,000 dollars.
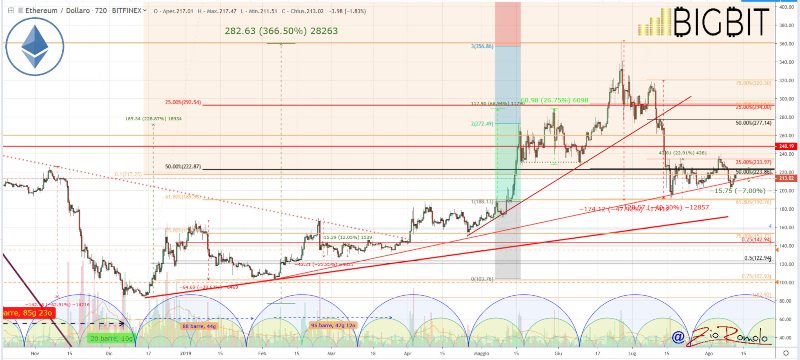
The movement of ethereum (ETH)
During the weekend, the price of ethereum dipped just below the dynamic trendline of 205 dollars, targeting the psychological threshold of 200 dollars, where there were coverings that brought the prices just over 210 dollars.
The bullish trend continues to be valid, even though this break and the passing of the hours are increasingly tantalising the possibility of a trend that should have been triggered last week in line with the new monthly cycle.
This hypothesis does not appear to be confirmed because the first signal to support it would be for the prices to return with a decisive leap to 235 dollars. On the contrary, if prices in the next few hours were to return below 205-200 dollars, Ethereum would return to a new phase of weakness.


