The bearish movement of last night, in just under two hours, caused a crash in the price of bitcoin which lost 15%. And as is usually the case, bitcoin has dragged the rest of the cryptocurrency industry.
After the flat calm that had characterised the last few weeks bringing volatility back to the lowest levels of the last five months, yesterday the collapse took place after 8 PM (UTC+1), shaking the dormant trend of the entire sector. Volatility jumped by more than 50% in 12 hours. The monthly volatility of bitcoin has risen by 3%, more than a point from yesterday morning levels, which is a good picture of what has happened in the last few hours.
Trading volumes also exploded with daily averages of 100 billion, +40% from yesterday’s levels. Bitcoin trading has reached its highest level since mid-August when markets had recorded a similar bearish movement in just a few days. But the August decline marked a loss of more than 15% in about 48 hours, while what happened yesterday developed in only a handful of hours.
Unlike the bearish movements of August, the crash of the bitcoin price yesterday broke the support threshold that since June had rejected any bearish attack, and this is a signal that changes the trend in the short and medium-term, which should be followed carefully.
Nevertheless, the bitcoin price remains positive with +130% since the beginning of the year. Taking as reference the openings of the last 4 months of the first 10 cryptocurrencies, only bitcoin records a positive balance on May and June, while in July, August and September (the latter historically favourable to the Bears) also BTC aligns itself with the rest of the sector and remains in negative.
A few days before the end of September, Educare (EKT) in 39th position and ABBC Coin (ABBC) in 47th position, are the only ones that have a positive balance on a monthly basis, respectively +10% and +70%.
The Asian night passed without further shocks, confirming the weakness of the whole sector.
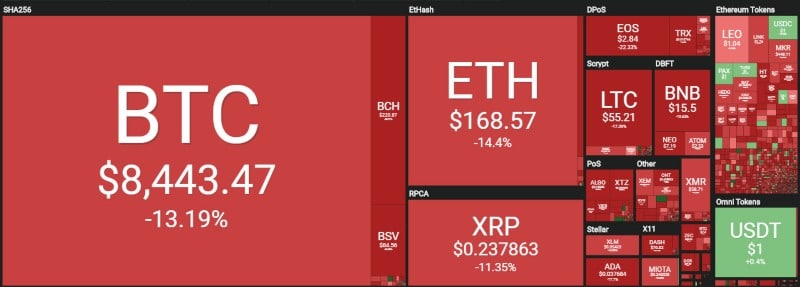
In the top 10, bitcoin stops at a loss of -13% on a daily basis. Worse are Bitcoin Cash (BCH), EOS, Bitcoin Satoshi Vision (BSV) which record losses higher than 20%.

Among the first 100 cryptocurrencies, there is no green sign, apart from stablecoins. Among the worst is Algorand (ALGO), which drops and loses positions with -30% taking it to 58th position at 20 cents, the lowest level since its launch in June, losing 90% from its initial price. A loss that indicates the strong difficulty of the altcoins. Algorand is not the only token that loses more than 90% from the tops of 2019 marked in the first half of the year.
The market capitalisation collapses below $220 billion. These levels have not been recorded since last May, the lowest of the last five months. In this situation of weakness, bitcoin remains the cryptocurrency that shows a recovery of dominance, reaching again 69% of market share. Ethereum falls to 8.2%.

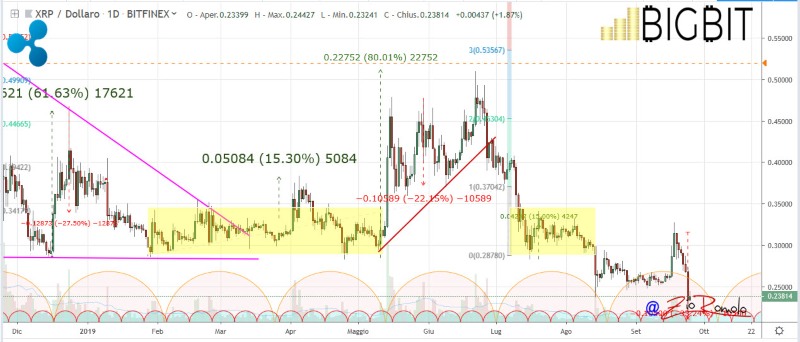
Ripple is stable at 4.6%, despite the further and dangerous sinking that leads Ripple to update the lows of the last two years, with the return of prices to test the 21 cents of a dollar, levels that it had not seen since the first days of December 2017.
A debacle that is followed with a clear correlation by Stellar Lumens (XLM). Among the top 10, Ripple and Stellar are the only two cryptocurrencies that mark a loss of more than 30%, 34% for XRP and 50% for XLM year to date (YTD). Bitcoin Satoshi Vision, with this recent drop, also shows a negative balance from the beginning of the year: -5%.

Bitcoin (BTC) price crash
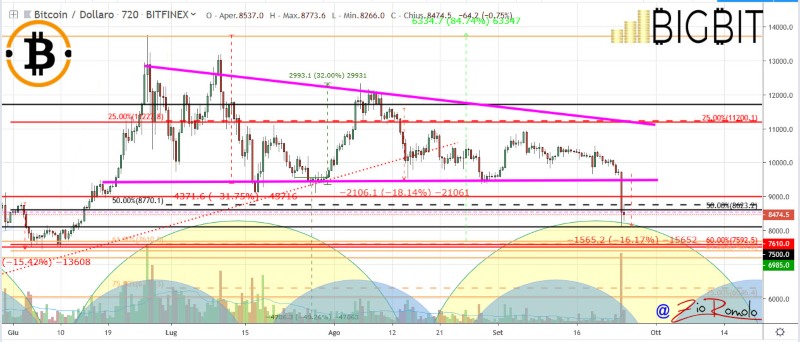
The breaking of the descending triangle, which since last June has had its base at 9,500-9,200, confirms the hypothesis of a sell-off, which has indeed taken place. A sell-off that not only breaks the threshold and the subsequent support in the $8,800 area but goes so far as to test the $8,000. In case of further sinking, holding the $7,600-7,800 area becomes very delicate. If these support levels were to be broken, very dangerous bearish spaces would open up, which could lead to speculation of short selling with additional blows from the Bears.
For bitcoin, unless there is particular news that would again support a return of purchases, in these delicate and critical phases it is preferable to observe whether or not the supports hold rather than aim for the recovery of resistances in the $9,200-9,500 area, levels that now become important.
In the next few hours, BTC needs to start to absorb the bloody blow of the Bear that has created strong losses, by understanding already in the next few days the level where prices will settle.
The bearish movement comes in line with the closing of the hypothetical monthly cycle which indicates a downward trend that did not occur from the cycle between November and December 2018: it is the first bearish cycle after nine months of a lateral or bullish trend.

Ethereum (ETH)
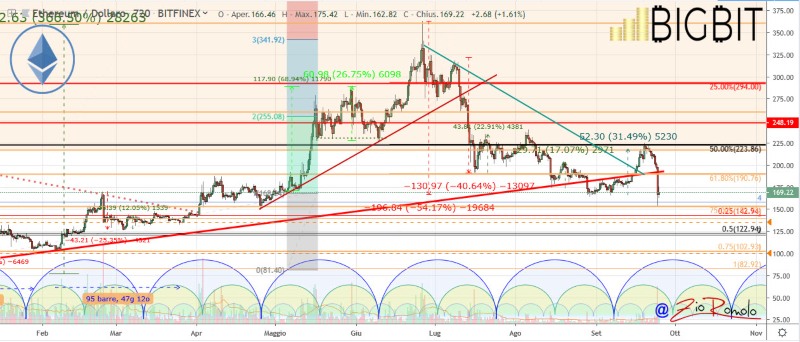
The breaking of the 165 dollars projects the prices of Ethereum to test the $155 area, last bastion that in case of breaking could push the prices dangerously to test the 120-130 dollars.
For Ethereum, unlike bitcoin who had rejected the attack of August 15th, the lows of these hours in the $155 area is the third-lowest low since last mid-August. This continues to highlight the clear bearish trend despite the false bullish signal arrived last week, a rise that was completely cancelled.
The technical structure of Ethereum becomes very critical and weak. Last week’s bullish movement in a dozen days led prices to recover 30%, all cancelled in a matter of hours. ETH need a reaction as soon as possible or it risks to continue the descent downwards.


