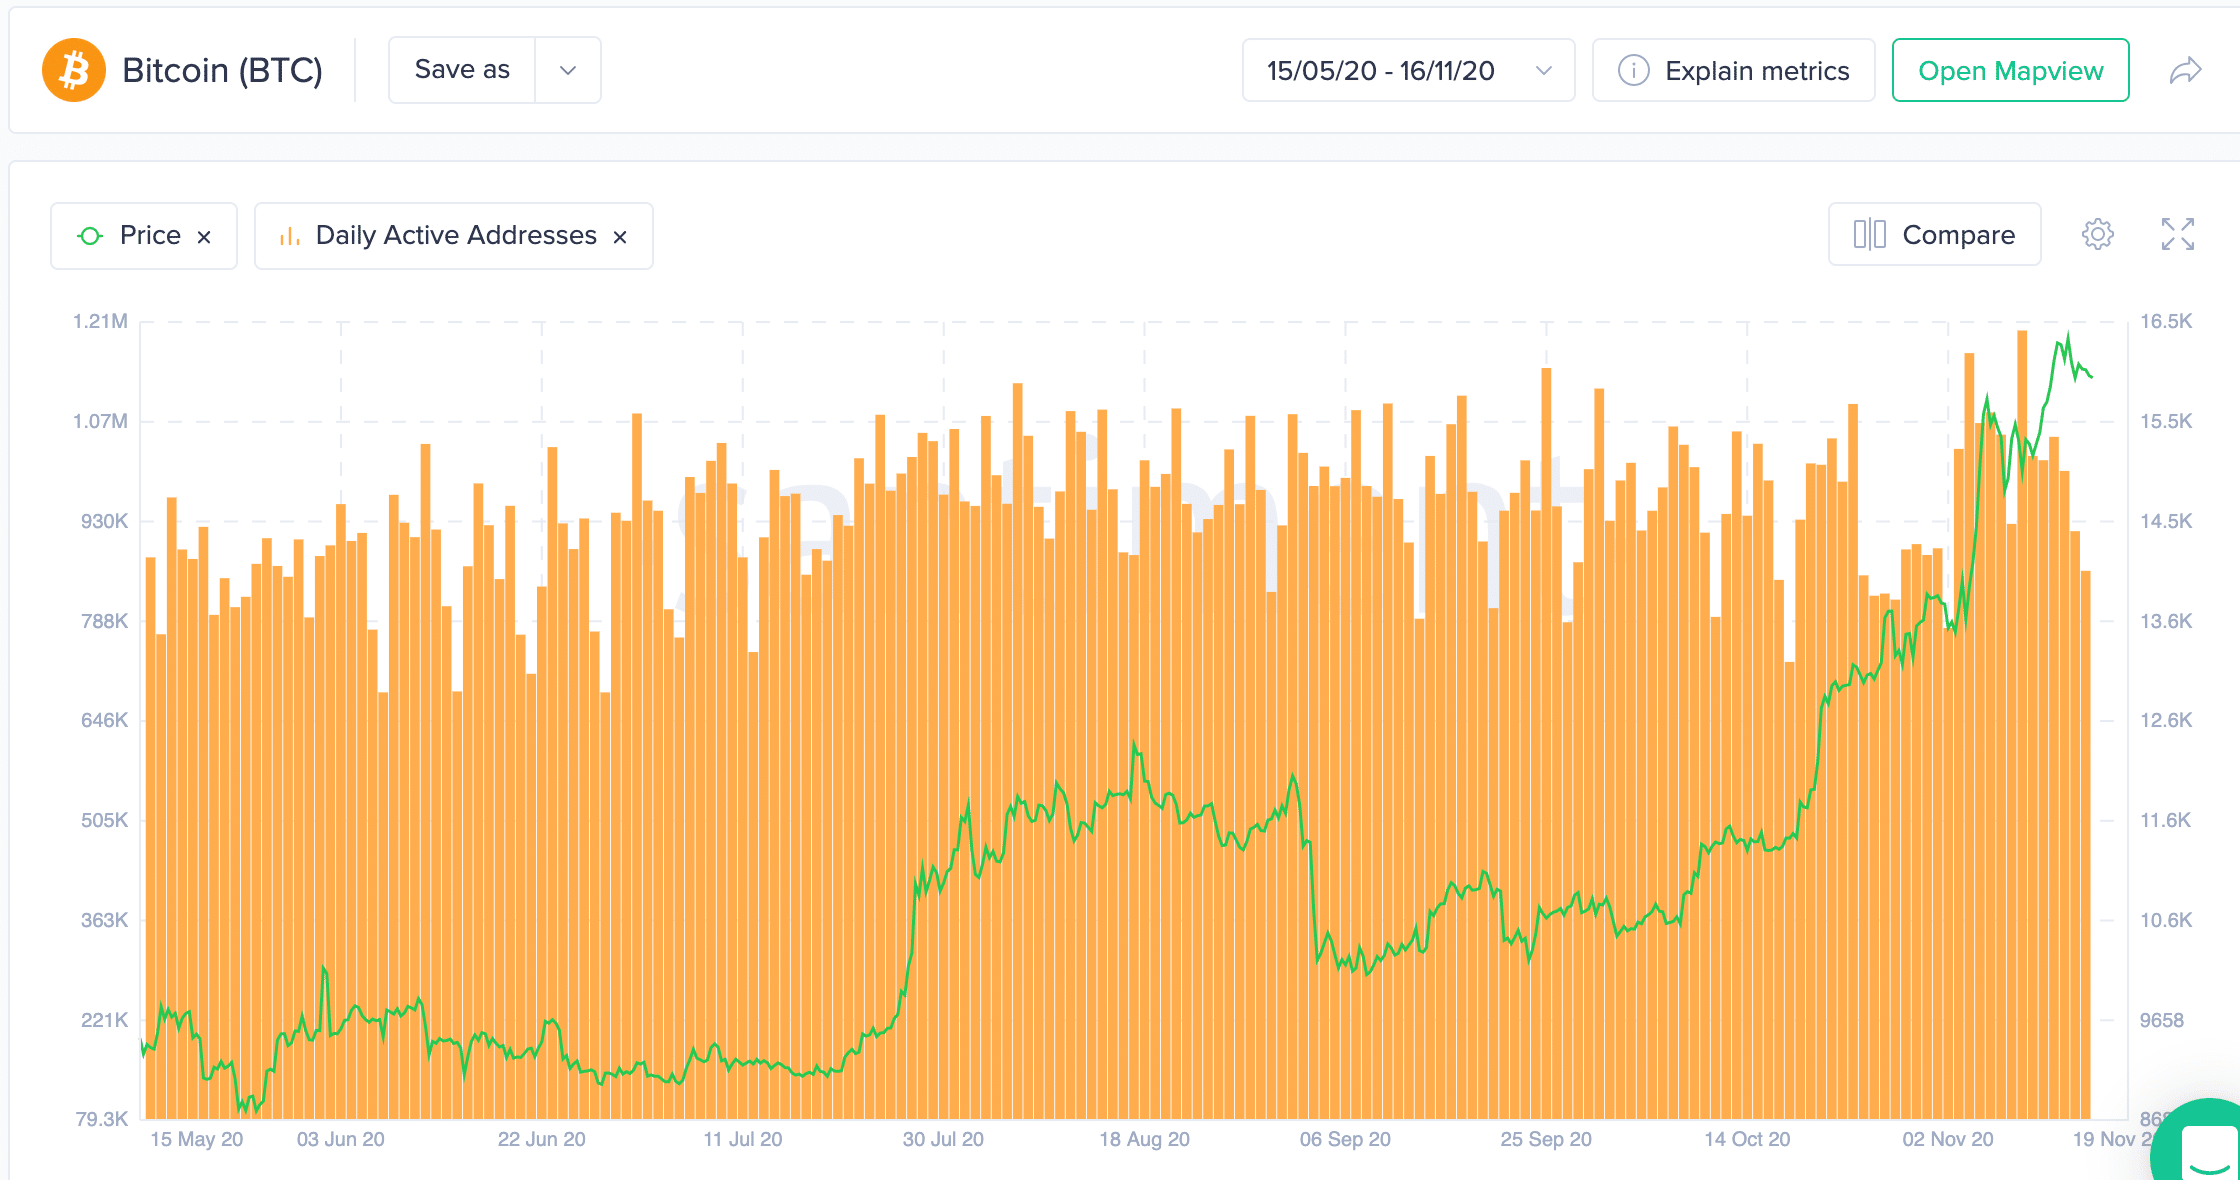
One of the most interesting parameters for analyzing a project and a blockchain is the daily activity of the addresses, and not even Bitcoin escapes this logic.
Address activity indicates whether there is actually movement on a project and to what extent, since more addresses correspond to a solid, decentralized project.
The addresses of Bitcoin
It is possible to extract very interesting data by looking at the number of BTC addresses, which allows predicting with a certain margin how the asset will evolve even on the price side.
We will use the data provided by Santiment to see, on the one hand, the number of active addresses, and on the other, the price of the asset.

A very interesting figure is that reached a few days ago with a real record of 1.2 million active addresses per day, i.e. addresses that have done at least one transaction, whether inbound or outbound.
It is interesting to note that in the last 6 months the number of active addresses has grown and this is even more evident ever since the price of the asset touched the $10 thousand threshold: in fact, the chart shows that below that threshold, the activity of the addresses did not exceed one million.
From this, we can understand that, once the price of Bitcoin reaches a certain level, 2 different and opposite situations take place: on one side there are those who start to sell the asset after months of the price being low; on the other, there are the new users who decide to buy this asset before it is too late and too expensive.
Bitcoin as an investment
Bitcoin has now lost its main function of being primarily a payment system and is seen primarily as a store of value.
This makes Bitcoin a purely speculative asset, as the mentality is now to acquire the asset as a form of investment to be bought at a low price and then sold as soon as it reaches interesting figures.
It should be borne in mind that in the past the price of the asset has increased a lot and it is very close to reaching the record figures of 2017.


