Bitcoin [$32,700] has posted double digit losses by percentage for much of the last 24 hours. BTC is currently -7.59% at the time of writing and clinging to $32k as support.
Historically when price action is so turbulent to the downside there’s a lot of split opinions on the short term outlook of BTC. The below chart from T_V_TreeTrader of TradingView shows how dire a breach of $30k to the downside would be for BTC.

Below the support zone at $30k-$31k there’s very little support resistance until $20k and the former all-time high would be quite likely the next major stop.
A contrary longer term outlook is the below BTC / USD 1W Chart from HamadaMark on TradingView. BTC’s in the center of the current range dating all of the way back to late 2017.
Bitcoin’s 1W Chart may ease potential stress about short term bumps in the road that are inevitable in any market. The BTC market is a few orders of magnitude more volatile however than any other market and these types of downtrends are often when ‘new money’ gets their crypto wings.

Until BTC can close above $40k on a significant timescale the bears are still very much in control and looking to push the price lower.
The weekly trading range for BTC is $31,188-$39,151.
BTC had a daily candle close on Tuesday of $33,339.
DOT Analysis
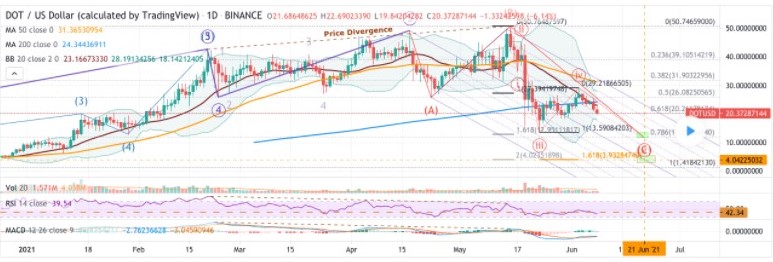
It was only a couple of days ago that DOT was challenging overhead resistance at $30 but at the time of writing DOT’s trying to hold above $20 as the macro outlook has changed dramatically.
With bitcoin still very much controlling the macro outlook on the alt-coin scene for good or bad, Polkadot has taken a step backwards over the last 48 hours.
This chart from Crypto-Swing on TradingView illustrates how steep the drop could be for DOT if the price breaks down below $20.
The next stop below $20 is the 1.618 golden ratio fibonacci zone where traders would almost certainly perceive value at $13.11.

Currently DOT is below the 200 week moving average of $24.34. To regain bullish momentum traders would certainly like to see the price back above the 50 day MA which is $31.36 at the time of writing.
Of course, as noted, much of the short term price action is dependent on one variable – how BTC performs over the next few months. However, if BTC can find a zone to truly trade sideways or climb again incrementally many of the alts like DOT will play out their long term structural patterns [if they haven’t been voided].
Polkadot’s 24 hour range is $19.76-$22.11. The 7 day LOW is $19.76 and HIGH is $27.23.
DOT closed Tuesday’s daily candle at $21.68.


