



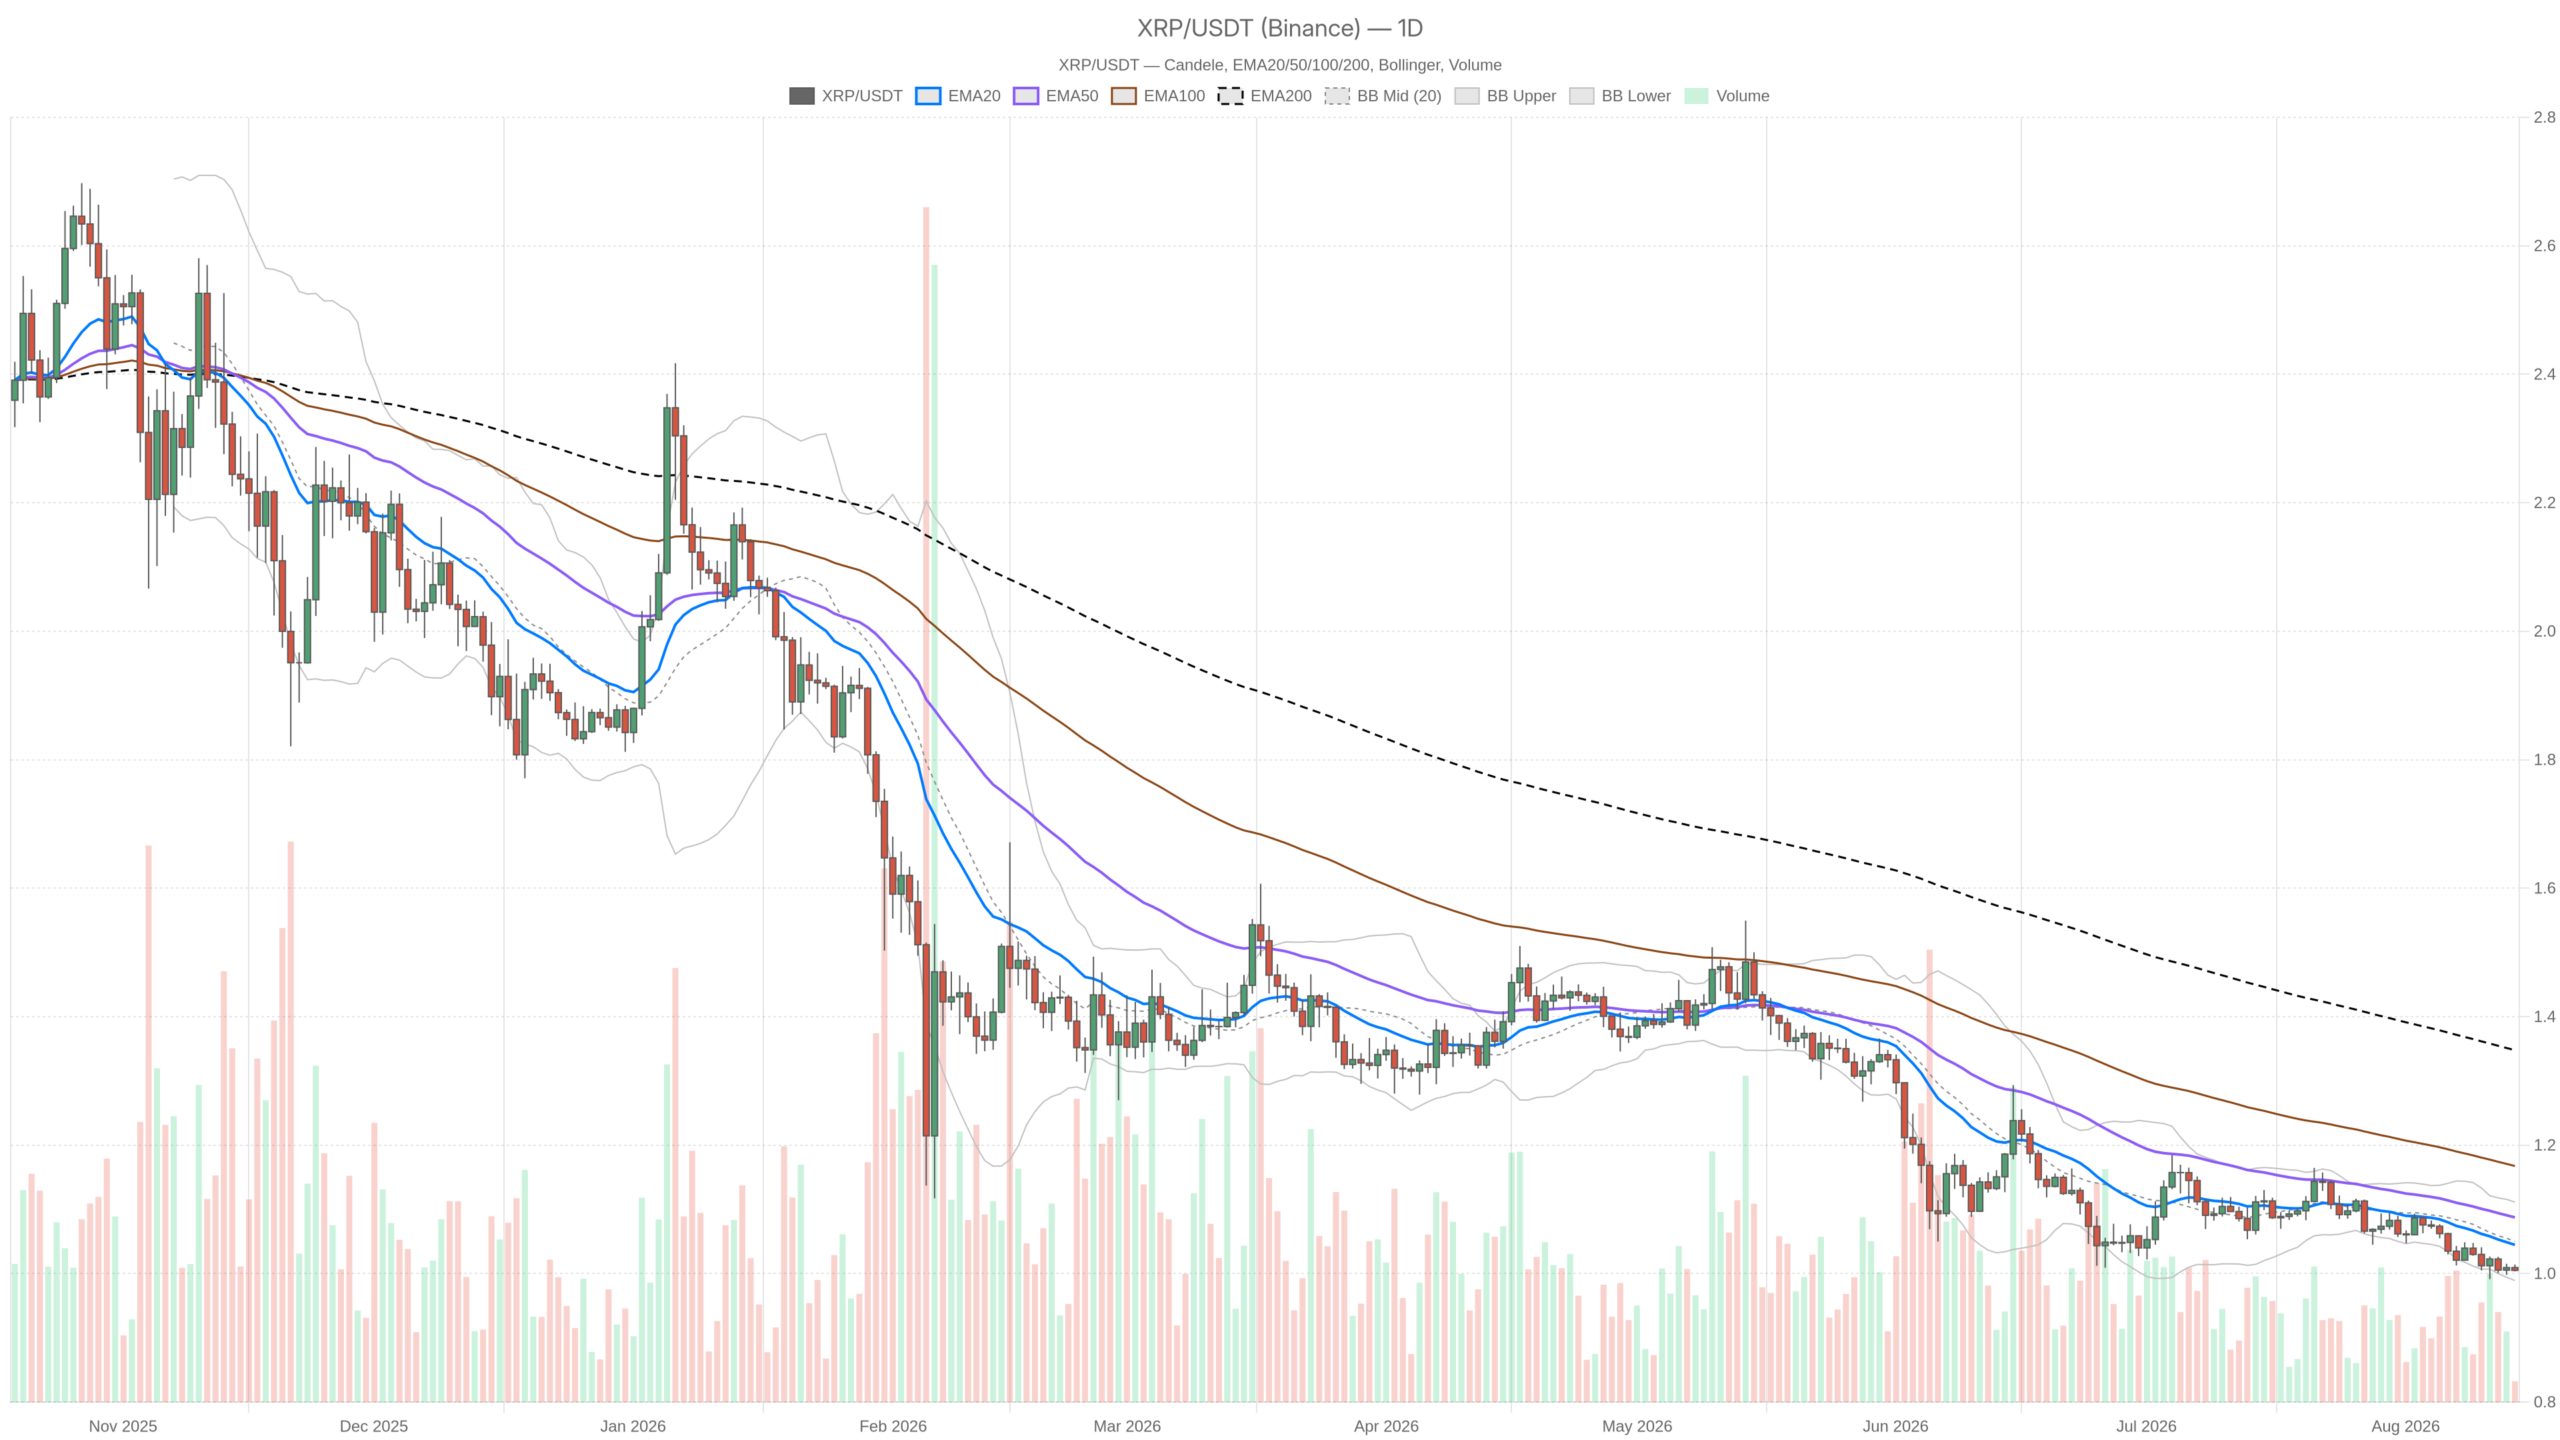
As of August 14, 2026, XRP price rests directly on a pressure point that has built for weeks. Trading at $1.01, it sits below every major moving average while the market backdrop turns defensive. The path of least resistance remains down unless buyers appear near current levels.
Summary
Key takeaways
- XRP traded at $1.01 on August 14, 2026, below the EMA20 ($1.04), the EMA50 ($1.09), and the EMA200 ($1.35).
- Total crypto market capitalization sat near $2.25 trillion, down 0.92% in 24 hours per CoinGecko, while Bitcoin dominance reached 56.08%.
- The Fear & Greed Index read 29, placing the market in Fear territory.
- Daily RSI14 stood at 35.86, with MACD flat near -0.02 and Bollinger Bands between $0.99 and $1.11.
- Immediate support sits at $1.00, with the lower Bollinger Band at $0.99; reclaiming $1.04 could open a bounce.
Daily Chart Sets a Bearish Macro Bias for XRP
On the daily timeframe, XRP’s regime is flagged as outright bearish. Price at $1.01 trades beneath the EMA20 ($1.04), the EMA50 ($1.09), and the EMA200 ($1.35). That full bearish stack places every moving average above price, which is about as clean a downtrend signature as you will see. The gap to the EMA200 shows this is not a shallow pullback. Instead, it is a market that has been losing ground for a while.
Daily RSI14 sits at 35.86, placing XRP in soft-oversold territory without being extreme. Sellers still have technical control, but momentum is thinning enough that a bounce attempt would not be a shock. MACD on the daily chart shows the line at -0.02 against a signal of -0.02, with a flat histogram. Momentum has essentially gone quiet. That is not bullish, but it is not accelerating downside either. It reads more like exhaustion than continuation.
Bollinger Bands on the daily chart show price hugging the lower band. The mid-band sits at $1.05, the upper band at $1.11, and the lower band at $0.99. However, sitting this close to the lower band usually means one of two things. Either the trend is strong enough to keep riding the band down, or the move is stretched and due for a bounce toward the mid-band. ATR14 at 0.02 confirms volatility is compressed right now. That often precedes a decisive move rather than more sideways drift.
1H and 15m Structure: No Relief, Just Confirmation
The hourly chart does not offer much pushback against the daily picture. Price at $1.00 sits below the EMA20, EMA50, and EMA200, all clustered between $1.01 and $1.03. The regime is again marked bearish. RSI14 at 42.18 is a touch healthier than the daily reading, sitting in neutral ground rather than oversold. However, MACD on the 1H is completely flat, with line, signal, and histogram all at zero. That flatness reflects a lack of conviction in either direction on this timeframe.
Moreover, the 15-minute chart mirrors the same story. The close sits at $1.00, with the EMA20, EMA50, and EMA200 all compressed around $1.01. RSI14 reads 39.12 and MACD is flat. Bollinger Bands are tight across both intraday timeframes, spanning roughly $1.00 to $1.01. ATR readings near zero confirm very little energy in the market right now. There is no real tension between timeframes. Daily, hourly, and 15-minute charts all agree on a bearish tilt, with intraday momentum stalled rather than actively pushing lower.
Pivot Levels and the Immediate Battleground
Daily pivot math puts the pivot point at $1.01, resistance (R1) at $1.01, and support (S1) at $1.00. That tight band reflects how compressed this market has become. Meanwhile, the hourly and 15-minute pivots line up almost identically, reinforcing the idea that $1.00 is the line in the sand right now. A clean loss of that level with volume would open the door toward the lower Bollinger Band near $0.99 and beyond. Holding it keeps the door open for a relief bounce toward the $1.04–$1.05 EMA20 and mid-band zone.
Bullish Scenario
For bulls to gain real traction, XRP price needs to reclaim the $1.04 EMA20 on the daily chart and hold above it. That would start to soften the bearish stack. A push back through $1.09, the EMA50, would be the first real sign that the downtrend is losing structural control rather than just pausing.
The oversold-adjacent RSI and the flattening MACD histogram give this scenario some credibility. Momentum sellers are tired, and a squeeze toward the Bollinger mid-band at $1.05 is plausible if buyers step in near support. What invalidates this: a failure to reclaim $1.01–$1.04 and a subsequent break of the $1.00 pivot support.
Bearish Scenario
The more straightforward read is continuation. Price sits below all three daily EMAs, and the regime is tagged bearish across every timeframe. Meanwhile, Bitcoin dominance is rising while total market capitalization slips. That environment favors further downside for altcoins like XRP.
A break below the $1.00 support and the $0.99 lower Bollinger Band would likely accelerate selling toward levels not yet tested on this move. This risk grows if broader risk-off sentiment, reflected in the Fear & Greed score of 29, deepens. What invalidates this: a strong reclaim of the EMA20 and EMA50 cluster at $1.04–$1.09 on rising volume, suggesting selling pressure has genuinely dried up rather than paused.
Reading the Room Before Positioning
XRP now sits in a low-volatility, low-conviction pocket. ATR readings are compressed across every timeframe, meaning the next move could arrive with more force than recent action suggests. The daily trend is bearish, and intraday timeframes offer no real contradiction. Sentiment is fearful rather than greedy. Compressed volatility also raises the risk of false breaks near the $1.00–$1.01 pivot cluster. Traders should weigh the tight range against a macro backdrop where capital rotates toward Bitcoin dominance. The levels above offer context, not guarantees.
FAQ
Where is XRP’s nearest support level?
On August 14, 2026, XRP traded near $1.00–$1.01. Daily pivot support (S1) sat at $1.00, and the lower Bollinger Band at $0.99 marked the next key level below.
Is XRP’s daily trend bullish or bearish?
The daily regime was flagged as bearish. Price at $1.01 sat below the EMA20 ($1.04), the EMA50 ($1.09), and the EMA200 ($1.35), forming a full bearish stack.
What would invalidate the bearish scenario?
A strong reclaim of the $1.04–$1.09 EMA20 and EMA50 cluster on rising volume would suggest selling pressure has dried up. Otherwise, a break below $1.00 and $0.99 could accelerate downside.
Disclaimer: This article is for informational purposes only and does not constitute financial advice, an investment recommendation, or a solicitation to buy or sell any financial instrument or cryptocurrency. The analysis provided is not indicative of future results. Investing in crypto assets and financial markets carries a high risk of capital loss. Always do your own research (DYOR) and consult a qualified financial advisor before making any decision.
Article produced with the assistance of artificial intelligence and reviewed by the editorial team.
