



Bearish momentum continues to dominate digital assets as key technical levels fail to hold. The XRP crypto market is showing clear signs of exhaustion, with price pinned at $1.07 against USDT on July 31, 2026 — a level reflecting the slow, grinding weight of a market that has lost its bid.
Summary
Key takeaways
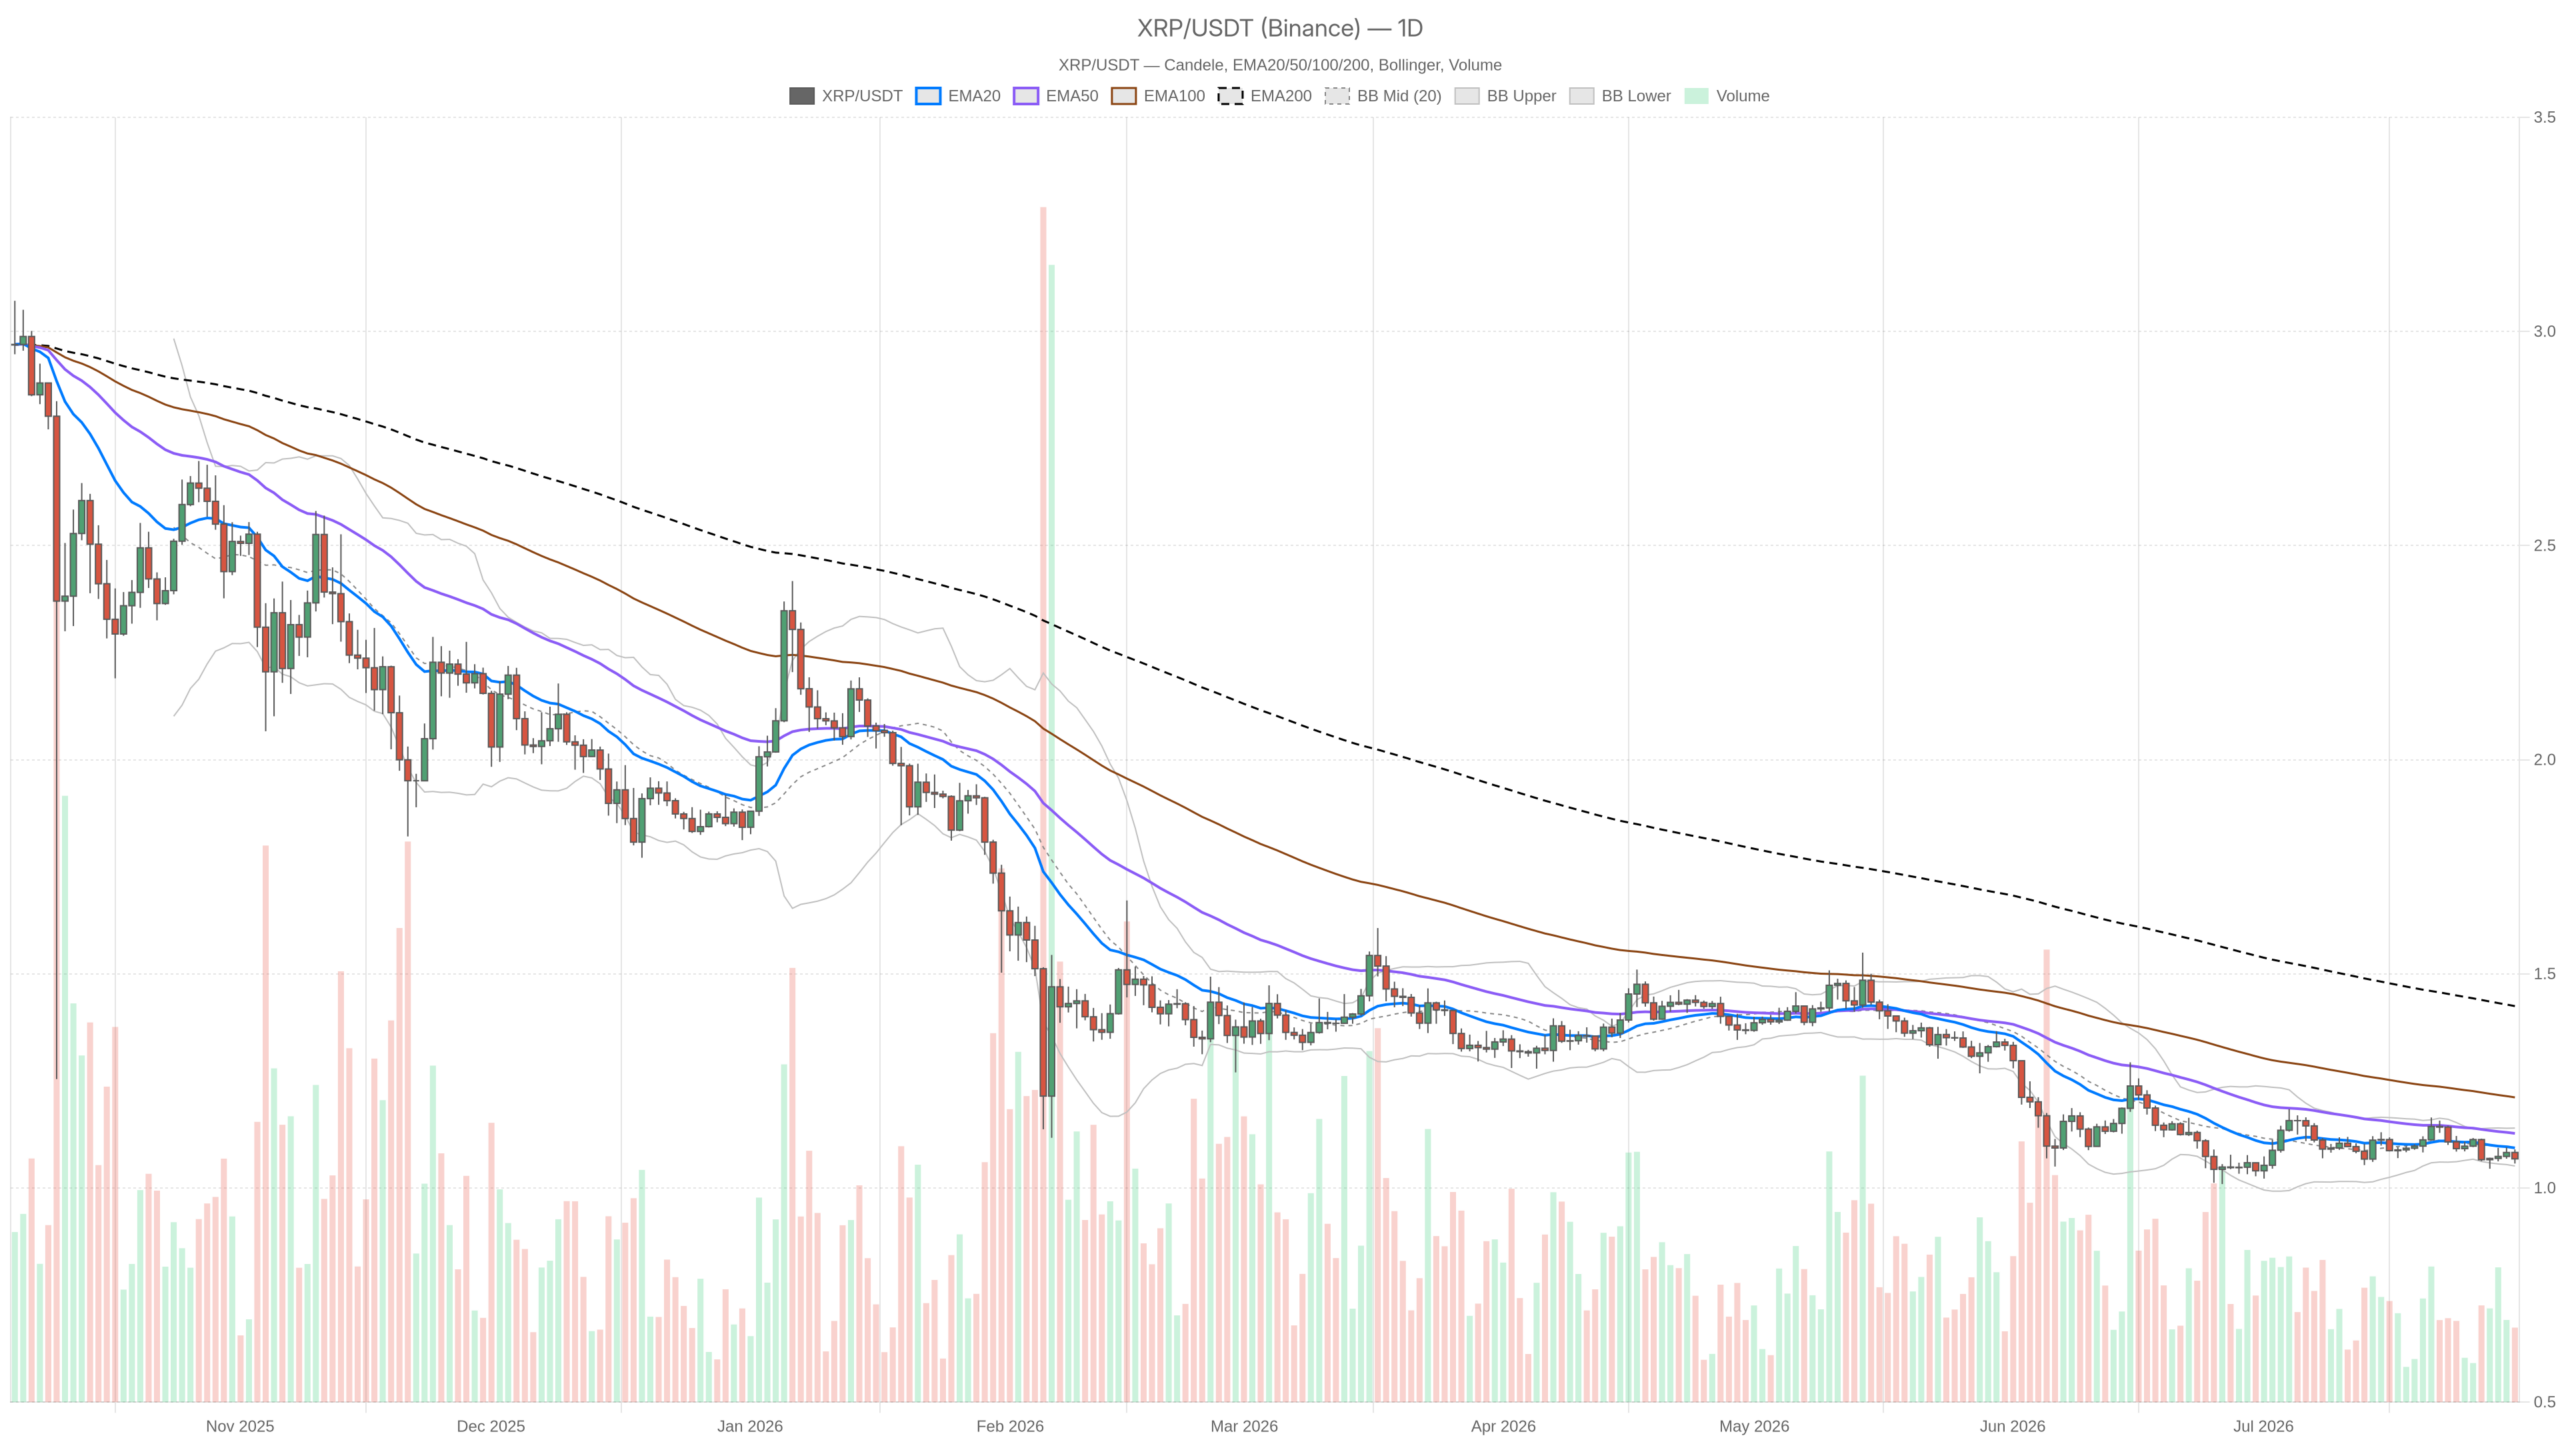
- XRP is trading at $1.07, below all major daily moving averages — EMA20 at $1.09, EMA50 at $1.13, and EMA200 at $1.42
- The Fear & Greed Index reads 25 (Extreme Fear), while Bitcoin dominance has climbed to 56.23%
- Daily RSI at 42.47 signals ongoing weakness without reaching oversold conditions that might attract buyers
- Critical support sits at $1.05, with resistance at $1.09 — the daily EMA20 and hourly EMA200 converge there
- ATR of just $0.03 reflects subdued daily volatility, limiting both directional opportunities
Daily Structure: Price Below Every Meaningful Average
The daily chart leaves little room for ambiguity — XRP is trading beneath every major moving average, and that matters. Price at $1.07 sits below the EMA20 at $1.09, the EMA50 at $1.13, and the EMA200 at $1.42. This full bearish stack signals that every medium and long-term participant who bought into the rally is currently underwater. As a result, the path of least resistance remains downward until one of those levels is reclaimed with conviction.
Moreover, the RSI on the daily chart sits at 42.47 — below the neutral 50 line and firmly in the zone where trending markets stay weak. Bounces in this regime tend to get sold rather than chased. It is not yet at the oversold threshold that would typically attract mean-reversion buyers, which means there is room for further deterioration before a natural floor emerges.
The MACD paints an equally flat picture: both the line and signal are at -0.01, with a histogram of zero. This near-perfect flatness is not neutrality — it is exhaustion. The downtrend has chewed through momentum, and there is no visible catalyst on the MACD to suggest a reversal is building beneath the surface. Meanwhile, Bollinger Bands frame the price action with the midline at $1.10, the upper band at $1.14, and the lower at $1.05. XRP is trading in the lower half of the range, pressed toward the lower band without yet touching it. The daily pivot cluster — with PP, R1, and S1 stacked between $1.05 and $1.09 — confirms the market is coiling in a tight range with limited directional commitment.
Hourly Confirmation: No Divergence, No Recovery Signal
The 1-hour chart does nothing to challenge the bearish daily narrative — in fact, it reinforces it. Price at $1.07 aligns with the EMA20 at the same level but remains beneath the EMA50 at $1.08 and the EMA200 at $1.09. That hourly EMA200 at $1.09 is a meaningful near-term ceiling. Any intraday bounce that reaches that level will face real selling pressure from participants using it as a reference to exit longs or add shorts.
Furthermore, the hourly RSI at 40.07 reinforces the weak tone. It is drifting lower, not bouncing, which means momentum is pointing in the same direction as price: down. The MACD on this timeframe is completely flat at zero across line, signal, and histogram — a market waiting rather than acting. Bollinger Bands on the 1H (upper $1.09, mid $1.07, lower $1.06) are tight, which often precedes a volatility expansion. The question is direction, and right now both trend and momentum favor the downside.
15-Minute Context: Compression Before the Next Move
The 15-minute chart adds execution context rather than directional conviction. With price at $1.07 sitting right at the EMA20 and EMA50 (both $1.07) and only marginally below the EMA200 at $1.08, the short-term picture is neutral. However, the RSI here at 49.84 is essentially sitting on the fence, and the MACD is flat. The Bollinger upper band at $1.07 and midline at $1.06 suggest price is pressing against the upper edge of the short-term range. This is not a setup for aggressive entries — it is a compression zone where the next catalyst will define the move.
XRP Price Scenarios: What Would Have to Happen
The Bearish Case
The default scenario, given the current alignment, is a continuation of the drift lower. If XRP fails to reclaim $1.09 — which serves as both the daily EMA20 and the hourly EMA200 — selling pressure is likely to intensify toward the daily Bollinger lower band and S1 pivot at $1.05. A confirmed daily close below $1.05 would open a more meaningful leg lower, with no obvious technical support built below that level in the near-term structure. This scenario is invalidated by a strong volume-backed close above $1.10.
The Bullish Case
A bullish scenario requires a specific sequence: price needs to hold $1.05, build a base, and then clear $1.09 on the daily chart with volume. That would begin to unstack the bearish EMA alignment. From there, $1.13 — the EMA50 on the daily — becomes the next meaningful test. A recovery toward the daily Bollinger upper band at $1.14 is plausible in that scenario but would require the broader market to stabilize. The current Extreme Fear reading and declining total market cap make that difficult to assume. This scenario is invalidated by a clean daily close below $1.05.
How to Think About Positioning Here
XRP crypto is not in freefall, but it is not in recovery mode either. The convergence of a bearish daily regime, an RSI drifting in the low 40s, and sentiment at Extreme Fear creates a high-risk environment for both directions. Longs here are fighting the trend and the macro tape simultaneously. Shorts risk entering a compression zone where a sudden volatility expansion — triggered by any positive catalyst — could produce a sharp, painful squeeze back toward $1.09–$1.10.
The ATR of $0.03 on the daily chart tells you that daily moves are small relative to the range between current price and meaningful overhead resistance. That limits reward on swing longs while simultaneously reducing the urgency to short aggressively at these levels. The market is at a decision point, not a conclusion. Patience and defined risk levels are the only rational tools here — the tape will clarify itself, and forcing a position into a flat, fearful, compressed market rarely ends well.
FAQ
What is the current XRP price and why is it under pressure?
XRP is trading at $1.07 against USDT as of July 31, 2026. The price is under pressure because it sits below all major daily moving averages — the EMA20 at $1.09, EMA50 at $1.13, and EMA200 at $1.42 — creating a bearish stack that keeps medium and long-term participants underwater. Additionally, broader market conditions are unfavorable, with total crypto market capitalization down nearly 1.8% and the Fear & Greed Index at 25, signaling Extreme Fear.
What are the key support and resistance levels for XRP right now?
The critical support level sits at $1.05, which aligns with the daily Bollinger lower band and the S1 pivot. On the resistance side, $1.09 is the most important near-term level — it serves as both the daily EMA20 and the hourly EMA200, making it a significant ceiling. Above that, $1.13 (daily EMA50) and $1.14 (daily Bollinger upper band) represent the next upside targets.
Is now a good time to buy XRP?
Based on the current technical setup, the risk-reward for long positions is unfavorable. The daily RSI at 42.47 shows continued weakness without reaching oversold conditions, and the full bearish EMA stack means the trend remains downward. Any long position would be fighting both the trend and the macro backdrop. A confirmed reclaim of $1.09 with volume would be the first signal that the bearish structure is weakening.
The technical picture for XRP remains cautious. Price at $1.07 reflects a market trapped beneath resistance and lacking the momentum to break higher, yet not collapsing with enough force to offer clear short opportunities either. Until $1.09 is reclaimed or $1.05 is broken with conviction, the most rational approach is to wait for the compression to resolve rather than forcing a position into an indecisive market.
Disclaimer: This article is for informational purposes only and does not constitute financial advice, an investment recommendation, or a solicitation to buy or sell any financial instrument or cryptocurrency. The analysis provided is not indicative of future results. Investing in crypto assets and financial markets carries a high risk of capital loss. Always do your own research (DYOR) and consult a qualified financial advisor before making any decision.
Article produced with the assistance of artificial intelligence and reviewed by the editorial team.
