




On July 28, 2026, the broader cryptocurrency market is under heavy pressure, with the Fear & Greed index registering a bleak 29. In this environment, COTI crypto displays a daily RSI of 80.67 — a level that historically signals exhaustion rather than continuation.
Summary
Key takeaways
- COTI’s daily RSI reached 80.67, indicating extreme overbought conditions on July 28, 2026.
- The Fear & Greed index sits at 29 while total crypto market capitalization dropped 2.76% to roughly $2.25 trillion.
- Bitcoin dominance climbed to 56.39%, signaling defensive capital rotation away from high-beta altcoins.
- Price trades at $0.01 with compressed Bollinger Bands, suggesting a volatility squeeze that has not yet resolved directionally.
- The 1-hour chart remains bullish, but the 15-minute RSI near 50 reveals fading intraday momentum.
Daily Chart: COTI Running on Fumes?
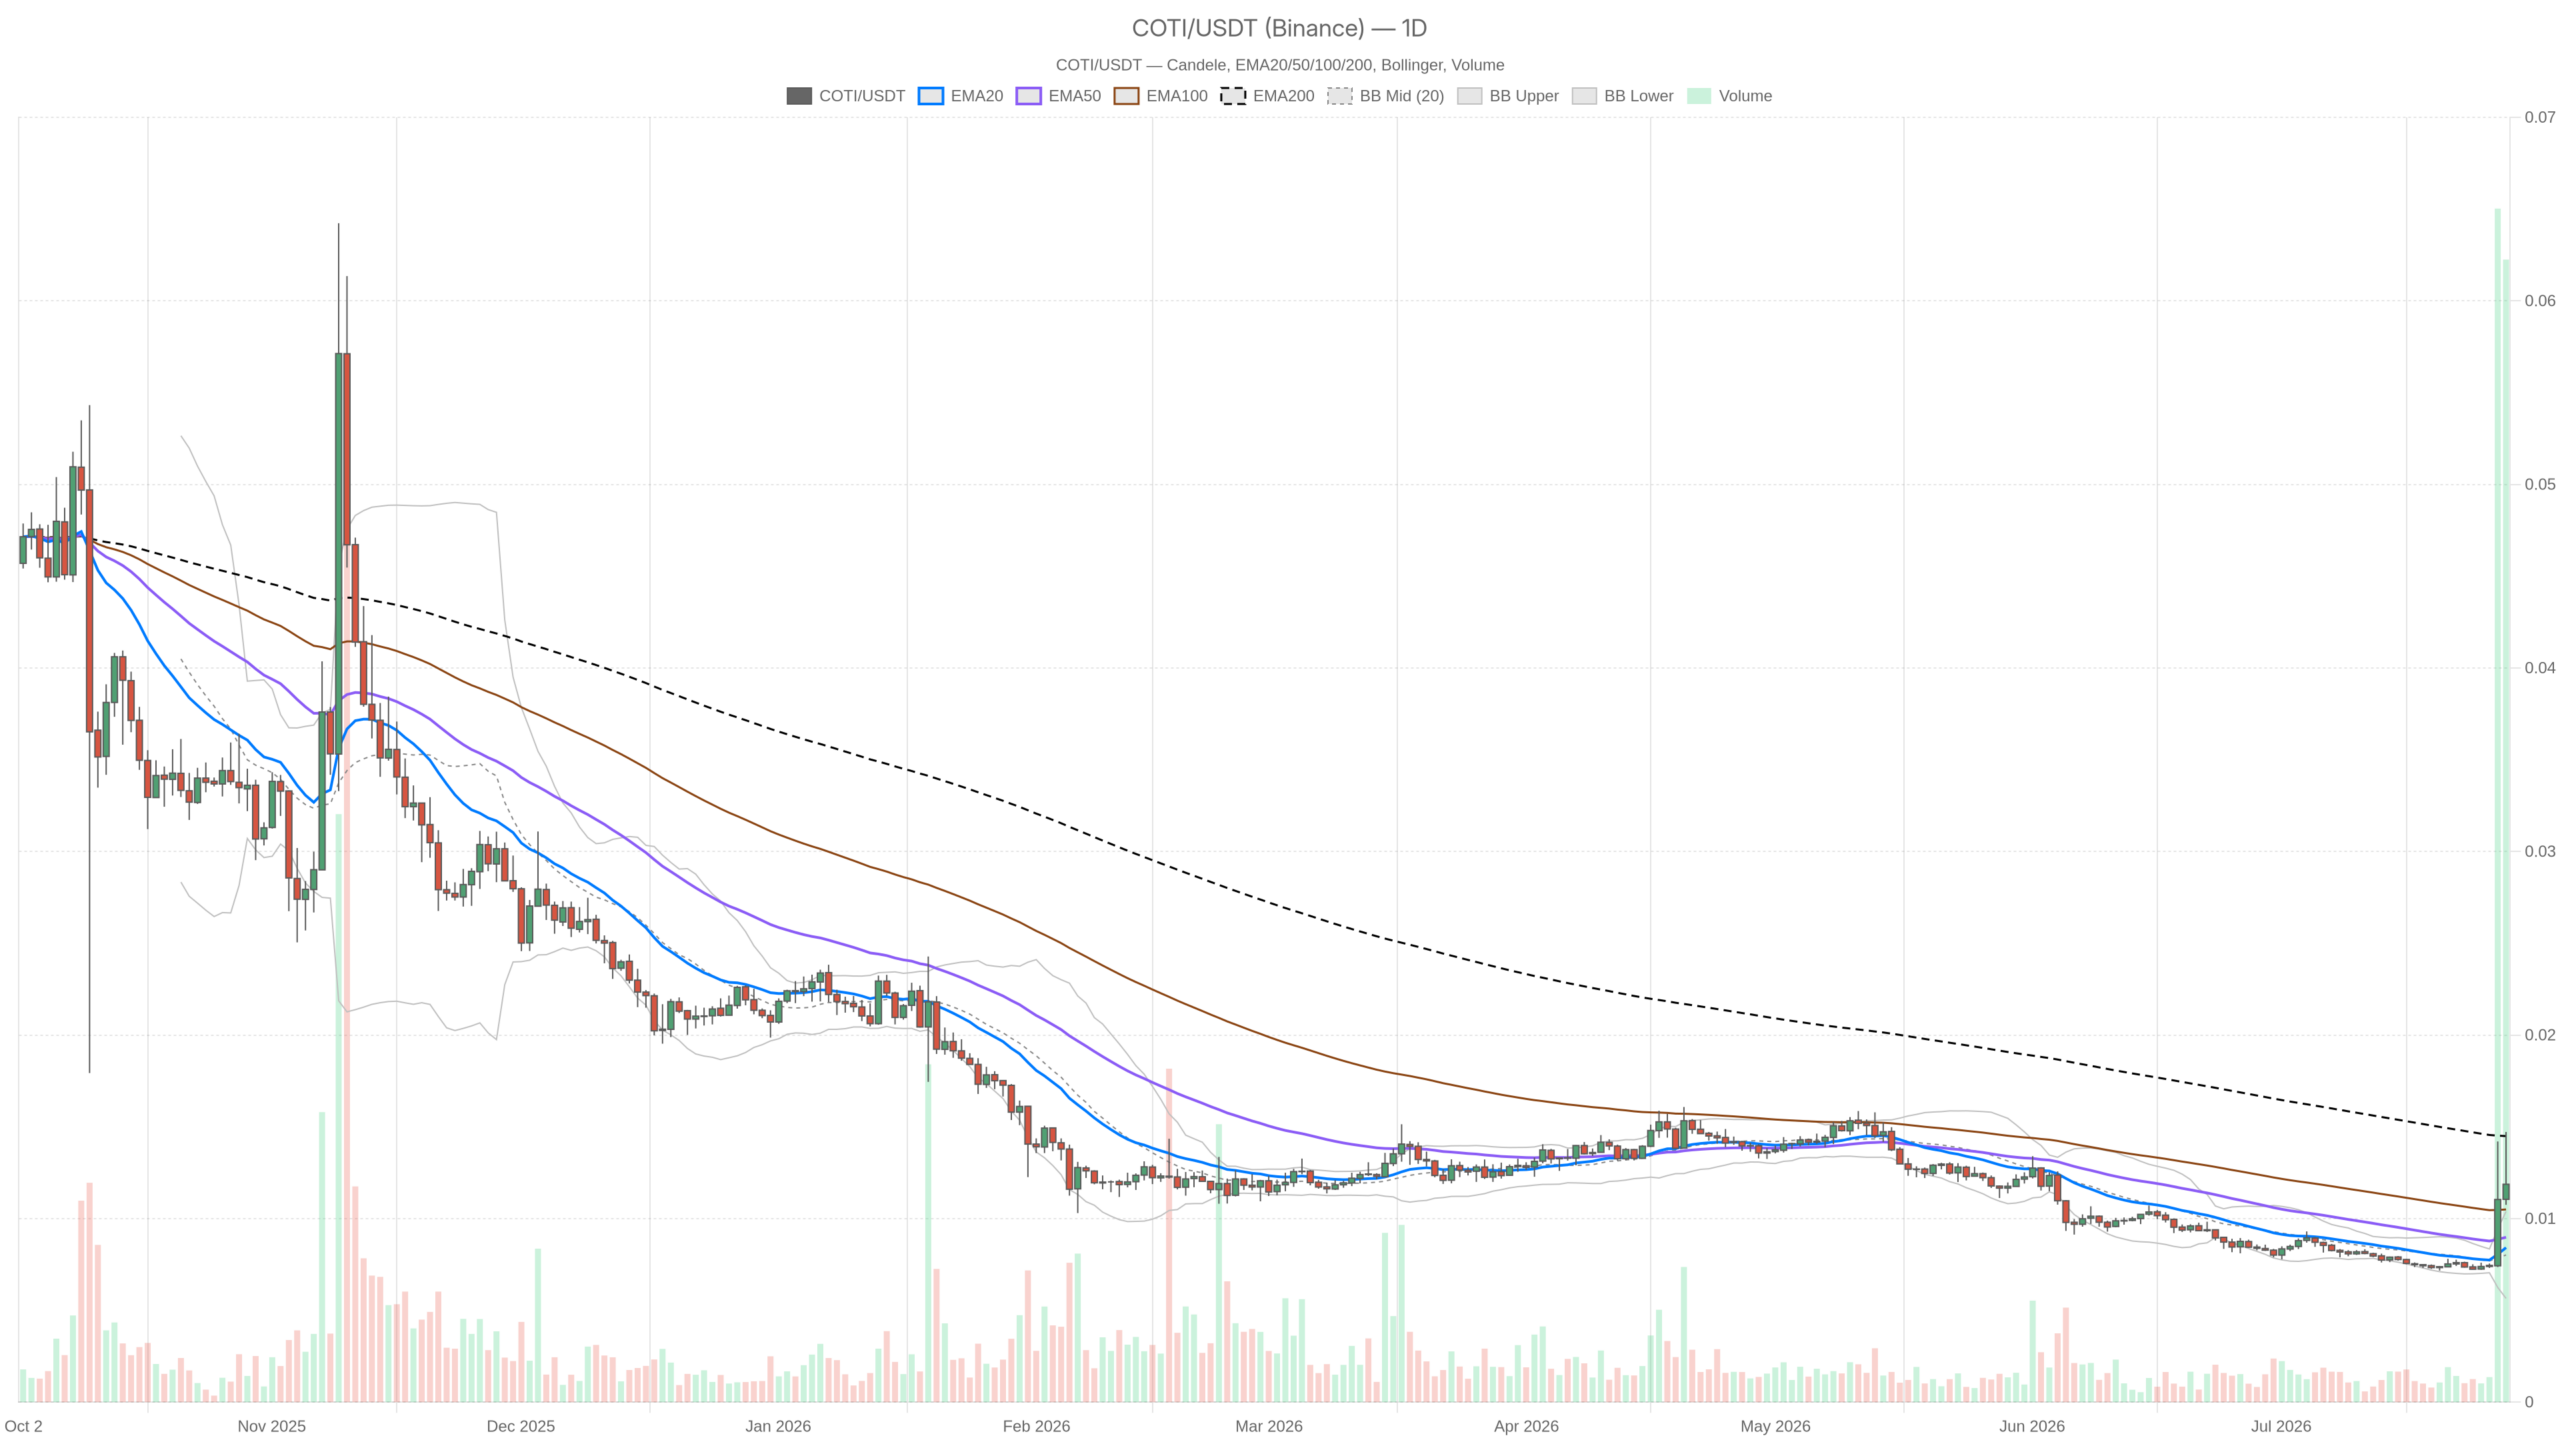
The daily RSI at 80.67 places COTI in extreme overbought territory — a condition that historically resolves through either a sharp correction or a slow, momentum-bleeding sideways grind. However, neither outcome is friendly to anyone chasing the move at current levels, even though sustained readings above 80 are not impossible during a genuine breakout.
The 20, 50, and 200 EMAs on the daily are all converging around the $0.01 mark. This cluster, with no meaningful separation between the averages, often signals that the asset has just emerged from a compression phase. The current spike represents the first aggressive attempt to break out, and these attempts frequently get faded. Moreover, the Bollinger Bands on the daily are similarly compressed around $0.01, with both bands hugging price. This is another textbook sign of a volatility squeeze that has detonated but has not yet resolved into a clean directional trend.
Meanwhile, the MACD on the daily is effectively flat, with line, signal, and histogram all registering as negligible. The RSI is shouting while the MACD is whispering — a divergence in momentum signals that typically favors caution. If the MACD were confirming with a strong positive histogram, the daily overbought RSI could be rationalized as a breakout in progress. Instead, it raises the question of whether this is a real momentum shift or simply a short-term spike into thin liquidity. The daily regime is classified as neutral, meaning the trend has not yet confirmed.
Intraday Structure: Bullish Regimes Fading Fast
The 1-hour chart remains in bullish territory, with the H1 RSI sitting at 57.3 — comfortably above neutral but far from overbought. This is the only timeframe where the upper Bollinger Band breaks away from the $0.01 cluster, expanding to $0.02. That expansion confirms a real volatility event on the hourly and marks $0.02 as either the next key resistance to watch or a sign that momentum is already stretching.
However, the 15-minute chart brings the picture back to earth. RSI on M15 has slipped to 49.81 — essentially neutral, sitting right on the midline. Despite the regime classification labeling it bullish, an RSI near 50 on the 15-minute suggests the intraday move is losing steam at the execution level. The move that drove the hourly bullish setup has paused and is consolidating. Momentum remains nominally intact, but it is not accelerating.
The Timeframe Conflict Is Real
A genuine tension runs through this multi-timeframe read. Specifically, the daily is overbought and neutral in trend regime, the 1-hour is bullish and has room to move, and the 15-minute is stalling. These three timeframes are not telling the same story, and that ambiguity typically marks a point of decision rather than continuation. When the daily RSI hits 80.67 and micro structure loses momentum, the probability-weighted outcome leans toward a pullback or a frustratingly choppy range.
Bullish Scenario: What Needs to Happen
For the bull case to play out, price must hold above the $0.01 EMA cluster on the daily and convert that level into support on any intraday pullback. A reset of the 1H RSI toward the 40–50 zone — without breaking the hourly structure — would actually be constructive, resetting conditions for another attempt higher. The $0.02 upper Bollinger Band on the 1H becomes the first meaningful target if momentum reloads.
That said, bulls need to see the daily regime shift from neutral to bullish with a MACD histogram that starts building in positive territory. Until that happens, any upside is essentially a short-term trade, not a trend position. This scenario gets invalidated immediately if price fails to hold the $0.01 pivot cluster on the daily and begins closing daily candles below it. A daily close beneath that level with the RSI rolling over from 80+ would be a textbook exhaustion reversal signal.
Bearish Scenario: The Reversal Risk
The bear case has more near-term technical support given the daily RSI reading. An RSI of 80.67 on the daily, combined with flat MACD confirmation and a neutral trend regime, historically precedes a mean-reversion move. The Bollinger Band squeeze on the daily resolving to the downside — with price breaking back toward the lower band at $0.01 — would signal that the breakout attempt has failed and that sellers are taking control. In a broader market where fear dominates at a reading of 29 and altcoins are underperforming BTC, that scenario has real teeth.
The bearish case gets invalidated if COTI crypto manages a sustained daily close with the RSI holding above 70 while the MACD begins to turn positive. Breakouts can remain overbought for longer than seems rational, especially in low-liquidity tokens. However, for that to happen, broad crypto market conditions would need to stabilize — hard to see with BTC dominance rising to 56.39% and total market cap contracting.
Positioning and Risk: What Matters Now
Anyone already holding COTI from lower levels is sitting on a compressed-to-extended move that the daily chart flags as potentially exhausted. At this juncture, the disciplined approach is to define what a daily close breakdown looks like and respect it, rather than treating the recent price action as a new normal. The 15-minute neutrality and the daily overbought condition together make this a poor risk-reward entry for new longs. The asymmetry simply does not favor chasing here.
For those watching from the sidelines, patience is the actual edge. Waiting for either a daily RSI reset toward the 50–60 range with structure intact, or a clean bullish regime confirmation on the daily, would provide a far more defensible entry than the current setup offers. The volatility is real — the H1 Bollinger expansion to $0.02 proves the range can widen sharply — but volatility without directional clarity is just noise. Manage size accordingly, because the macro environment, with the Fear & Greed index at 29 and the broader market under pressure, suggests this is not the moment to be overexposed to a token trading at fractions of a cent. Nothing here constitutes financial advice; it is a read of the tape as it stands on July 28, 2026, and the tape is sending mixed signals.
FAQ
What does COTI’s daily RSI of 80.67 mean for traders?
An RSI reading above 80 on the daily chart places COTI firmly in extreme overbought territory. Historically, such levels resolve through either a sharp correction or a prolonged sideways consolidation that bleeds momentum. With the MACD remaining flat and the trend regime classified as neutral, this reading signals exhaustion risk rather than confirmed breakout strength.
Is now a good time to enter a long position on COTI?
The current setup offers poor risk-reward for new long entries. The daily RSI at 80.67 signals overbought conditions, while the 15-minute RSI near 50 shows fading intraday momentum. Combined with a macro environment where the Fear & Greed index sits at 29 and Bitcoin dominance is rising, chasing the move at current levels carries elevated downside risk. A more defensible approach would be waiting for a daily RSI reset toward the 50–60 range or a clear bullish regime confirmation.
What would invalidate the bearish outlook for COTI?
The bearish scenario would be invalidated if COTI manages a sustained daily close with the RSI holding above 70 while the MACD begins to build a positive histogram. Additionally, broader market stabilization — specifically a reversal in the rising BTC dominance trend and a recovery in total crypto market capitalization — would strengthen the bull case and reduce the probability of a mean-reversion move.
How does the macro environment affect COTI’s price outlook?
With the Fear & Greed index at 29, total crypto market capitalization down 2.76% to roughly $2.25 trillion, and Bitcoin dominance rising to 56.39%, capital is rotating defensively toward BTC. Micro-cap, high-beta assets like COTI typically suffer disproportionately in such conditions. The macro backdrop amplifies the bearish technical signals on the daily chart and reduces the likelihood of a sustained breakout.
Disclaimer: This article is for informational purposes only and does not constitute financial advice, an investment recommendation, or a solicitation to buy or sell any financial instrument or cryptocurrency. The analysis provided is not indicative of future results. Investing in crypto assets and financial markets carries a high risk of capital loss. Always do your own research (DYOR) and consult a qualified financial advisor before making any decision.
Article produced with the assistance of artificial intelligence and reviewed by the editorial team.
