




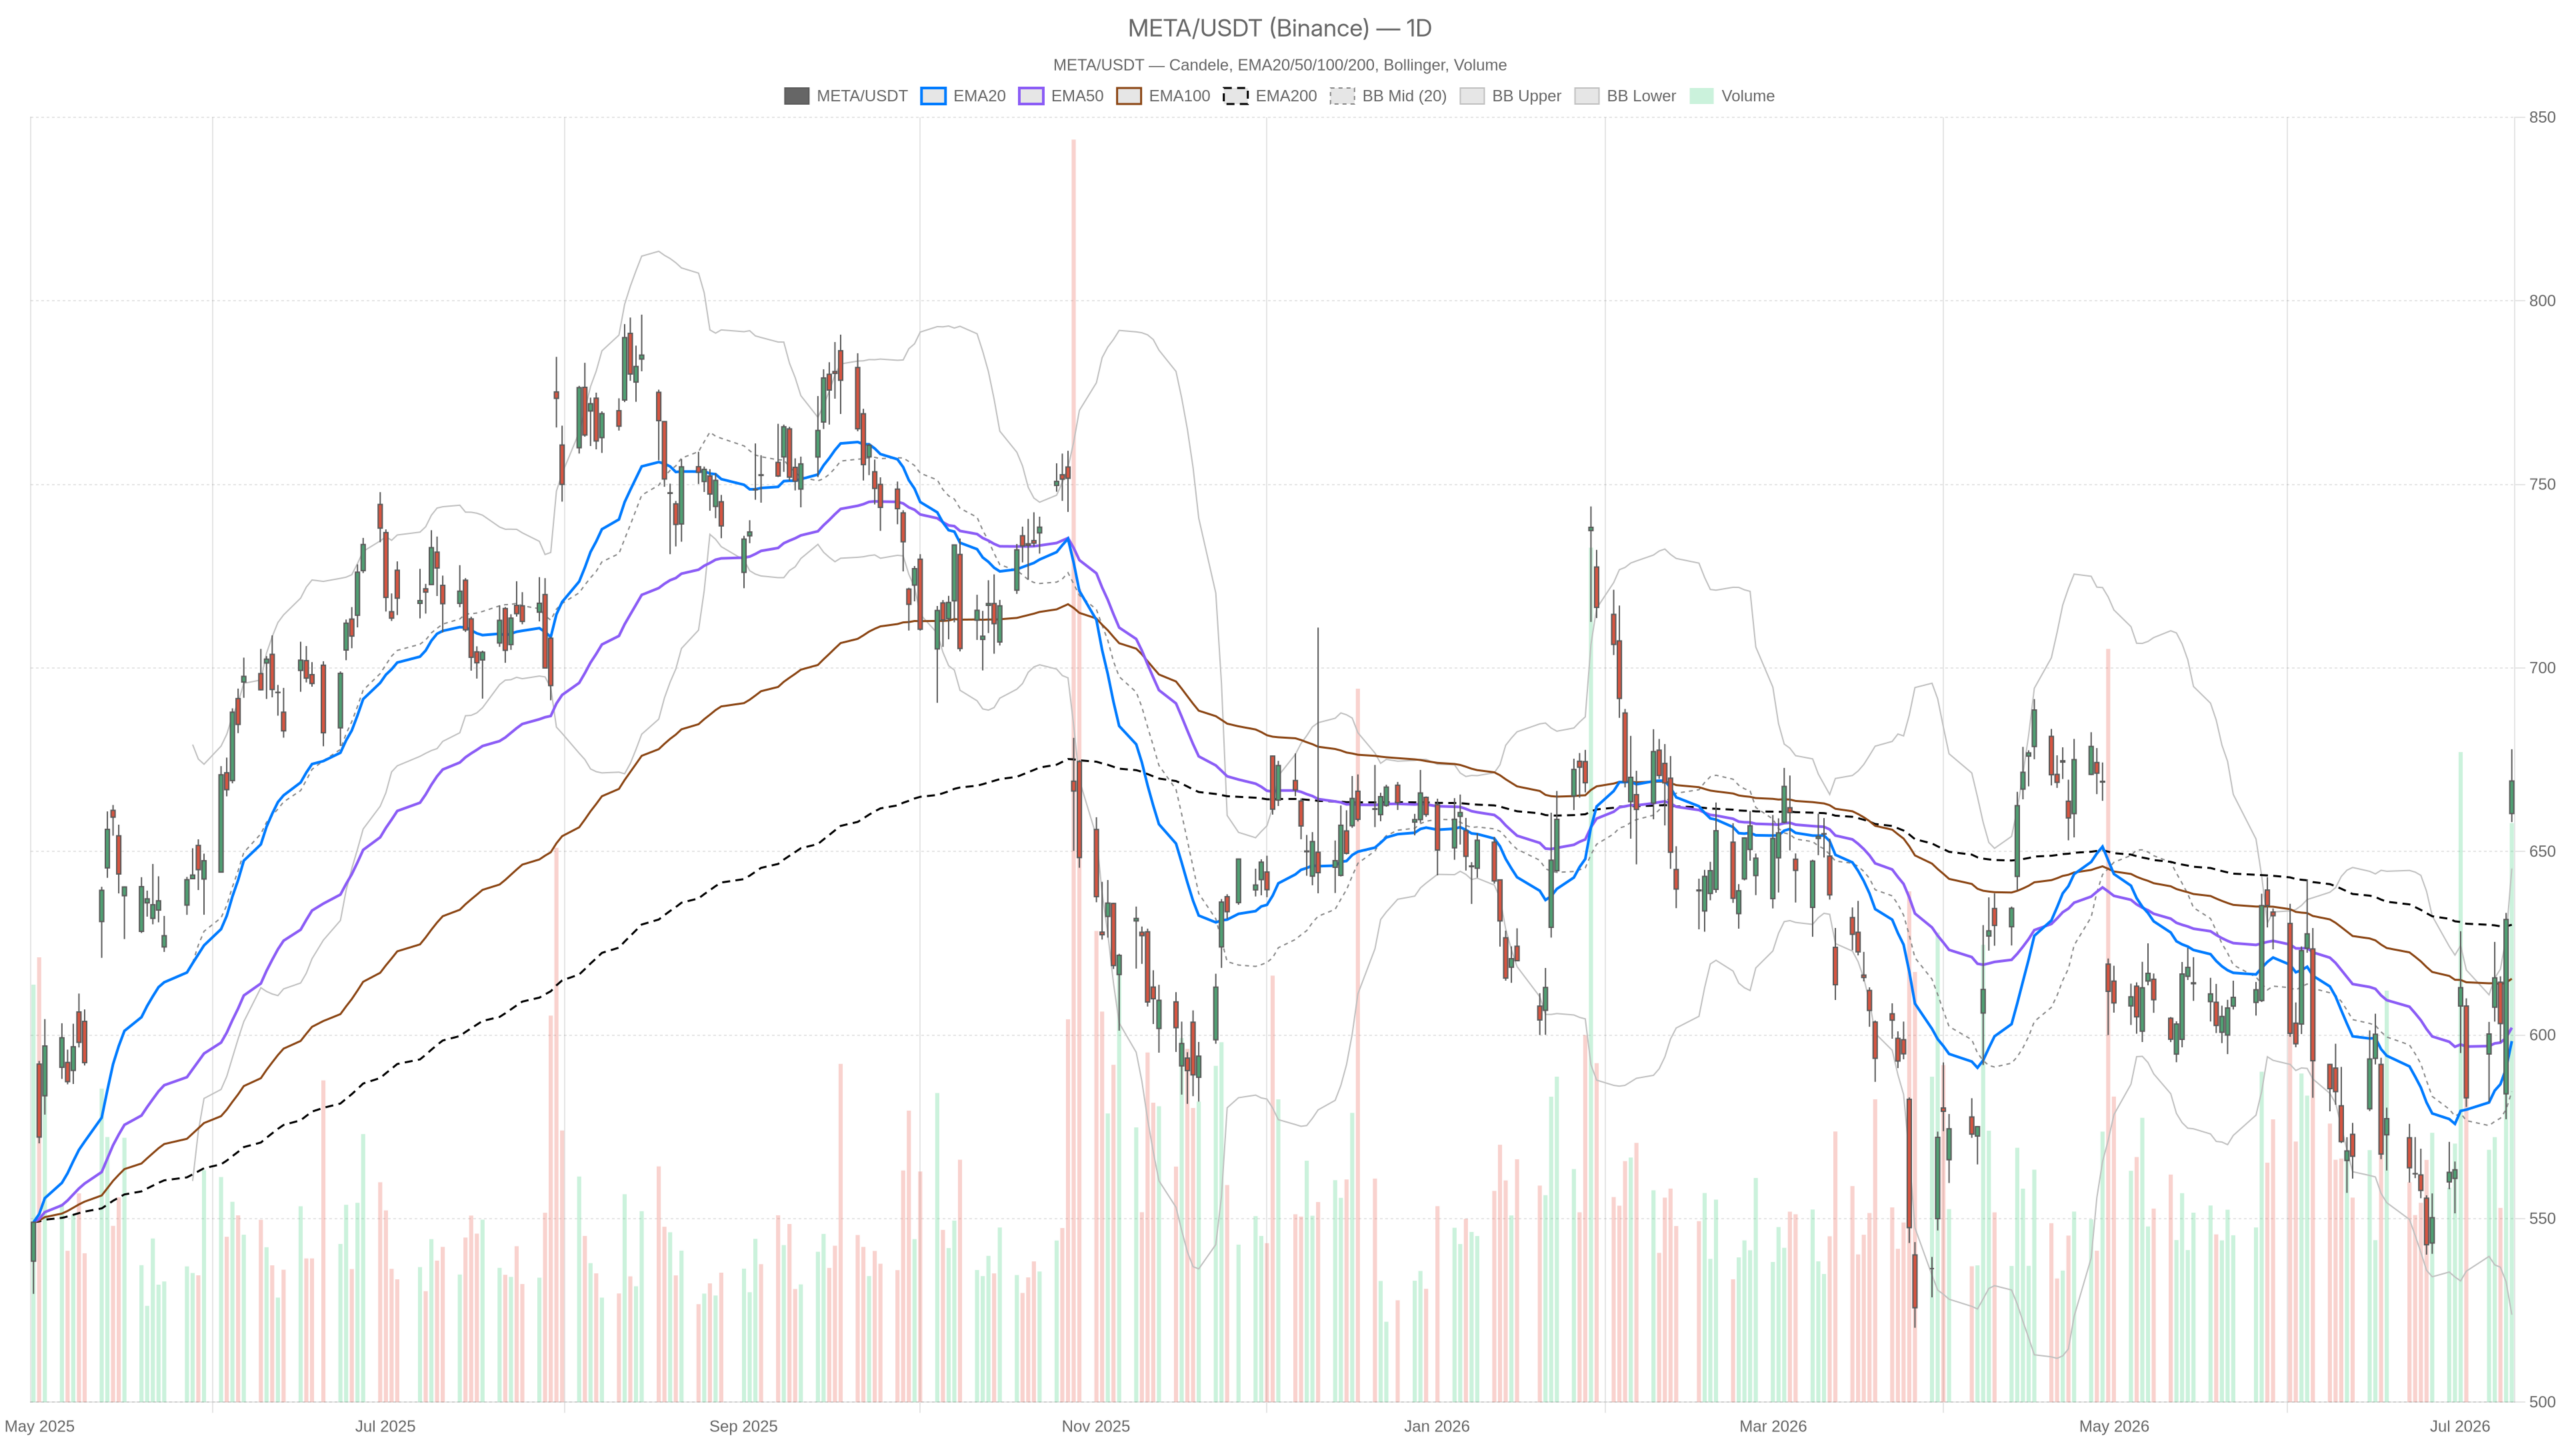
Meta Stock is printing a compelling setup heading into mid-July 2026. At $669.21, META has broken above all three major EMAs and is pressing against its daily Bollinger upper band. The thesis is bullish — but the pace is raising risk flags.
Summary
Key takeaways
- META closed at $669.21 on July 10, 2026, above all three daily EMAs — EMA20 at $598.34, EMA50 at $602.00, and EMA200 at $630.03
- Daily MACD is strongly bullish with a histogram of 11.18, while RSI at 66.34 approaches overbought territory
- Hourly RSI at 72.14 is firmly overbought, creating tension with the otherwise bullish structure
- The 15-minute chart shows a bearish MACD crossover, signaling near-term hesitation
- Meta’s in-house AI chip entering production in September provides a concrete forward catalyst
Daily Timeframe: The Main Bullish Bias
The daily chart confirms a clear bullish trend. META sits above all three exponential moving averages, with expanding MACD momentum supporting further upside. The daily chart tells a clear structural story. At $669.21, META closed comfortably above its EMA20 at $598.34, EMA50 at $602.00, and EMA200 at $630.03. All three averages are stacked in bullish order, confirming the trend has reclaimed meaningful long-term support. This kind of EMA alignment reflects genuine, sustained buying pressure — not a hesitant market.
Momentum and Overbought Signals
The daily MACD reinforces this picture. The MACD line sits at 8.49, well above the signal line at -2.69, generating a histogram of 11.18. That gap is unusually wide and signals strong upward momentum. However, the RSI at 66.34 is approaching overbought territory without quite reaching it. Historically, this zone precedes either a modest consolidation or a final momentum push before cooling.
Bollinger Band Extension and Pivot Context
Meanwhile, the Bollinger Band context adds nuance. The upper band sits at $645.38, while META trades above it at $669.21. Price closing above the upper band is not a sell signal in itself. It does indicate the stock is running hot. Mean-reversion pressure toward the mid-band at $584.61 is slowly building in the background. The daily ATR of $26.84 confirms this is an active, volatile name — a single session swing of that magnitude is entirely normal.
At the same time, META closed near its daily pivot point at $668.36, with R1 resistance at $678.71 and S1 support at $658.86. The stock is essentially coiling around the pivot, suggesting a near-term directional decision is approaching. Interestingly, the daily regime indicator reads ‘neutral’ despite the strongly bullish structure. This likely reflects extended positioning rather than any trend deterioration.
Hourly Confirmation: Momentum Is Alive
Yes — the hourly chart actively strengthens the bullish case. Price sits above all hourly EMAs and the regime is tagged as bullish, though overbought RSI warrants caution. The 1-hour timeframe confirms the daily trend with conviction. META closed the 15:30 candle on July 10 at $669.31. It sits above all three hourly EMAs — EMA20 at $639.01, EMA50 at $615.46, and EMA200 at $595.66. The hourly regime is explicitly bullish, providing direct confirmation of the daily structure.
The hourly MACD also remains constructive. With the line at 18.62 and the signal at 14.36, the histogram of 4.26 shows momentum is still expanding. However, it is doing so at a slower rate than prior sessions. This deceleration is worth monitoring. It doesn’t reverse the trend, but it does suggest the initial impulse may be maturing.
On the other hand, the hourly RSI at 72.14 is firmly in overbought territory. That’s the key tension on this timeframe. The price structure is bullish, yet the momentum gauge is flashing caution. In trending markets, RSI can remain overbought for extended periods — but the risk of a sharp intraday pullback is elevated. The hourly pivot resistance at $672.38 becomes the immediate test level to watch.
15-Minute View: Short-Term Hesitation
The 15-minute chart reveals the first real sign of near-term fatigue. A bearish MACD crossover has emerged, though the broader structure remains constructive. Zooming into the 15-minute chart reveals near-term selling pressure. The 15m MACD histogram has flipped negative at -2.03, with the MACD line at 6.61 crossing below the signal at 8.63. This minor bearish crossover sits within a broadly bullish context. Still, it confirms that very short-term pressure is present at current levels.
The 15m RSI at 64.75 is not yet overbought, which is mildly constructive. Price is trading between the 15m Bollinger Bands, with the lower band at $662.57 and upper band at $673.75. The current level of $669.31 sits just above the midline at $668.16. This is a compression zone. The 15m ATR of $3.45 confirms tight intraday conditions. A breakout or breakdown from this range will be the directional trigger for the next short-term leg.
In execution terms, the 15m setup favors waiting rather than chasing. A pullback toward the $665.40 S1 level — without breaking hourly S1 at $665.07 — would offer a more favorable entry. Buyers would then be aligning with the broader daily trend.
The News Catalyst: AI Narrative Driving Meta Stock’s Surge
AI innovations and in-house chip production plans are driving this week’s Meta Stock surge. However, Zuckerberg’s candid admission about AI bets creates tension between narrative and reality. Technically strong setups rarely happen in a vacuum. This week’s Meta Stock surge was explicitly linked to new AI innovations capturing investor attention, according to The Motley Fool. At the same time, Mark Zuckerberg acknowledged that Meta’s AI bets ‘haven’t come to fruition yet.’ That candid admission coincided with a 5% single-session drop earlier in the week. The decline-and-recovery pattern is significant. It shows the market is willing to dip-buy META even on negative AI commentary, reflecting underlying confidence in the longer-term story.
Separately, reports surfaced that Meta’s newest in-house AI chip is entering production in September. This adds a concrete near-term catalyst to what has otherwise been an abstract AI investment thesis. Chip self-sufficiency would reduce META’s dependence on external semiconductor supply — a structural positive that investors appear to be pricing in gradually.
Bullish Scenario: What Supports Further Upside
A daily close above $678.71 would confirm a breakout toward the $690–$700 range. The AI chip production timeline in September provides a concrete catalyst for sustained buying pressure. The bullish case rests on a clean trend structure, broad EMA alignment, and an expanding daily MACD. A daily close above $678.71 would confirm a breakout from the current pivot cluster. That would open the door toward $690–$700. The AI chip production timeline heading into September provides a forward-looking catalyst. It could sustain institutional buying pressure through the summer.
For this scenario to hold, hourly RSI needs to cool — ideally through sideways consolidation rather than sharp selling. A brief pause near current levels, followed by a renewed push, would be the healthiest continuation pattern. Volume remaining elevated would further validate the move. Notably, the July 10 session printed 40.56 million shares.
Bearish Scenario: Where the Thesis Breaks Down
Failure to hold daily pivot support at $658.86 would risk a pullback toward the EMA200 at $630.03 — roughly a 6% decline. The 5% intraday drop earlier this week shows how quickly downside can materialize. The bearish case is less about trend reversal and more about mean reversion. If META fails to hold daily pivot support at $658.86 on a closing basis, the stock risks a pullback. The target would be the EMA200 at $630.03. That represents a roughly 6% decline from current levels. Given a daily ATR of $26.84, such a move could unfold within just two or three sessions.
Notably, Zuckerberg’s own admission that AI investments are taking longer than expected is a live fundamental risk. Should upcoming earnings commentary reinforce that view, the premium priced into META could compress quickly. The 5% intraday drop seen earlier this week is a reminder that downside velocity in this name can be swift. On the 15m chart, a break below the $662.57 lower Bollinger Band would be the earliest warning signal for short-term traders.
Meta Stock Positioning and Final Take
Meta Stock remains in a dominant uptrend, but overbought signals demand disciplined entry timing. The gap between price and the daily mean makes late longs vulnerable to a swift shakeout. Overall, Meta Stock remains in a technically dominant uptrend on the daily chart. However, the pace of the advance has created real near-term risk. The hourly RSI is overbought. The 15m MACD has already rolled over. Meanwhile, the stock is trading above its daily Bollinger upper band. These are not reasons to turn bearish on a strongly trending asset. Still, they are reasons to be disciplined about entry timing and position sizing.
The market is clearly rewarding META’s AI narrative — even as that narrative faces near-term execution uncertainty. The September chip production date is a hard catalyst. Earnings will be the real stress test. In the meantime, the daily structure favors bulls. The hourly picture confirms momentum. And the 15m setup asks for patience before the next entry. Volatility remains elevated, and the gap between price and the daily mean is wide enough to make late longs vulnerable.
FAQ
Is Meta Stock overbought right now?
The hourly RSI at 72.14 is firmly overbought, while the daily RSI at 66.34 is approaching but not yet in overbought territory. This creates near-term risk, though trending markets can sustain overbought readings for extended periods.
What are the key support levels for META?
Key support sits at $658.86 (daily S1 pivot), followed by $630.03 (EMA200). A break below $658.86 on a closing basis would be the first warning of a deeper pullback, with roughly 6% downside to the EMA200.
What is driving Meta Stock higher?
The AI narrative is the primary driver, with Meta’s new in-house AI chip entering production in September 2026 providing a concrete catalyst. The market is also rewarding META despite Zuckerberg’s acknowledgment that AI investments haven’t fully materialized yet.
Should I buy Meta Stock at current levels?
The daily structure favors bulls, but the hourly RSI is overbought and the 15m MACD has rolled over. Waiting for a pullback toward $665.40 — without breaking hourly S1 at $665.07 — would offer a more favorable entry for buyers aligning with the broader trend.
Disclaimer: This article is for informational purposes only and does not constitute financial advice, an investment recommendation, or a solicitation to buy or sell any financial instrument or cryptocurrency. The analysis provided is not indicative of future results. Investing in crypto assets and financial markets carries a high risk of capital loss. Always do your own research (DYOR) and consult a qualified financial advisor before making any decision.
Article produced with the assistance of artificial intelligence and reviewed by the editorial team.
