




Meta stock is trying to stabilize near 610, but the broader setup still looks cautious rather than constructive. While short-term selling pressure is easing, the daily chart remains the anchor and still does not support a clear bullish thesis.
Summary
Meta stock sits in a key decision zone
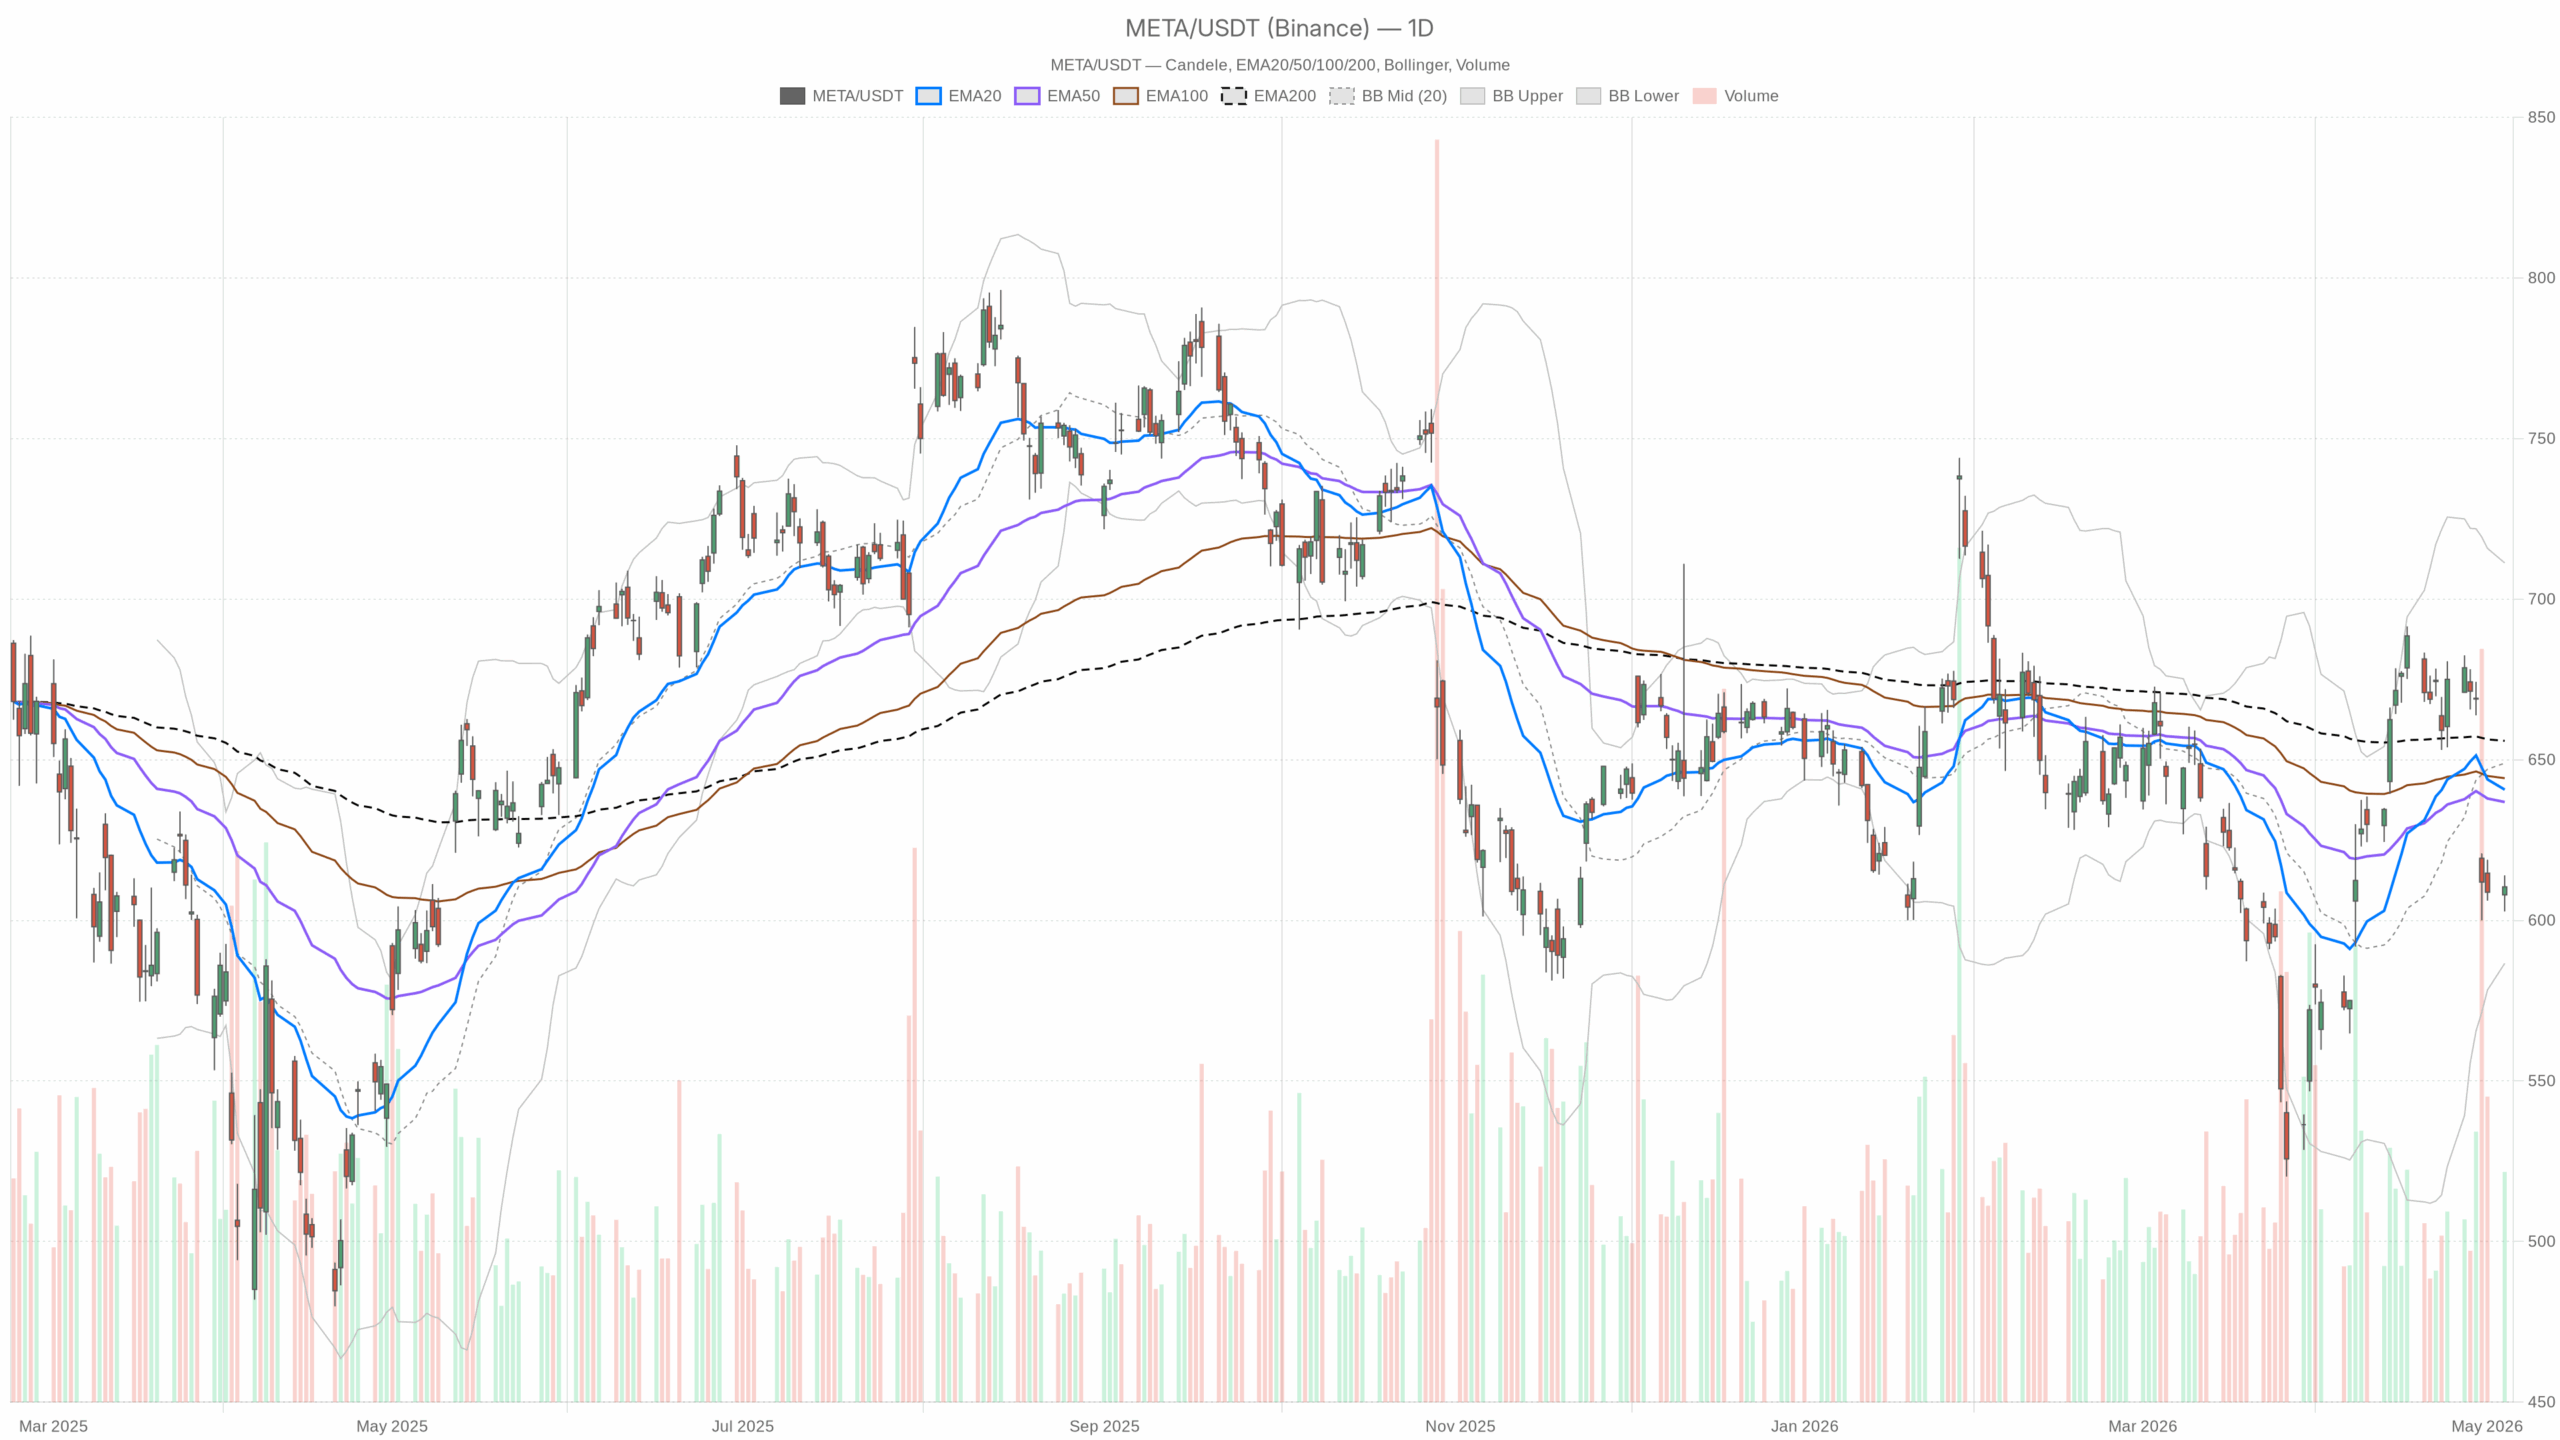
On the daily timeframe, Meta closed at 610.41 after trading between 602.75 and 614.00. That leaves the stock almost exactly on the daily pivot at 609.05. Nearby resistance stands at 615.36, while first support comes in at 604.11.
In practical terms, the market is sitting in a decision zone. It is not breaking down decisively. However, it is not reclaiming control either.
Daily Meta stock trend remains under pressure
EMA structure stays a headwind
Notably, the daily EMA structure is still a clear headwind. Meta is below the 20-day EMA at 640.69, the 50-day EMA at 636.84, and the 200-day EMA at 655.88. That alignment shows the stock remains under pressure across the short-, medium-, and long-term trend layers.
Until price starts reclaiming those averages, rallies look more like recovery attempts than a confirmed trend reversal. Therefore, the medium-term bias still leans neutral to bearish.
Momentum is softer, not bullish
The daily RSI stands at 41.25. That is not oversold, but it remains below the 50 line that often separates stronger momentum from weaker momentum. In other words, downside pressure has moderated, yet buyers have not regained real control.
Meanwhile, daily MACD is not giving a clean bullish signal. The MACD line is 3.29 versus a signal line at 10.33, leaving a negative histogram of -7.04. The pace of weakness may be slowing. Still, the indicator suggests upside traction remains limited for now.
Volatility context near the lower half of the range
Daily Bollinger Bands frame the current location well. The middle band sits at 648.93, while the lower band is 586.60 and the upper band is 711.25. Meta stock is trading much closer to the lower half of that range than the center.
That usually reflects a stock still under distribution pressure, although it is not yet testing an extreme volatility washout. At the same time, daily ATR at 18.42 points to meaningful but not disorderly movement. Volatility is elevated enough to matter, especially around nearby support and resistance.
Hourly chart keeps the short-term Meta stock tone weak
Trend structure is still bearish
On the hourly chart, the bearish tone is even clearer. That weakens any attempt to build a near-term bullish case. Meta closed at 610.54, below the 20-hour EMA at 618.43 and far below the 50-hour and 200-hour EMAs at 636.40 and 638.83.
That tells us the short-term trend is still down. The intraday recovery has not changed that structure.
Momentum shows stabilization, not repair
However, the hourly momentum picture is not one-dimensional. RSI is at 34.11, which is weak and close to oversold territory. At the same time, hourly MACD is still negative, but the histogram has turned positive at 2.1.
That combination often appears when downside momentum is fading before price has actually repaired the trend. So, the hourly chart confirms weakness. However, it also hints that sellers may be losing urgency.
The hourly Bollinger setup reinforces that point. The middle band is 611.23, with price almost exactly there, while the lower band sits at 605.22 and the upper band at 617.24. Meta is no longer pressing the lower band aggressively. Instead, it is hovering around the middle of the intraday range.
That is more consistent with consolidation than with a fresh directional impulse. Meanwhile, hourly ATR at 5.23 suggests intraday swings remain active, though not unusually stretched.
15-minute chart shows only a tactical bounce attempt
On the 15-minute chart, execution conditions are more balanced than the larger trend. Price at 610.54 is slightly below the 20-period EMA at 611.32 and below the 50-period EMA at 613.71, so the very short-term structure still leans soft.
Yet RSI at 46.64 is close to neutral, and MACD has turned marginally positive. That reads as a small rebound attempt inside a broader weak tape, not a full trend change. The 15-minute pivot at 610.96, with resistance at 611.81 and support at 609.68, marks the immediate battleground for short-term traders.
Meta stock outlook: support hold versus further downside
Therefore, the cross-timeframe message is mixed but still tilts cautious. The daily chart sets a neutral-to-bearish base because Meta remains under all major EMAs and daily momentum is still below trend-strength levels. The hourly chart confirms that weak structure, even if momentum is trying to stabilize.
The 15-minute chart adds only tactical evidence of a bounce attempt. It does not overturn the broader setup.
From a bullish standpoint, Meta stock needs to hold above the 604 to 609 support band and then reclaim 615. A stronger signal would be a push back above the hourly upper Bollinger area near 617. More importantly, the stock would need to recover toward the daily 20-day EMA near 641.
That would show buyers are doing more than defending support. It would show they are starting to repair trend damage. Support from the recent news flow could help that effort, especially as attention remains on Meta revenue strength and the company’s AI ambitions.
In contrast, the bearish scenario remains straightforward. If Meta loses the 604 area, the market would likely start leaning toward a retest of the daily lower Bollinger region near 586.60. That would fit the current daily structure, where price is still trading below all major averages and MACD remains negatively aligned.
The rising debate around Meta’s higher AI budget and capex plans also matters here. Strong revenue growth supports sentiment. However, persistent concern over spending can keep rallies capped if the technical picture is already fragile.
Overall, Meta stock is not in a clean breakdown, but it has not earned a bullish reset either. The stock is trying to base near support while momentum on shorter timeframes improves modestly. Still, the daily chart remains the deciding factor, and it continues to argue for caution.
As long as price stays below the major daily moving averages, volatility is likely to favor choppy trading and headline-driven swings rather than a durable advance.
