




Facebook Meta stock still has a constructive daily backdrop, but the short-term tone has softened after earnings. The daily chart remains biased upward, while intraday action reflects caution around higher AI spending and execution risk, leaving META in a bullish-to-neutral setup rather than a clean continuation trend.
Summary
Facebook Meta Stock Daily Trend Still Holds
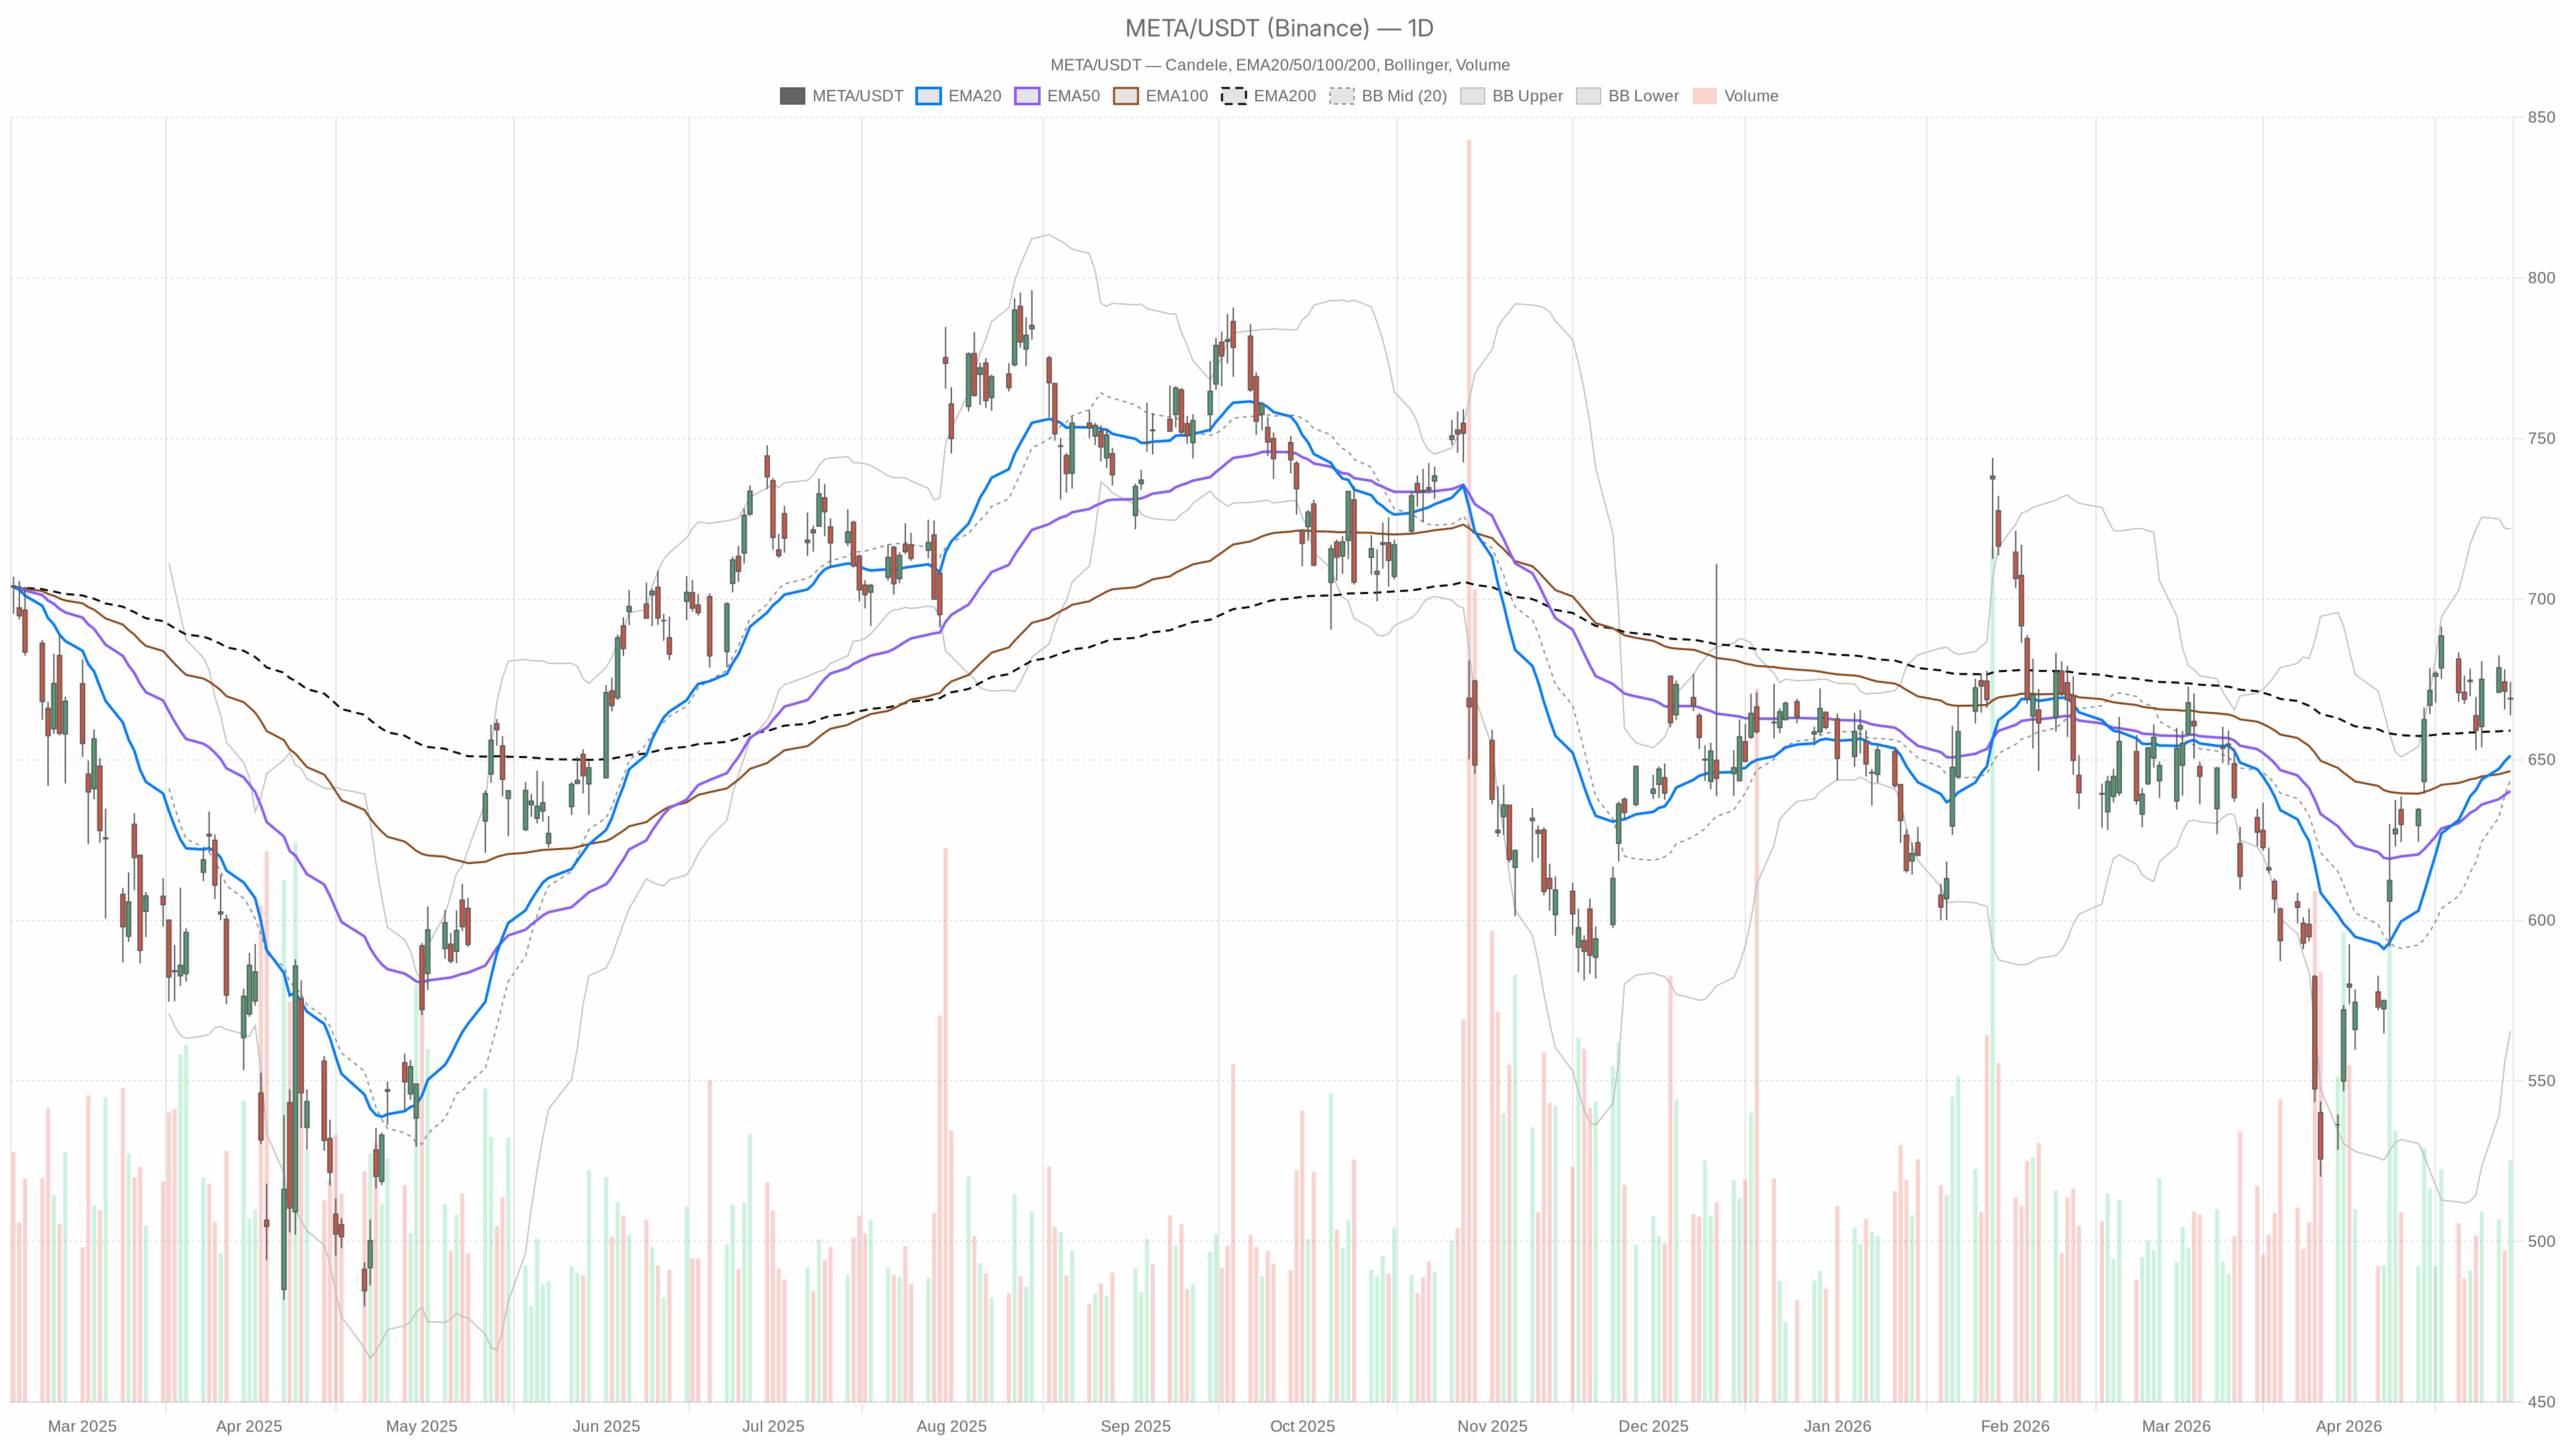
On the daily timeframe, Meta closed at 669.12, almost exactly on the daily pivot at 669.06. That places the stock in a decision area rather than in an aggressive directional move.
Price remains above the 20-day EMA at 651.33 and the 50-day EMA at 640.22. It is also marginally above the 200-day EMA at 659.08. In practical terms, the broader trend structure is still intact, and buyers have not lost control of the higher-timeframe trend.
Daily momentum is constructive, but not extreme. The daily RSI stands at 58.6, pointing to positive momentum without signaling an overheated market.
The daily MACD is also supportive. The MACD line at 16.55 remains above the signal line at 13.96, with a positive histogram of 2.59. Therefore, the medium-term thrust stays positive, even if upside momentum is no longer accelerating sharply.
Volatility and range context
Meanwhile, the daily Bollinger Bands show Facebook Meta stock trading in the upper half of its recent range, but still well below the upper band at 721.91. The mid-band sits at 643.71.
That matters because META is elevated versus its recent average, yet not stretched enough to imply exhaustion on its own. Daily ATR is 15.81, which signals meaningful volatility and suggests post-earnings swings can remain wide.
Hourly Facebook Meta Stock Signals Show Post-Earnings Pressure
However, the hourly chart weakens that constructive daily view. META closed at 669.94 on the 1H timeframe, below the 20-hour EMA at 671.77 and effectively flat to the 50-hour EMA at 669.95. Still, it remains comfortably above the 200-hour EMA at 643.82.
That combination usually reflects short-term consolidation or digestion rather than fresh upside expansion. In other words, the stock is pausing, not extending.
The 1H momentum picture is softer as well. RSI is 46.45, which puts momentum slightly on the defensive side of neutral.
MACD is negative, with the line at -0.4 below the signal line at -0.15 and a histogram of -0.25. As a result, the intraday impulse turned lower after earnings, even though the larger trend has not broken down.
Support, resistance, and short-term control
Notably, the hourly Bollinger structure reinforces that softer view. The 1H mid-band is 672.93, above the last close, while the lower band is 665.65. That leaves price in the lower half of the short-term range.
The hourly ATR of 4.8 also points to elevated intraday movement. That is consistent with headline-driven repricing rather than calm trend trading.
Hourly pivot levels add useful context. The pivot is 670.44, resistance is 673.04, and support is 667.35. Since price finished just under the pivot, short-term control remains fragile.
15-Minute META Chart Reflects Heavy Microstructure
On the 15-minute chart, the stock is best viewed as execution context rather than trend guidance. META closed at 669.94, with price below the 20-period EMA at 671.14, the 50-period EMA at 671.36, and the 200-period EMA at 671.72.
That overhead cluster shows active near-term supply. At the same time, the 15-minute MACD turned slightly positive, with the line at 0.26 above the signal line at 0.13.
RSI at 46.53 remains muted. Therefore, there may be attempts at a short-term bounce, but they are unfolding inside a still-heavy microstructure.
Facebook Meta Stock Faces a Clear Timeframe Conflict
The conflict across timeframes is clear. The daily chart argues that Facebook Meta stock remains in a broader uptrend, supported by price holding above major moving averages and positive medium-term momentum.
In contrast, the 1H and 15-minute charts show that earnings-related selling pressure has interrupted that trend and forced the stock into near-term repair mode. That does not automatically reverse the daily uptrend. However, it does make immediate continuation less convincing.
Earnings Reaction Explains the META Hesitation
News flow explains that hesitation. Meta delivered a Q1 earnings beat and stronger revenue, yet the market focused on higher AI capex and management’s own risk warnings.
Bloomberg and Yahoo coverage point to the same issue. Investors are questioning whether the scale of spending will generate sufficient returns. Therefore, the chart weakness is not random noise. It reflects a market reassessment of valuation support after a fundamentally strong quarter was overshadowed by heavier investment demands.
Bullish Scenario for Facebook Meta Stock
The bullish scenario still has a credible foundation. For that case to strengthen, META would need to hold above the nearby support zone around 667.35 to 663.87, which comes from hourly and daily pivot supports.
Then it would need to reclaim the 673.04 to 674.31 resistance band. A move back above that area would show that post-earnings selling has been absorbed. If that happens, the daily trend structure would reassert itself, with scope for a push toward the upper daily Bollinger region over time.
Bearish Scenario if Support Gives Way
On the other hand, the bearish scenario becomes more relevant if the stock fails to hold the 663.87 daily support area and remains capped below the low-670s. That would keep price below short-term moving averages and validate the weak hourly momentum profile.
In that case, the bullish daily structure would start to lose credibility, especially if sellers force the stock back toward its daily 200-day EMA near 659.08. A break below that longer-term trend marker would materially weaken the higher-timeframe case.
Facebook Meta Stock Outlook
Overall, Facebook Meta stock is not in technical breakdown, but it is under short-term pressure after earnings despite solid reported numbers. The daily chart still leans constructive, while the hourly and 15-minute signals show hesitation, supply overhead, and event-driven volatility.
Overall, positioning looks sensitive to whether buyers can quickly retake the low-670s. Until that happens, META is trading with a bullish longer-term bias, but a cautious short-term tone.
