




Google Alphabet stock remains bullish on the daily chart, with the broader structure still favoring upside continuation after a strong earnings-driven move. However, shorter timeframes show post-earnings digestion, so the stock may need to consolidate before attempting another leg higher.
Summary
Google Alphabet Stock Holds a Bullish Daily Trend
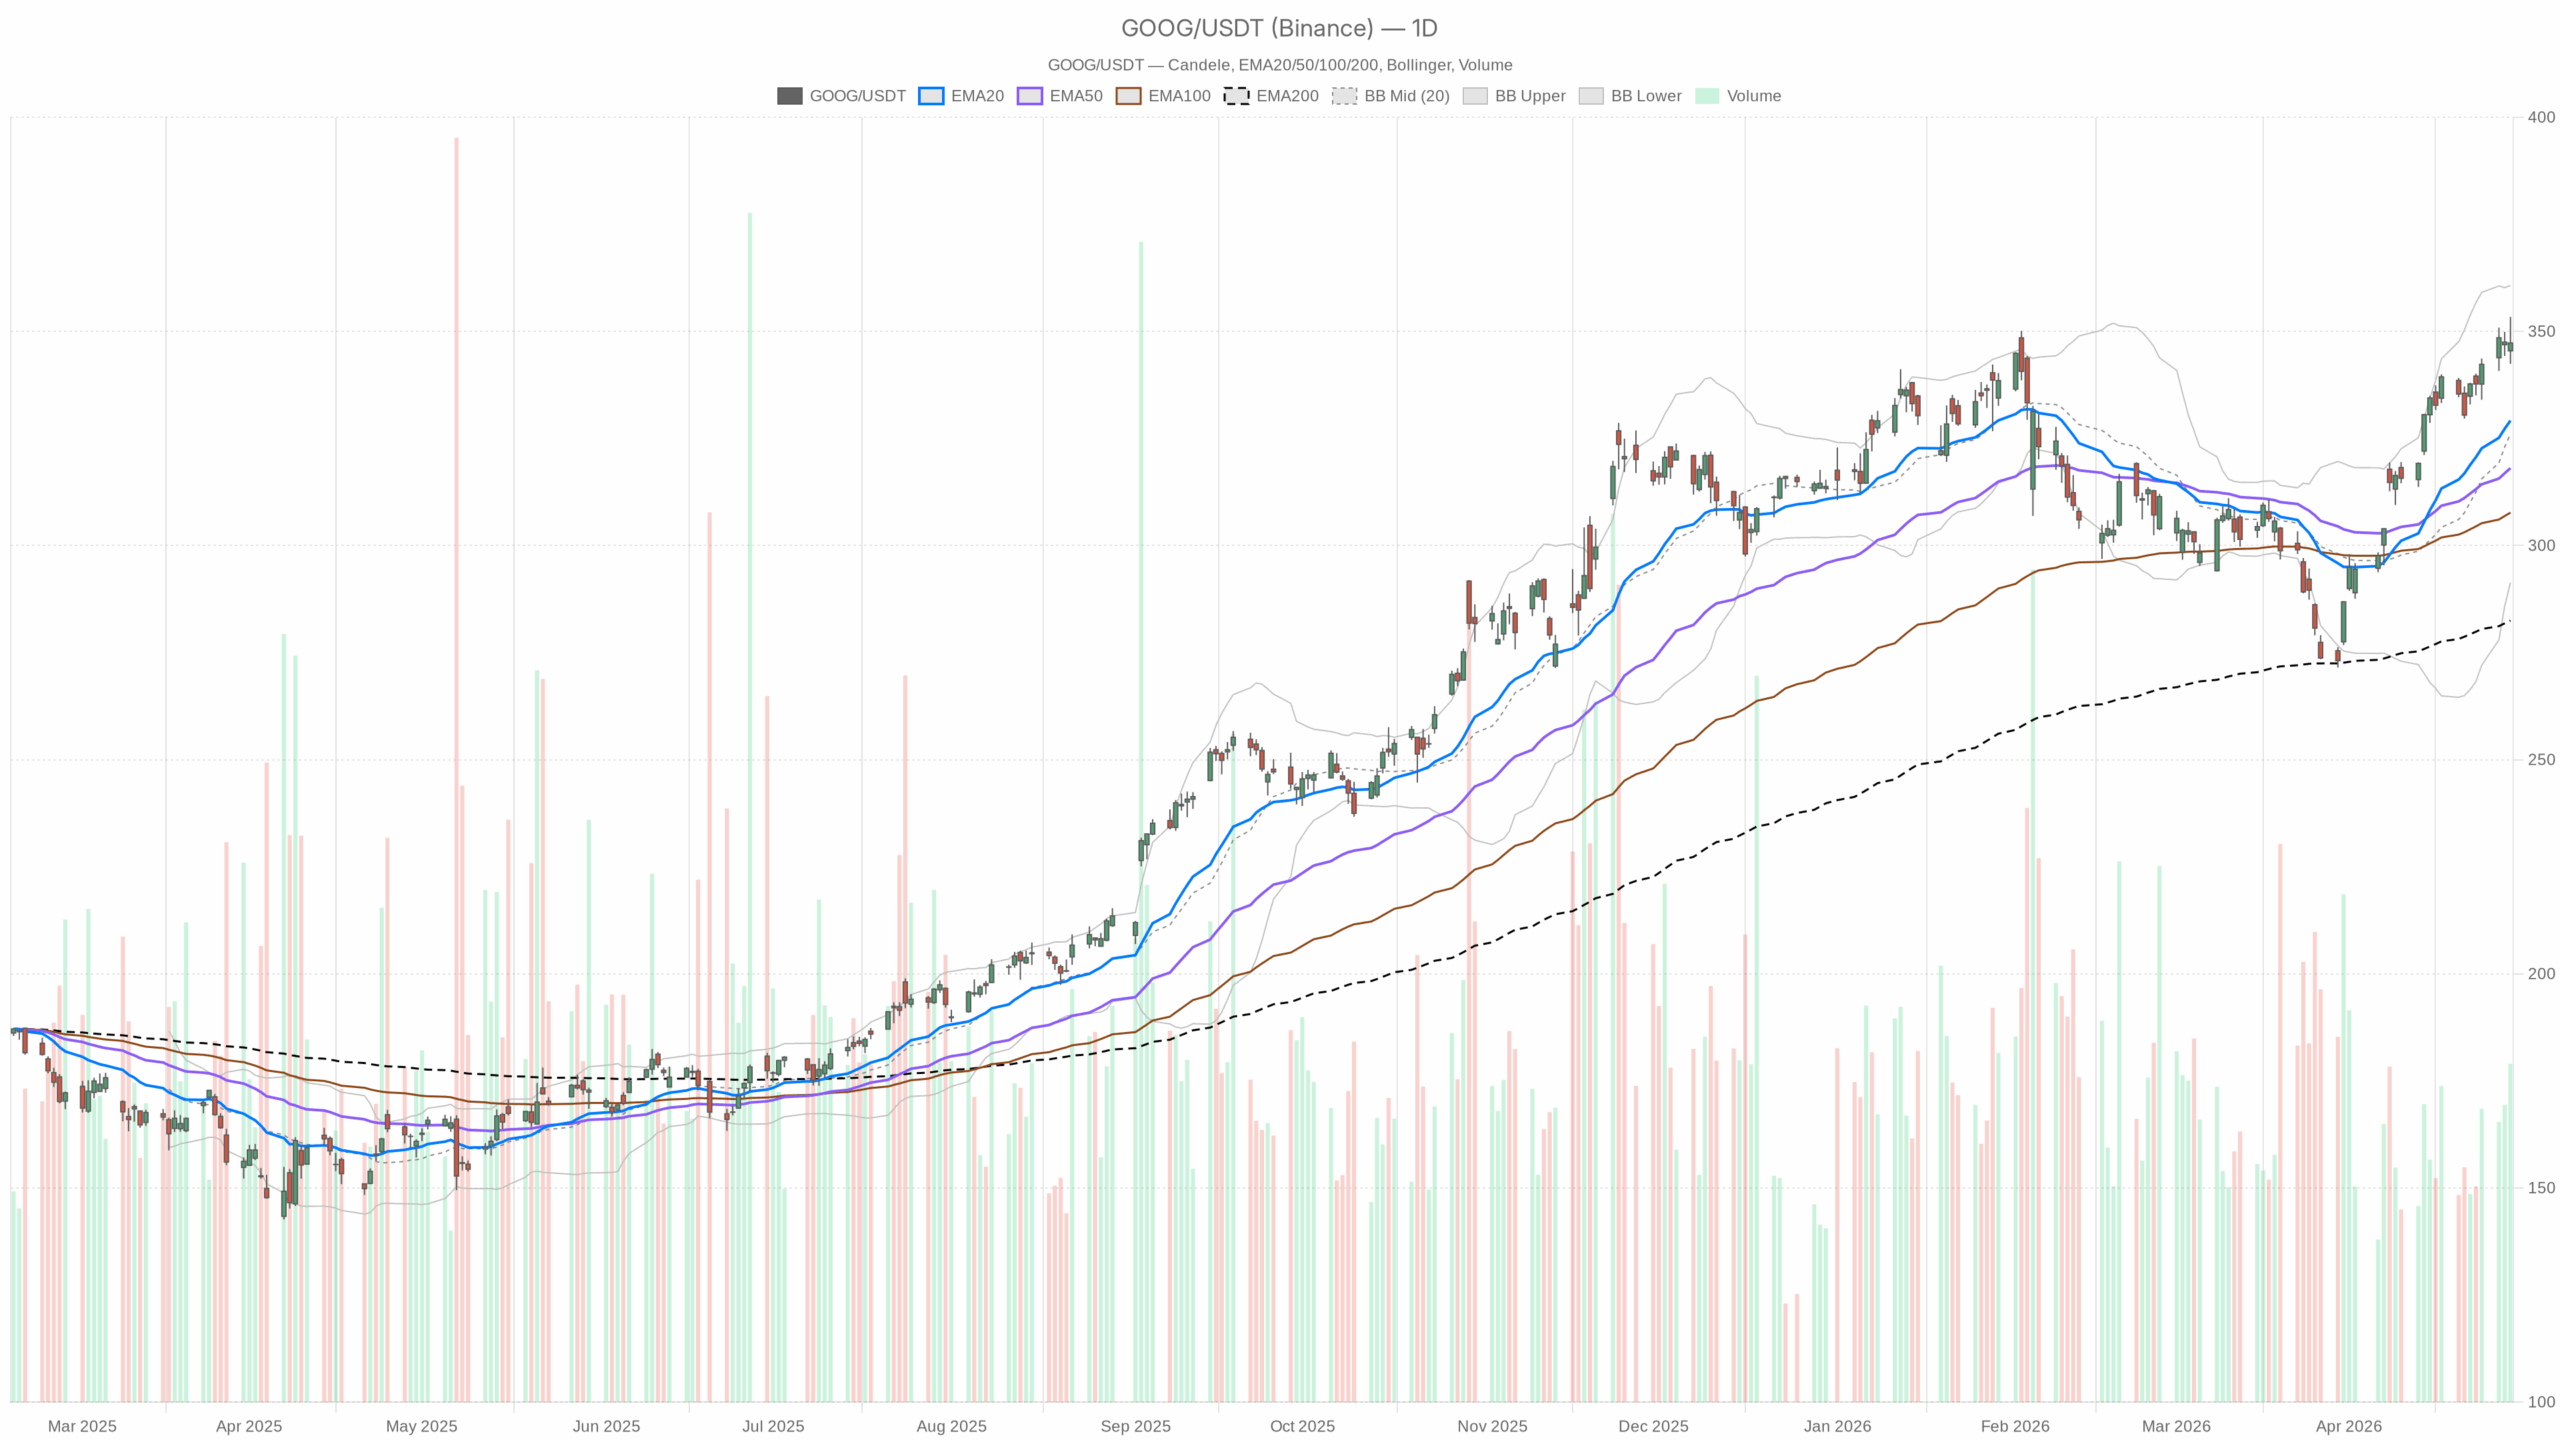
On the daily timeframe, Alphabet closed at 347.31 on April 29 after trading between 342.43 and 353.39. That leaves the stock almost exactly at the daily pivot point of 347.71, with resistance at 352.99 and support at 342.03.
In practical terms, the market is sitting near a short-term decision area. A push back through 352.99 would reinforce upside control. However, a break under 342.03 would suggest post-earnings momentum is losing traction.
Notably, the daily moving average structure remains very strong. Price is above the 20-day EMA at 329.2, the 50-day EMA at 318.09, and the 200-day EMA at 282.5. That alignment confirms a mature uptrend rather than a fragile rebound.
It also shows buyers still control the larger trend. For now, pullbacks are happening above rising support.
Momentum and volatility context
Daily RSI stands at 71.1. That is elevated and shows strong momentum, but it also indicates the stock is nearing an overheated zone after the recent advance. In other words, bullish conditions remain intact, though the pace of gains may become harder to sustain without some consolidation.
Meanwhile, daily MACD is still supportive. The line at 11.45 remains above the signal line at 9.3, and the histogram is positive at 2.15. Therefore, momentum is still expanding on the higher timeframe, which matters because the rally has not yet rolled over on the dominant chart.
The daily Bollinger Bands frame the setup well. Price is above the middle band at 326.06 and not far from the upper band at 360.75, while the lower band sits at 291.37. That confirms trend strength. At the same time, it shows a market trading near the upper end of its recent volatility envelope.
Daily ATR is 7.34, which points to a relatively wide average daily range. As a result, volatility should not be underestimated, especially after a strong earnings reaction. Even normal pullbacks can look sharp without necessarily damaging the daily bullish trend.
Fundamental Support for Google Alphabet Stock
The news backdrop clearly supports the higher-timeframe strength. Reports highlighted strong quarterly results, an 81% profit jump, solid cloud growth, and evidence that Alphabet is seeing tangible returns from AI investment.
Therefore, the technical uptrend is not standing alone. It is being reinforced by fresh fundamental momentum, which makes the bullish case more credible.
Short-Term Google Alphabet Stock Action Shows Consolidation
However, the 1-hour chart introduces some near-term hesitation. Alphabet closed at 347.68 on the hourly timeframe, almost exactly at its hourly pivot of 347.87. Resistance is nearby at 348.93, while support sits at 346.62.
That narrow range shows the stock is no longer in impulsive expansion mode intraday. Instead, it is hovering around equilibrium after the initial burst.
Hourly trend remains constructive, but momentum has cooled
Hourly EMAs still favor the upside. Price is above the 20-hour EMA at 347.11, above the 50-hour EMA at 342.51, and comfortably above the 200-hour EMA at 323.39. That keeps the intraday trend constructive.
Even so, the margin above the 20-hour EMA is modest. This suggests momentum is no longer as aggressive as it was during the breakout phase.
In contrast, hourly momentum readings are softer than the daily ones. Hourly RSI is 54.94, which is neutral to positive rather than strong. It implies the stock is holding up, but buyers are not pressing with the same urgency.
Hourly MACD is weaker as well. The line at 1.63 is below the signal line at 2.14, and the histogram is negative at -0.51. This shows short-term momentum has cooled and partially weakens the immediate continuation case.
The hourly Bollinger setup tells a similar story. The middle band is 348.5, the upper band is 351.09, and the lower band is 345.91. Price is sitting slightly below the middle band and inside a relatively tight range. Overall, that points to consolidation rather than trend acceleration.
Hourly ATR at 2.94 also reflects active but more controlled intraday volatility compared with the daily backdrop.
15-Minute Structure Highlights Tactical Neutrality
On the 15-minute chart, the picture is even more tactical. Price closed at 347.68, almost exactly at the 15-minute pivot of 347.7. Resistance stands at 348.59, while support sits at 346.79.
The 15-minute regime is neutral. That matters mainly for timing, because the stock is balancing after the move rather than offering a clean directional trigger right now.
The short-term averages are tightly clustered. Price is near the 20-period EMA at 348.04 and the 50-period EMA at 347.77, while still above the 200-period EMA at 342.71. That mix reflects a pause inside a broader uptrend.
Meanwhile, RSI at 47.47 is neutral and MACD is only marginally positive, so there is no strong short-term momentum edge yet. The 15-minute Bollinger Bands, from 345.79 to 350.03, reinforce that near-term compression. ATR at 1.08 indicates relatively limited movement for immediate execution.
Google Alphabet Stock Outlook and Key Levels
Overall, the timeframes are not fully aligned, but they are not in outright contradiction either. The daily chart is clearly bullish. The 1-hour chart still supports that broader bias through trend structure. Still, it warns that upside momentum has cooled after the earnings surge.
The 15-minute chart adds a final layer of caution by showing a neutral, range-bound short-term environment. So the conflict is not between bullish and bearish structure. It is between a strong higher-timeframe trend and near-term digestion.
The bullish scenario remains the primary one. For that case to strengthen, Google Alphabet stock would need to hold above the 342.03 daily support zone and reclaim 352.99 on the daily pivot structure. A sustained move toward the upper daily Bollinger area near 360.75 would then become more plausible.
That would be consistent with strong earnings follow-through, positive daily MACD, and the fact that price remains well above all major daily EMAs.
On the other hand, the bearish scenario is mainly a failure-of-follow-through story rather than an established downtrend. If the stock loses 342.03 on the daily level and starts closing back below the hourly support area near 346.62, with weakening intraday momentum, the market could slip into a deeper pullback.
In that case, traders would start watching whether price drifts back toward the daily 20-day EMA at 329.2. Such a move would not automatically break the long-term uptrend. However, it would clearly invalidate the idea of immediate upside continuation.
In closing, Google Alphabet stock still deserves a bullish main bias because the daily trend is strong and the earnings backdrop is supportive. Nevertheless, the shorter charts argue for patience rather than urgency. Volatility remains elevated, and the stock is close enough to resistance to make short-term swings more erratic. The key issue now is whether consolidation turns into renewed upside expansion, or whether the post-earnings rally needs a deeper reset first.
