
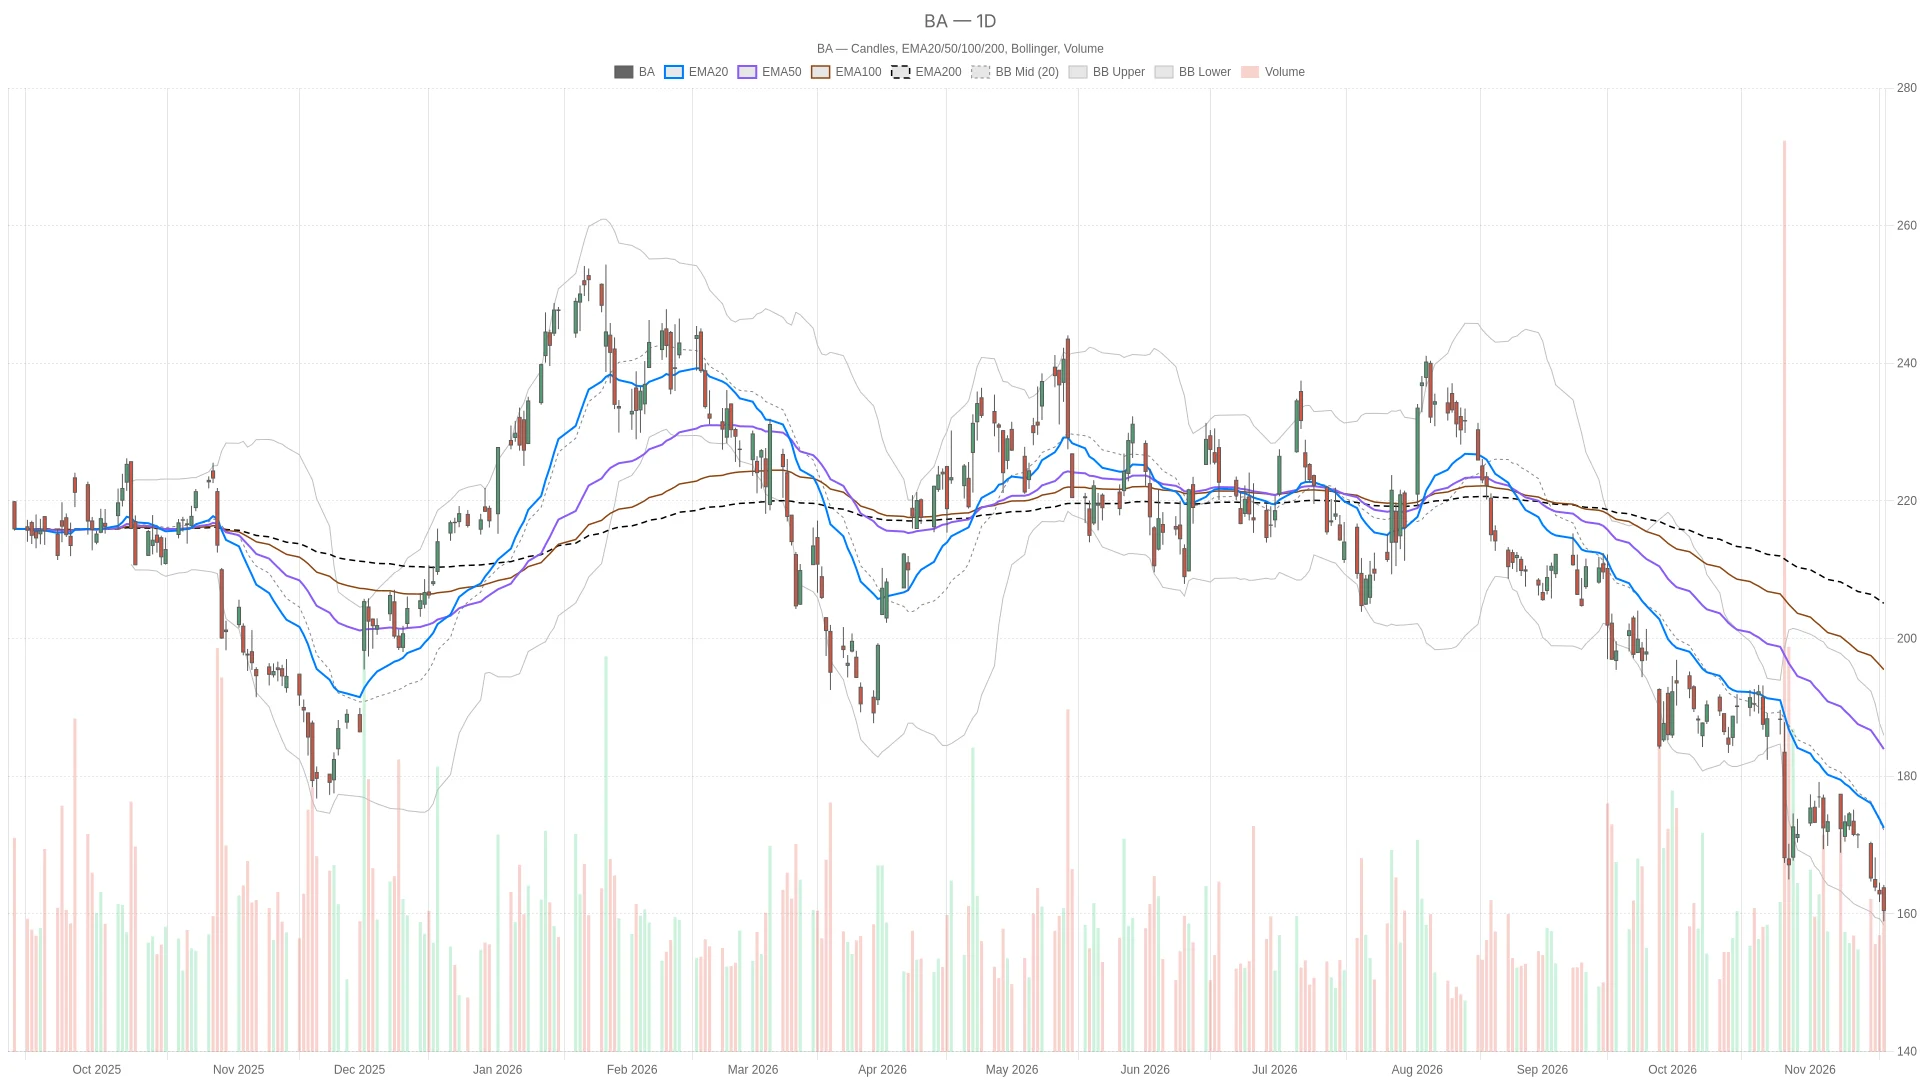
Boeing stock retains a bearish daily bias, with price below all three major exponential moving averages and near the lower Bollinger band. Oversold readings complicate the outlook, but they do not establish a bullish case. The hourly chart largely confirms the daily weakness.
Summary
Key takeaways
- Boeing stock closed Thursday at $160.51, down 1.47%, with price below the 20-session EMA at $172.51, the 50-session EMA at $183.94, and the 200-session EMA at $204.35.
- Daily RSI14 fell to 28.03 from 29.99, placing it in oversold territory; the daily MACD histogram declined to -0.58 from -0.39, with the MACD line at -6.37 below its signal at -5.79.
- The session close sits above the daily lower Bollinger band at $158.42 and below the mid-band at $172.18, with daily ATR14 at $5.16.
- Hourly RSI14 rose to 27.31 from 25.3 but remains oversold; hourly MACD line and signal both stand at -1.9 with a histogram of 0.
- For the next session, the daily pivot is $161.22, with first resistance at $163.51 and first support at $158.21.
On Thursday, November 19, 2026, Boeing opened at $163.80, traded between a low of $158.92 and a high of $164.22, and closed at $160.51, against a previous close of $162.91. The stock was down 1.47% versus the previous close.
Boeing stock faces a bearish daily structure
The daily averages are bearishly aligned. Price sits below the 20-session EMA at $172.51, the 50-session EMA at $183.94, and the 200-session EMA at $204.35. This alignment supports the bearish thesis rather than treating an oversold reading as sufficient evidence of strength.
Meanwhile, daily RSI14 fell to 28.03 from 29.99, placing it in oversold territory. The daily MACD histogram declined to -0.58 from -0.39. The MACD line at -6.37 remains below its signal at -5.79, leaving the daily momentum evidence bearish.
The $160.51 close sits above the daily lower Bollinger band at $158.42 and below the mid-band at $172.18. That places price near the lower boundary, rather than near the center of the band structure. Daily ATR14 reads $5.16, providing the volatility context for the nearby support levels.
Hourly confirmation, with mixed short-term momentum
However, the hourly chart contains a qualification to the bearish view. Hourly RSI14 rose to 27.31 from 25.3, although it remains oversold. The hourly MACD line and signal both stand at -1.9, with a histogram of 0. That is neutral between the two MACD components, not a bullish crossover.
At the same time, the hourly averages remain bearishly aligned above the session close. The 20-hour EMA is $163.04, the 50-hour EMA is $166.43, and the 200-hour EMA is $176.35. Price also sits below the hourly Bollinger mid-band at $162.88 but above the lower band at $159.97. The hourly price structure therefore confirms the daily bias despite the higher RSI reading.
For execution context, the 15-minute chart is mixed. The session close sits below its 20-period EMA at $161.13 and Bollinger mid-band at $160.98. RSI14 stands at 40.25, below 50. In contrast, its MACD line at -0.54 is above the signal at -0.55, producing a positive histogram of 0.01. That short-term positive reading does not outweigh the daily and hourly structure.
Deal coverage provides context, not a confirmed price explanation
Separately, Seeking Alpha reported before Thursday’s open that Boeing and GE Aerospace finalized a $12 billion Philippine Airlines deal for up to 20 787s. The report provides commercial context.
Reports published on Wednesday, November 18, described Boeing director Akhil Johri buying company stock. They also covered Boeing expanding digital parts tracking to help block unapproved components. Neither item changes the chart’s current position against its averages.
Bullish and bearish levels for the next session
When trading resumes, the daily pivot for the next session sits at $161.22. First resistance is at $163.51 and first support at $158.21. These are next-session reference levels calculated from the completed daily candle.
A bullish scenario requires Boeing stock to reclaim the daily pivot at $161.22. Clearing the hourly 20-hour EMA at $163.04 would provide additional support before the next-session daily first resistance at $163.51. Even then, the daily 20-session EMA at $172.51 would remain an overhead hurdle.
Conversely, a break below the session low at $158.92 would undermine that bullish scenario. The next lower references are the daily lower Bollinger band at $158.42 and the next-session daily first support at $158.21. A positive 15-minute MACD histogram alone would not invalidate those bearish conditions.
Overall, Boeing stands below the next-session daily pivot and above the session low and daily lower Bollinger band. Daily ATR14 of $5.16 keeps volatility relevant to those nearby levels. The unresolved question is whether oversold conditions can coexist with a reclaim of resistance. The broader chart remains bearish until price provides that evidence.
FAQ
What is the current technical structure for Boeing stock?
Boeing stock is in a bearish daily structure. Price closed at $160.51, below the 20-session EMA at $172.51, the 50-session EMA at $183.94, and the 200-session EMA at $204.35. The daily MACD line at -6.37 remains below its signal at -5.79.
Is Boeing stock oversold?
The daily RSI14 fell to 28.03 from 29.99, placing it in oversold territory below the 30 threshold. The hourly RSI14 also reads 27.31, below 30, though it rose from 25.3.
What are the key levels to watch for Boeing stock?
For the next session, the daily pivot sits at $161.22, with first resistance at $163.51 and first support at $158.21. The daily lower Bollinger band is at $158.42, while the session low is $158.92. The 20-hour EMA at $163.04 also serves as a nearby reference.
What would shift the bearish outlook for Boeing stock?
A bullish scenario requires Boeing stock to reclaim the daily pivot at $161.22 and clear the hourly 20-hour EMA at $163.04. Even then, the daily 20-session EMA at $172.51 would remain an overhead hurdle. A break below the session low at $158.92 would reinforce the bearish structure.
Disclaimer: This article is for informational purposes only and does not constitute financial advice, an investment recommendation, or a solicitation to buy or sell any financial instrument. The analysis provided is not indicative of future results. Investing in financial markets carries a high risk of capital loss. Always do your own research (DYOR) and consult a qualified financial advisor before making any decision.
Cryptonomist and the author hold no positions in the financial instruments mentioned and receive no compensation from the companies covered.
Read also: Archer Aviation Stock Surges 21% on Boeing Deal, but 200-Day Line Holds Firm
Article produced with the assistance of artificial intelligence and reviewed by the editorial team.