




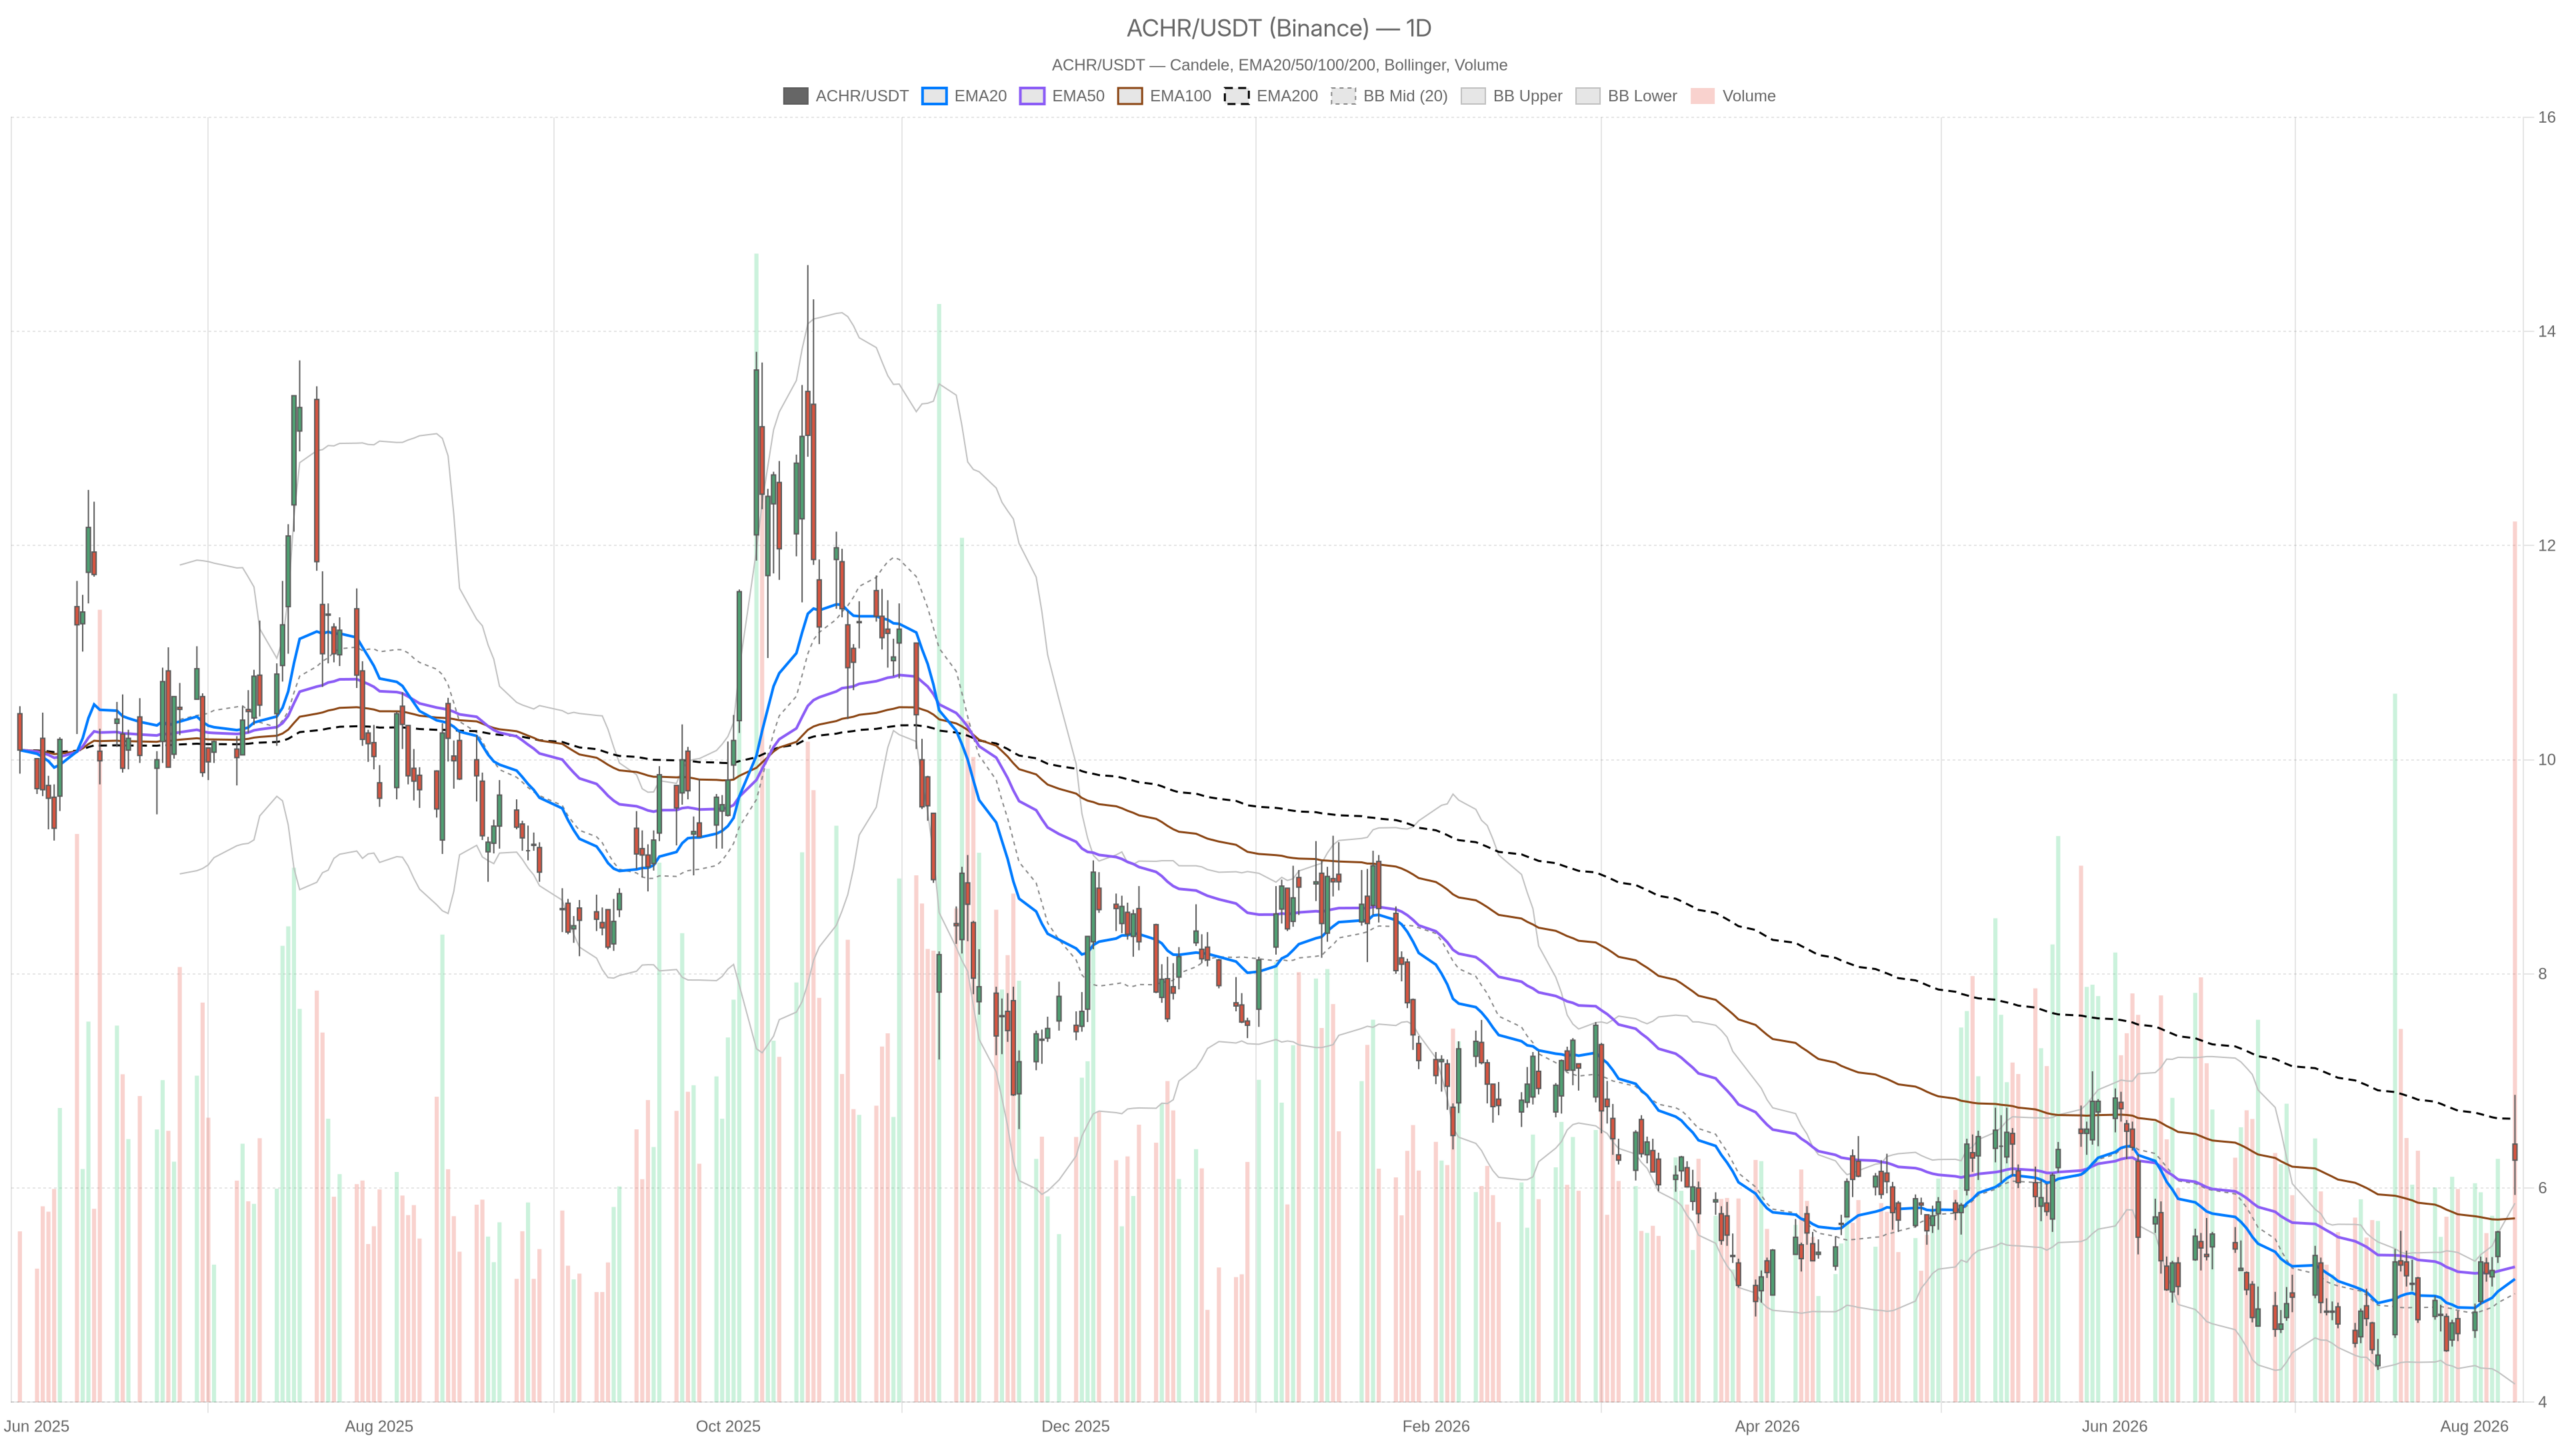
Archer Aviation Stock surged on news of acquiring three Boeing subsidiaries. ACHR closed at 6.26 on 10 August after intraday gains of up to 21%. Volume exploded to 123.4 million shares — a genuine repricing event that reshapes the technical map entirely.
Summary
Key takeaways
- ACHR closed at 6.26 on 10 August after surging as much as 21% intraday on news of acquiring three Boeing subsidiaries.
- Volume reached 123.4 million shares, signalling a genuine repricing event rather than speculative drift.
- The 200-day EMA at 6.65 remains the critical level — price has not yet closed above it.
- Daily RSI at 67.45 and a fresh MACD crossover support the bullish case, but the close below the daily open warns of rejection risk.
- Until 6.65 is reclaimed and defended, the rally remains a powerful counter-trend move rather than a confirmed reversal.
Archer Aviation Stock Daily Structure: A Bullish Thrust Inside a Neutral Regime
The daily chart shows a powerful bullish thrust, but the regime remains neutral because the 200-day EMA at 6.65 still caps the price. A single gap-driven candle has lifted ACHR far above its short-term averages. However, it has not reclaimed the long-term trend line. Until the 200-day EMA at 6.65 is closed above and defended, this remains a counter-trend rally rather than a confirmed reversal.
Momentum, meanwhile, is clearly on the buyers’ side. Daily RSI at 67.45 sits just under the overbought threshold, reflecting strength rather than exhaustion. The daily MACD line has crossed to 0.12 against a signal at -0.03. The histogram reads +0.15. That is a fresh momentum turn, not a mature one. Fresh crosses off a low base tend to carry follow-through risk in both directions.
Volatility is the bigger warning. Daily ATR sits at 0.39, yet Monday’s range spanned 5.93 to 6.87 — roughly 0.94 points, well over twice normal. The close at 6.26 sits far above the upper Bollinger Band at 5.86. The mid band is down at 5.01. Prices that finish this far outside the band rarely stay there. Either the bands expand rapidly to catch up, or price mean-reverts toward the breakout zone.
1H Chart Confirms the Trend, but the Edge Is Thinning
The hourly chart confirms a bullish trend with properly stacked moving averages, but momentum indicators show the acceleration is fading. The regime reads bullish, and the moving averages are aligned: EMA20 at 5.78, EMA50 at 5.42, EMA200 at 5.10. Price at 6.25 sits above all three. That alignment tells us the buying has been persistent, not a single spike that immediately faded.
Hourly RSI at 67.13 mirrors the daily reading, so momentum is consistent across timeframes. Yet the hourly MACD is starting to lose its thrust. The line at 0.28 remains above the signal at 0.24, but the histogram has compressed to just 0.04. The trend is intact; the acceleration is fading.
Notably, the hourly Bollinger structure leaves some room. The upper band sits at 6.56 with the mid band at 5.69. The hourly chart has not yet reached the same stretched condition visible on the daily. Hourly ATR of 0.24 also frames realistic near-term swings. The hourly pivots are extremely tight — pivot 6.25, R1 6.32, S1 6.19. This is typical after a vertical move: the market stops moving while it digests.
15m Execution Context: Coiled and Undecided
The 15-minute chart reveals a coiled market that is undecided on direction, with momentum stalling inside an extremely tight pivot band. Price at 6.25 holds above EMA20 at 6.14, EMA50 at 5.94 and EMA200 at 5.39. The micro-trend is still up. However, RSI has cooled to 59.97 and the MACD histogram has slipped to -0.01. The MACD line at 0.06 sits just under the signal at 0.07. That is a stall, not a reversal.
ATR on this timeframe is only 0.09. The Bollinger mid sits at 6.17, with bands at 5.89 and 6.45. Compression this tight after a 20% move usually resolves with a directional expansion. Therefore the 6.19–6.32 pivot band deserves attention as the immediate decision zone for short-term timing.
Bullish Scenario
Bulls must reclaim 6.35 and close above the 200-day EMA at 6.65 to confirm a structural trend reversal. The bullish path is straightforward. First, reclaim the daily pivot at 6.35. Then attack the 200-day EMA at 6.65. A daily close above 6.65 would flip the long-term structure. It would also put the 6.77 R1 pivot and the 6.87 session high back in play.
Several confirmations would support this outcome. The hourly MACD histogram must re-expand. RSI should hold above 60 on both the 1H and 15m charts. Follow-through volume needs to confirm institutional participation in the Boeing transaction — not just a one-day event. Consolidation above 6.19 while the daily Bollinger bands widen upward would be the healthiest version of this outcome.
Bearish Scenario
The bearish case centres on the failed push above 6.65 and the close below the open. This signals rejection at the most important level on the chart. The failed poke above 6.65 followed by a close below the open forms a rejection candle. A loss of the 15-minute band low at 5.89 would be the first warning. A break of the daily S1 at 5.84 would confirm the gap is being sold rather than accumulated. From there, the daily upper Bollinger Band at 5.86 becomes a ceiling instead of a launchpad.
The mean-reversion risk points back toward the 5.26 and 5.15 EMA cluster — where the pre-news trend actually lived. The invalidation trigger for bulls is clear: any daily close under 5.84 would tell us the repricing was not accepted.
Overall, the signals are mixed by design. The daily regime is neutral and stretched. The hourly is bullish but decelerating. The 15-minute chart is coiled with a marginal negative momentum tick. Positioning into that combination demands respect for volatility. With daily ATR at 0.39 and a realised range more than double that, normal position sizing assumptions no longer apply. The Boeing acquisition gives ACHR a genuine narrative catalyst. Yet the chart has not confirmed it. Until 6.65 is settled one way or the other, this is a market of headline risk and wide swings, not a clean trend.
FAQ
What caused Archer Aviation Stock to surge on 10 August?
ACHR surged after announcing agreements to acquire three Boeing subsidiaries — Wisk Aero, SkyGrid and Insitu — with intraday gains reaching up to 21% on volume of 123.4 million shares.
Is Archer Aviation Stock now in a confirmed uptrend?
Not yet. The daily regime remains neutral. The 200-day EMA at 6.65 has not been closed above and defended. Until that happens, the rally is a powerful counter-trend move rather than a confirmed reversal.
What is the critical level to watch for Archer Aviation Stock?
The 200-day EMA at 6.65 is the critical level. A daily close above it would flip the long-term structure to bullish. A failure to hold above 5.84 would invalidate the bullish case entirely.
What does the volume of 123.4 million shares indicate for ACHR?
Volume of this magnitude signals a genuine repricing event driven by institutional participation, not speculative drift. It confirms the Boeing acquisition news carries meaningful weight for the stock’s valuation.
Disclaimer: This article is for informational purposes only and does not constitute financial advice, an investment recommendation, or a solicitation to buy or sell any financial instrument or cryptocurrency. The analysis provided is not indicative of future results. Investing in crypto assets and financial markets carries a high risk of capital loss. Always do your own research (DYOR) and consult a qualified financial advisor before making any decision.
Article produced with the assistance of artificial intelligence and reviewed by the editorial team.
