



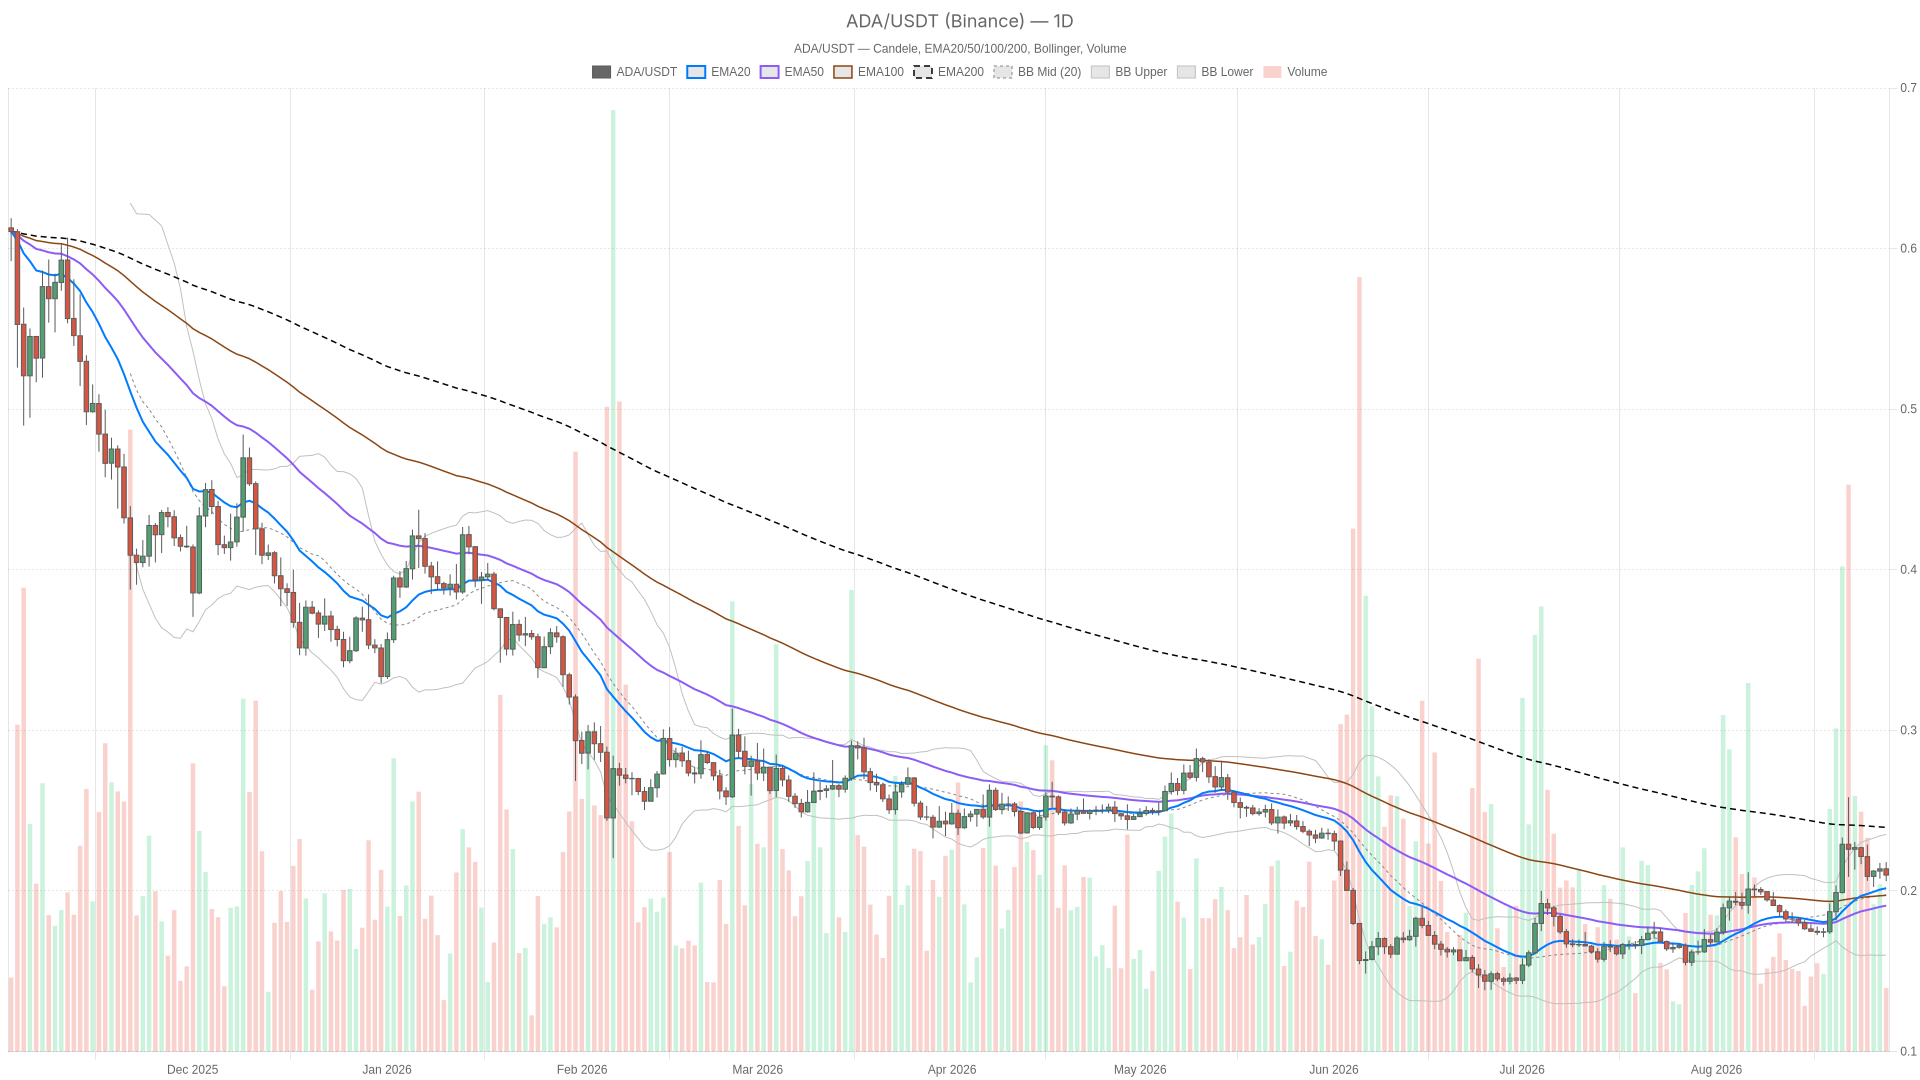
Trading around $0.21 on August 28, 2026, Cardano price today reflects a split between a quietly constructive daily chart and shorter timeframes that refuse to commit. ADA holds above its 20- and 50-day averages yet remains below the 200-day EMA at $0.24.
Summary
Key takeaways
- ADA trades at $0.21 on August 28, 2026, above the 20- and 50-day averages but below the 200-day EMA at $0.24.
- Total crypto market capitalization fell 2.36% in 24 hours, according to CoinGecko.
- The Fear & Greed Index reads 73, signaling Greed even as broader market conditions weaken.
- Cardano DEX activity is mixed: Splash Protocol grew across all periods while Minswap and SundaeSwap posted weekly and monthly declines.
- Daily RSI sits at 58.55, while the 1-hour RSI at 44.25 shows short-term hesitation.
What the Daily Chart Shows
The daily chart leans cautiously constructive, but it does not confirm a full trend reversal. Cardano price today sits at $0.21 on the daily timeframe, above both the 20-EMA at $0.20 and the 50-EMA at $0.19, yet still beneath the 200-EMA at $0.24. Short-term averages are turning up, while the longer-term average still overhangs price as resistance.
The daily RSI at 58.55 supports that reading. It sits comfortably above the midline without flashing overbought, which tells you buyers have some control but have not pushed things to an extreme. MACD, however, is basically flat: line and signal both sit at 0.01 with a histogram of zero. That is a market where momentum has stalled right at the edge of a bullish cross, waiting for a catalyst rather than confirming one.
Bollinger Bands frame the range: the mid-band sits at $0.20, the upper band at $0.24, and the lower band at $0.16. Price is hugging the midline, and notably the upper band lines up almost exactly with the 200-EMA resistance. That confluence at $0.24 is the level that matters most if bulls want to make a real statement.
ATR14 at $0.02 suggests volatility is moderate rather than explosive right now, so a slow grind toward that level is more likely than a sudden spike. Pivot data reinforces the balance: the daily pivot point sits at $0.21, right where price is trading, with R1 at $0.22 and S1 at $0.20. That tight band shows the market has not picked a side yet.
How the 1-Hour and 15-Minute Charts Behave
The shorter timeframes show hesitation rather than trend. On the 1-hour chart, the EMA20, EMA50 and EMA200 have all converged around $0.21, meaning there is no clear trend on this timeframe, just compression. Meanwhile, RSI at 44.25 sits slightly below neutral, a mild sign of hesitation that runs counter to the daily’s more optimistic tone.
MACD is flat here too, offering no confirmation either way. This is the tension worth flagging: the daily chart leans mildly bullish, but the 1-hour chart tells you buyers have not stepped in with any urgency yet.
The 15-minute chart, used purely for execution context, shows RSI at 52.84, almost dead center neutral, with EMAs and Bollinger Bands all bunched near $0.21. There is no directional edge here either. Taken together, the multi-timeframe read shows a daily structure trying to build a base while shorter frames wait for a trigger.
What Cardano’s DEX Activity Reveals
Cardano’s on-chain DEX activity paints a mixed picture beneath the price stabilization. Minswap DEX posted an 18.34% jump in daily fees, but that is set against a 39.51% drop over seven days and a 45.34% decline over the past month.
SundaeSwap V2 shows a similar pattern: up 16.45% on the day, down 61.61% over the week, and down 69.92% over 30 days. Similarly, WingRiders fees fell 15.97% daily and are down roughly 30-40% across the week and month.
The one clear standout is Splash Protocol, which is up 6.41% daily, 13.83% over seven days, and 23.78% over 30 days. It is the only major Cardano DEX showing consistent growth across every window measured. Taken together, this points to a broader deceleration in Cardano network usage even as price attempts to stabilize. That gap is currently visible in the DeFi fee data.
Bullish and Bearish Scenarios
The bullish case depends on holding the $0.20 to $0.21 zone, while the bearish case leans on short-term weakness and capital rotation. For bulls, ADA must hold the cluster formed by the daily EMA20 and the S1 pivot. If that holds and daily RSI stays above 50, the next logical target sits near $0.24. That level marks the confluence of the upper Bollinger Band and the 200-EMA.
A daily close above that level would meaningfully shift the longer-term structure in bulls’ favor. Conversely, a daily close back below the 50-EMA at $0.19, or a decisive loss of the $0.20 pivot support, would suggest the bounce has run out of steam.
The bearish case leans on the fact that 1-hour RSI is still under 50 with MACD offering no real conviction. Add the broader backdrop: a 2.36% drop in total market cap, both classic signs of alt-coin capital flight. If ADA fails to reclaim momentum on shorter timeframes, a retest of the lower Bollinger Band and the $0.16 to $0.19 support zone becomes the more likely path.
By contrast, a clean break and hold above the $0.22 R1 pivot, followed by a reclaim of the $0.24 200-EMA, would take the bearish scenario off the table.
Final Read on Positioning
ADA currently presents unresolved signals rather than a clean trend. The daily chart offers a cautiously constructive read, while the hourly and 15-minute frames show hesitation. The wider market context adds caution, with Greed at 73 paired with a falling total market cap.
ATR readings suggest volatility is moderate rather than dramatic at the moment, so sudden oversized moves are not the base case. Still, that can shift quickly given how tightly price is coiled around its pivot. Anyone tracking this setup should weigh the daily structure against the shorter-term stall rather than picking one and ignoring the other.
Markets that sit this close to key averages and pivot levels tend to resolve with a burst of volatility once one side gives way. The question is simply which side blinks first, and neither the technical nor the on-chain data currently gives a definitive answer.
FAQ
What is Cardano’s price today?
As of August 28, 2026, ADA trades at $0.21.
Why does the daily chart look constructive?
ADA closed above the 20-EMA at $0.20 and the 50-EMA at $0.19, while daily RSI at 58.55 sits above the midline.
Which level matters most for bulls?
The confluence of the upper Bollinger Band and the 200-EMA around $0.24 is the key resistance.
What would invalidate the bullish case?
A daily close below the 50-EMA at $0.19 or a decisive loss of the $0.20 pivot support.
Disclaimer: This article is for informational purposes only and does not constitute financial advice, an investment recommendation, or a solicitation to buy or sell any financial instrument or cryptocurrency. The analysis provided is not indicative of future results. Investing in crypto assets and financial markets carries a high risk of capital loss. Always do your own research (DYOR) and consult a qualified financial advisor before making any decision.
Article produced with the assistance of artificial intelligence and reviewed by the editorial team.
