




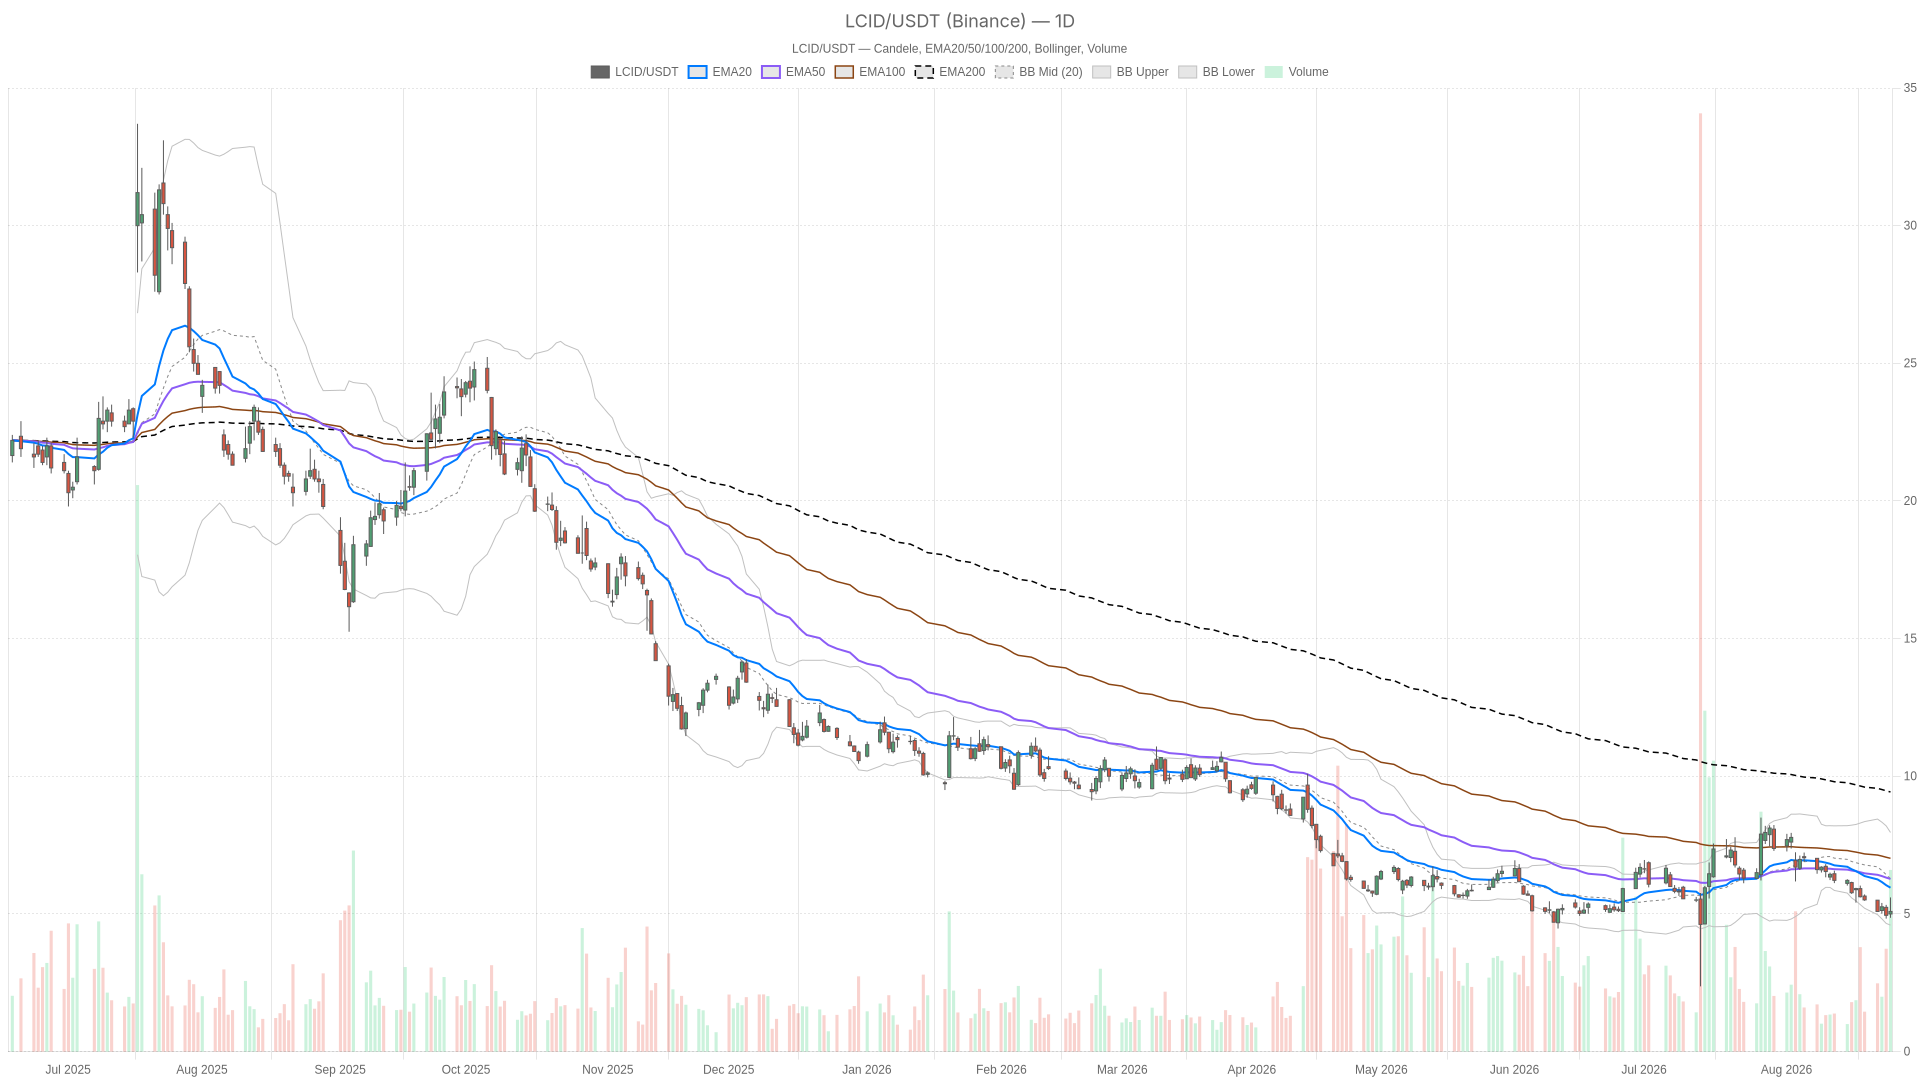
Lucid stock remains trapped in a structural downtrend. Shares closed at $5.09 on August 27, below every major moving average, confirming sellers still control the broader trend. The slide has coincided with skeptical headlines questioning whether Lucid can keep funding its turnaround while rivals scale production faster.
Summary
Key takeaways
- Lucid stock closed at $5.09 on August 27, below its 20-day, 50-day, and 200-day EMAs.
- The daily timeframe is bearish, with RSI at 36.65 and a widening negative MACD histogram at -0.18.
- Hourly momentum is pausing near the 5.05–5.15 zone even though the broader trend remains tilted lower.
- Key downside support sits at $4.77, while a bullish shift would require reclaiming the $5.18 daily pivot.
- News flow is split between a potential Q4 Gravity GT-S catalyst and concerns over ongoing cash burn.
Daily Trend: Bearish Bias Dominates LCID Stock Price Action
The daily chart confirms a bearish regime for Lucid stock, with price below every major trend anchor.
Trend Anchors and Momentum
On the daily timeframe, LCID trades beneath its 20-day EMA at 5.95 and its 50-day EMA at 6.27. It also sits far below the 200-day EMA at 9.43. That last gap is significant. It shows the stock has lost nearly half its value relative to its longer-term trend anchor. It also reinforces the bearish reading attached to this timeframe.
The daily RSI sits at 36.65. That is weak territory, but not yet technically oversold. It leaves room for further downside before exhaustion signals typically appear. Meanwhile, the MACD line at -0.41 remains well below its signal line at -0.23, with a histogram of -0.18. The gap between the two lines is still widening. Momentum is negative, and sellers are gaining strength on the daily chart.
Volatility and Pivot Levels
Bollinger Bands add another layer. The mid-band sits at 6.28, the upper band at 7.96, and the lower band at 4.59. With price at 5.09, Lucid stock trades much closer to the lower band than to the mid-line. That is a classic signature of a market riding the lower channel in a persistent downtrend. Notably, daily ATR14 stands at 0.43, indicating volatility remains elevated relative to the current price level.
Pivot levels reinforce the pressure. The daily pivot point sits at 5.18, with resistance at 5.51 (R1) and support at 4.77 (S1). Price closing below the pivot at 5.09 confirms sellers dictated the session. The next real test lies at that 4.77 support band.
1H Timeframe: Momentum Pauses, But Trend Is Not Reversed
On the hourly chart, momentum is pausing, but the trend has not reversed.
The hourly chart tells a more nuanced story. Price at 5.09 is hugging its 20-period EMA of 5.13. The 50-hour EMA at 5.39 and the 200-hour EMA at 6.12 still sit meaningfully above current levels. In other words, the short-term average has caught up with price. The broader hourly structure remains tilted lower.
RSI on the 1H chart reads 44.08, noticeably higher than the daily reading and firmly neutral. At the same time, MACD shows the line at -0.08 against a signal of -0.11, producing a small positive histogram of 0.03. That is a subtle but real divergence from the daily picture. Intraday momentum is flattening out, even flickering slightly positive, while the bigger trend below it remains bearish.
However, this is where the conflict between timeframes becomes explicit. The daily chart says sellers are firmly in control. The hourly chart suggests the selling pressure has paused, at least temporarily. Price is consolidating right around its own pivot point of 5.12. Hourly resistance at 5.15 (R1) and support at 5.05 (S1) are both extremely tight to current price. That underscores how narrow this consolidation has become.
Bollinger Bands on the hourly chart show the mid-band at 5.10, the upper band at 5.39, and the lower band at 4.80. Price sits almost exactly at the mid-line. That is another sign of indecision rather than directional conviction. Still, the hourly regime is labeled bearish. The momentum readings are clearly softer than the daily ones. This complicates any assumption that the drop is accelerating right now.
15-Minute Chart: Execution Context Only
The 15-minute chart offers execution context rather than a directional edge, with price coiling in a neutral range.
Zooming into the 15-minute chart, the picture is one of pure indecision rather than a tradable signal on its own. Price at 5.09 sits below the 20-period EMA (5.14), the 50-period EMA (5.12), and the 200-period EMA (5.41). RSI at 45.95 is neutral. MACD is essentially flat, with the line at 0.02 versus a signal of 0.04 and a histogram of -0.02.
The 15m Bollinger Bands show the mid-band at 5.18, the upper band at 5.34, and the lower band at 5.03. Price is hugging the lower half of the range, consistent with short-term hesitation. The regime here reads “neutral,” which fits. This timeframe is not offering a directional edge. It only shows how tightly the stock is coiling near the 5.06–5.13 pivot zone before its next move.
The News Backdrop Adds Fundamental Weight to the Bearish Case
The news backdrop adds fundamental weight to the bearish technical case, even though the narrative is not uniformly negative.
Technical weakness on LCID stock is not happening in a vacuum. Recent headlines describe Lucid’s stock collapsing again after its new CEO unveiled a sweeping list of fixes, partnerships, and promises. Wall Street punished the shares regardless. Separately, coverage noted Lucid sinking 6% despite unveiling what the company calls America’s most powerful three-row crossover. Investors reportedly read the fine print very differently than management intended.
At the same time, not every voice is bearish. One Seeking Alpha piece frames Lucid as an EV turnaround play with significant upside. It points to Q4 Gravity GT-S deliveries as a potential catalyst, even while acknowledging weak margins persist. On the other hand, a Motley Fool piece bluntly questions whether there is still a bull case left. It notes Lucid keeps burning cash while rivals scale production. This split in narrative mirrors the technical divergence between the daily downtrend and the hourly pause.
Bullish Scenario: What Would Need to Change
A genuine bullish reversal would require reclaiming the 5.18 daily pivot and then the 20-day EMA near 5.95.
For that reversal in Lucid stock, price would first need to hold above the 5.18 daily pivot and the 20-day EMA near 5.95. Meanwhile, a daily close back above the 5.51 R1 level would meaningfully weaken the current bearish regime. RSI pushing back above 50 and the MACD histogram flipping positive would reinforce that shift. On the fundamental side, positive delivery updates tied to the Gravity GT-S in the fourth quarter could give the turnaround thesis more credibility. Evidence that cash burn is stabilizing would help as well.
Bearish Scenario: What Would Confirm Further Downside
Further downside would likely be confirmed by a break below the 4.77 daily support and a test of the 4.59 lower band.
Conversely, the bearish case strengthens if price breaks below the daily S1 support at 4.77 and tests the lower Bollinger Band at 4.59. A daily RSI reading that fails to recover above 40 would confirm sellers are reasserting control after the hourly pause. A further widening of the MACD histogram would reinforce that reading. Continued negative headlines around cash burn and skepticism toward management’s turnaround promises would likely reinforce that move. That is especially true given how far price already sits from the 200-day EMA at 9.43.
Closing Take
The dominant lens remains bearish, even though intraday stabilization has reduced immediate downside velocity.
Overall, the daily trend in Lucid stock remains clearly bearish, and that has to be the dominant lens through which traders view this setup. However, the hourly stabilization around the 5.05–5.15 zone suggests the drop has lost some immediate downside velocity. It has not reversed, though. The 15-minute chart offers no directional edge. It only confirms that price is coiling near short-term pivots.
ATR readings are elevated on both daily and hourly timeframes. Volatility is likely to remain a defining feature of LCID stock price action in the sessions ahead. Positioning around key levels like 4.77 support and 5.51 resistance will matter more than ever. The market is still digesting conflicting fundamental narratives.
FAQ
What is the current trend for Lucid stock?
The daily trend is clearly bearish. Lucid stock closed at $5.09 on August 27, below its 20-day EMA at 5.95, its 50-day EMA at 6.27, and its 200-day EMA at 9.43.
Where are the key support and resistance levels for LCID?
Key daily support sits at 4.77, with the lower Bollinger Band at 4.59. Key resistance sits at 5.51, while the daily pivot is at 5.18 and the 20-day EMA is near 5.95.
Is there any bullish signal in the technical picture?
The hourly chart shows a pause in selling pressure, with RSI at 44.08 and a small positive MACD histogram of 0.03. However, this stabilization has not reversed the broader bearish structure.
What fundamental factors are influencing Lucid stock?
News flow is split. Some coverage points to Q4 Gravity GT-S deliveries as a potential catalyst. Other coverage focuses on ongoing cash burn and skepticism toward the new CEO’s turnaround promises.
Disclaimer: This article is for informational purposes only and does not constitute financial advice, an investment recommendation, or a solicitation to buy or sell any financial instrument or cryptocurrency. The analysis provided is not indicative of future results. Investing in crypto assets and financial markets carries a high risk of capital loss. Always do your own research (DYOR) and consult a qualified financial advisor before making any decision.
Article produced with the assistance of artificial intelligence and reviewed by the editorial team.
