




Rivian stock closed Thursday at $16.80 after trading between $16.42 and $16.97. The session showed a market building on recent gains. However, CFO Claire McDonough’s announced departure to GE Vernova adds uncertainty into Friday’s open, testing the technical setup.
Summary
Key takeaways
- Rivian stock closed Thursday at $16.80, above its $16.46 open and near the daily upper Bollinger Band at $17.13.
- The daily MACD turned positive with a 0.15 histogram, but the daily regime remains neutral.
- CFO Claire McDonough steps down October 30 to join GE Vernova during the R2 ramp.
- Key resistance sits at $17.04 (daily R1), with support near $16.49 (daily S1).
- The 1H timeframe is bullish, while the 15-minute MACD histogram has flipped slightly negative.
Rivian Stock Daily Chart: A Cautious Attempt at a Breakout
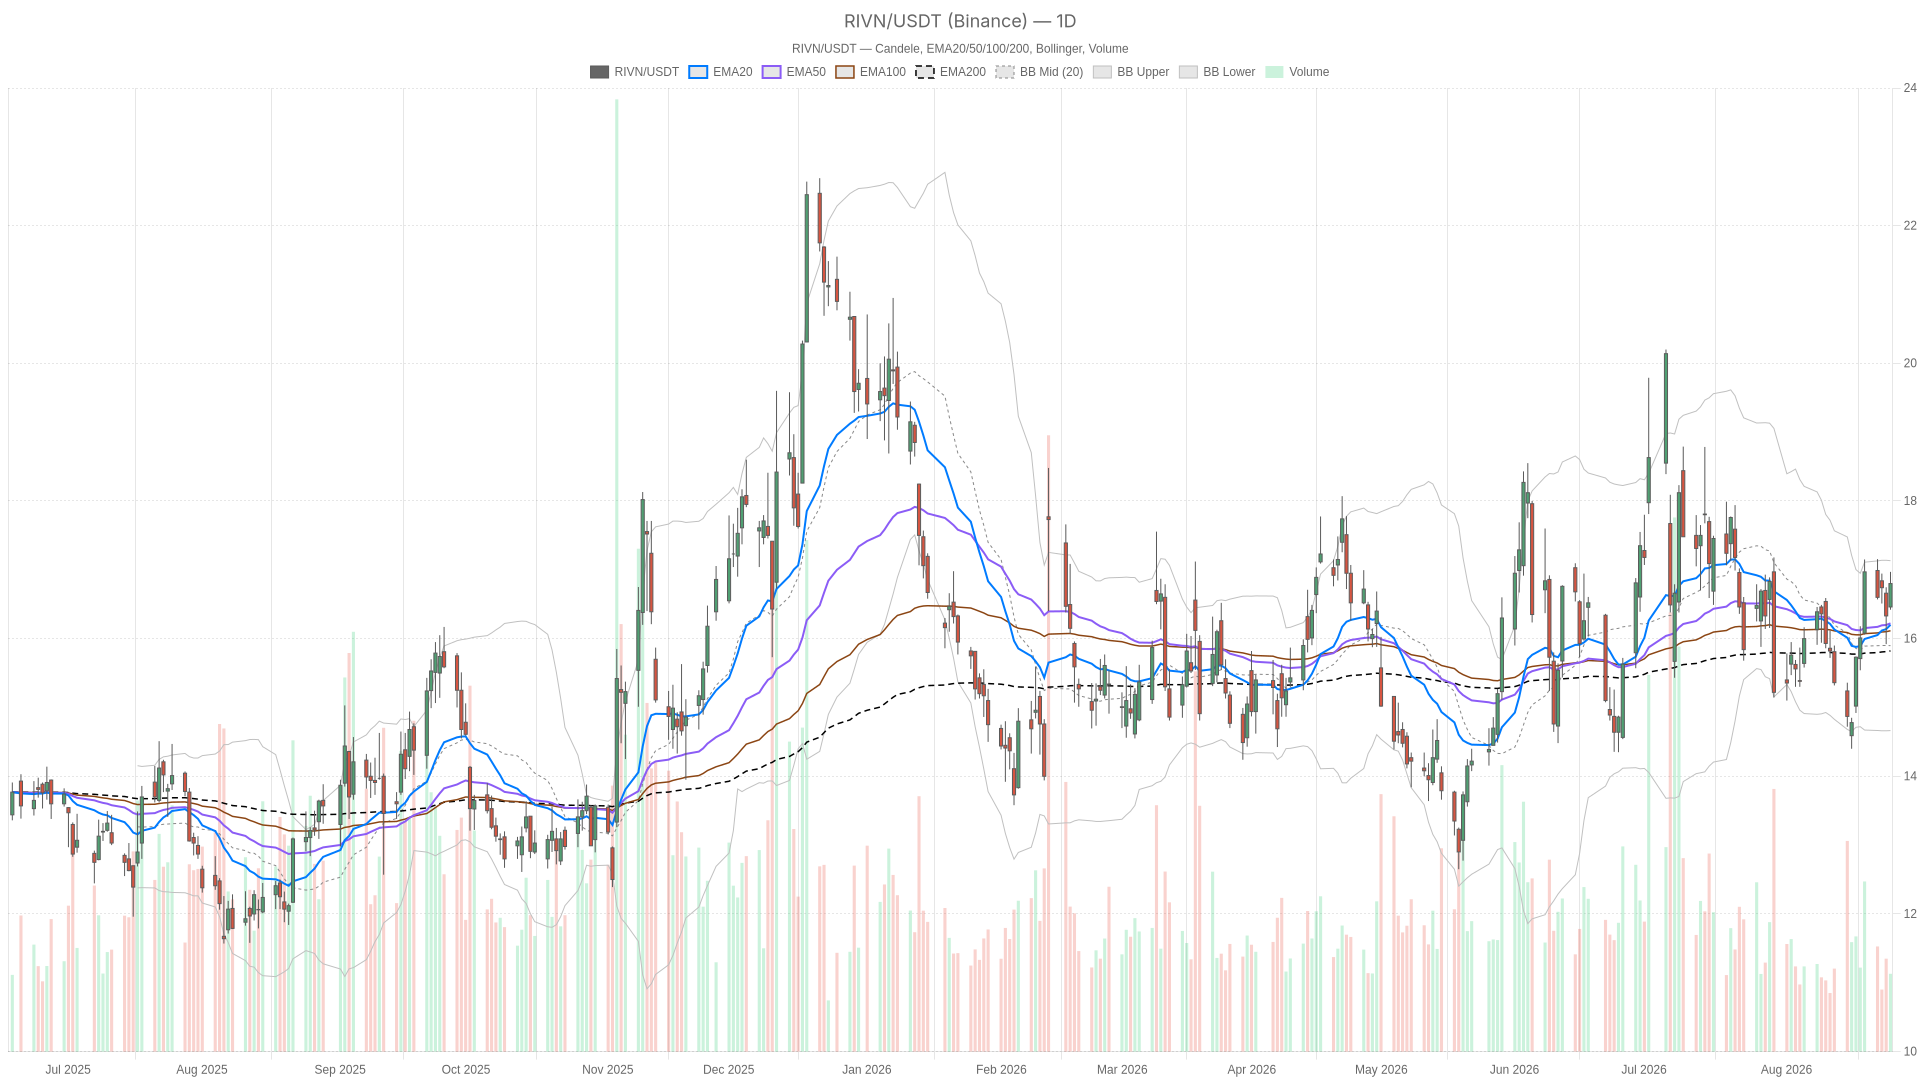
Rivian stock’s daily chart shows a cautious breakout attempt rather than a confirmed trend. Price closed above the EMA20 ($16.20), EMA50 ($16.22) and EMA200 ($15.82). That looks constructive on the surface. However, the EMA20 and EMA50 are nearly overlapping. This signals a market still flattening out of consolidation, not one in a clean trend.
The daily RSI at 54.8 sits in neutral territory, above the midline but far from overbought. Meanwhile, the daily MACD line (0.04) has crossed above its signal line (-0.12). The positive histogram of 0.15 marks a shift from fading downside momentum toward early upside momentum.
Daily Bollinger Bands place the mid-line at $15.90, the upper band at $17.13 and the lower band at $14.66. Thursday’s close at $16.80 sits near the upper band. This typically reflects an expansion phase after tighter, low-volatility trading. Daily ATR14 at 0.65 confirms volatility is picking up relative to price.
Daily pivot levels set the pivot at $16.73, resistance R1 at $17.04 and support S1 at $16.49. Closing above the pivot and pushing toward R1 is a near-term positive. Still, price is now bumping directly against a key resistance zone rather than trading with clean room above it.
1H Timeframe: Momentum Confirms, but Narrowly
The 1-hour timeframe confirms the bullish turn, though the momentum signal remains thin. Price at $16.80 sits above the EMA20 ($16.56), EMA50 ($16.35) and EMA200 ($16.24). The system flags this timeframe as bullish outright. RSI at 60.18 supports that view, showing intraday buyers in control without stretched conditions.
The 1H MACD line (0.08) is above its signal line (0.05), with a positive but thin histogram of 0.03. That is a genuine bullish signal, yet the small histogram suggests limited force. In other words, the 1H chart confirms the daily attempt to turn higher, but without much conviction.
1H Bollinger Bands show the mid at $16.54 and the upper band at $17.12, with price hugging that boundary. Combined with an ATR14 of 0.23, this points to a market that has already made a meaningful short-term move. It is now testing how much further it can extend before pausing. The 1H pivot at $16.79, resistance at $16.89 and support at $16.69 form a tight, undecided zone.
15-Minute Execution Context: Momentum Stalls Near Resistance
The 15-minute chart shows short-term momentum stalling right near resistance. The regime is still labeled bullish. Price holds above the EMA20 ($16.71), EMA50 ($16.61) and EMA200 ($16.33). RSI at 58.68 remains constructive. Notice, however, that the MACD line and signal line are essentially equal at 0.08. The histogram has flipped slightly negative at -0.01. That is a subtle but real warning: momentum is losing its edge as price approaches resistance.
The 15-minute Bollinger Bands have compressed sharply. The mid sits at $16.73 and the upper band at just $16.83, a tight range versus the daily and hourly bands. This compression, paired with an ATR14 of only 0.08, often precedes a decisive move once the range breaks. The 15m pivot at $16.82, resistance at $16.87 and support at $16.74 frame the immediate battleground for traders watching RIVN stock price action into Friday’s session.
Bullish Scenario: Clearing the $17.04–$17.13 Zone
The bullish case requires a clean break above $17.04 and a sustained close beyond $17.13. That break would confirm the daily MACD crossover is more than a false start. It would likely pull the EMA20 above the EMA50 on the daily chart, reinforcing the shift already visible on the 1H timeframe. Holding above the $16.69–$16.79 hourly support zone, with RSI staying above 50 across timeframes, would keep the short-term uptrend intact.
Notably, one of this week’s news items framed Rivian as ‘an EV maker on the rebound.’ If that is reflected in continued buying interest, it would align with the technical push toward resistance.
Bearish Scenario: CFO Exit Meets a Resistance Wall
The bearish case hinges on the CFO departure landing at a sensitive technical juncture. On the other hand, a failure to clear the $16.87–$17.04 resistance band would matter. Combined with the already-flattening 15-minute MACD histogram, it would suggest buyers are running out of steam at the top of the range. In that scenario, price could retreat toward daily S1 at $16.49 or the EMA20/EMA50 cluster near $16.20–$16.22.
A daily close back below that EMA cluster would invalidate the tentative bullish structure. It would shift the neutral daily regime firmly toward the downside. McDonough’s exit adds execution risk to the R2 ramp during a period of fragile EV demand.
Closing Thoughts: A Two-Sided Inflection Point
Rivian stock sits at a two-sided technical inflection point. Overall, the daily chart shows early signs of a momentum shift. The 1-hour timeframe confirms that shift with a clearer bullish regime. The 15-minute chart shows the push losing steam into resistance. Meanwhile, the CFO transition introduces a fundamental variable the charts alone cannot price in.
Volatility, as measured by ATR across all three timeframes, has been building. Price is squeezed between resistance near $16.87–$17.04 and support near $16.49–$16.69. The next directional move is likely to be sharp once it comes. Positioning around RIVN stock into this window should account for that two-sided risk rather than assume the grind higher continues uninterrupted.
FAQ
What is the key resistance level for Rivian stock?
The key resistance band sits at $16.87–$17.04, with daily R1 at $17.04 and the upper Bollinger Band at $17.13. A sustained close above that zone would confirm the bullish case.
Why does the CFO departure matter to the technical setup?
CFO Claire McDonough is stepping down October 30 to join GE Vernova during the R2 ramp. The stock reportedly slipped after-hours on the news, adding execution risk at a sensitive technical juncture.
Where is the key support if Rivian stock pulls back?
Support sits near daily S1 at $16.49, with a deeper EMA20/EMA50 cluster near $16.20–$16.22. A daily close below that cluster would invalidate the bullish structure.
Is the current trend bullish or neutral?
The 1-hour timeframe is bullish, while the daily regime remains neutral. The 15-minute chart shows short-term momentum stalling near resistance, making the setup two-sided.
Disclaimer: This article is for informational purposes only and does not constitute financial advice, an investment recommendation, or a solicitation to buy or sell any financial instrument or cryptocurrency. The analysis provided is not indicative of future results. Investing in crypto assets and financial markets carries a high risk of capital loss. Always do your own research (DYOR) and consult a qualified financial advisor before making any decision.
Article produced with the assistance of artificial intelligence and reviewed by the editorial team.
