




Tesla stock faces mounting bearish pressure heading into July 2026. TSLA closed at $393.45 on July 2nd after an aggressive reversal from $432.35. The breakdown below key EMAs across all timeframes signals distribution, and the daily bias leans bearish despite a neutral technical classification.
Summary
Key takeaways
- TSLA closed at $393.45 on July 2nd, barely above the EMA200 at $395.03.
- Price sits below the EMA20 and EMA50 cluster, confirming short-term bearish structure.
- The hourly chart shows all three EMAs forming dense resistance around $403.
- Daily ATR of 19 points signals elevated volatility and wide intraday swings.
- A daily close below $395 would target the S1 pivot at $377.72.
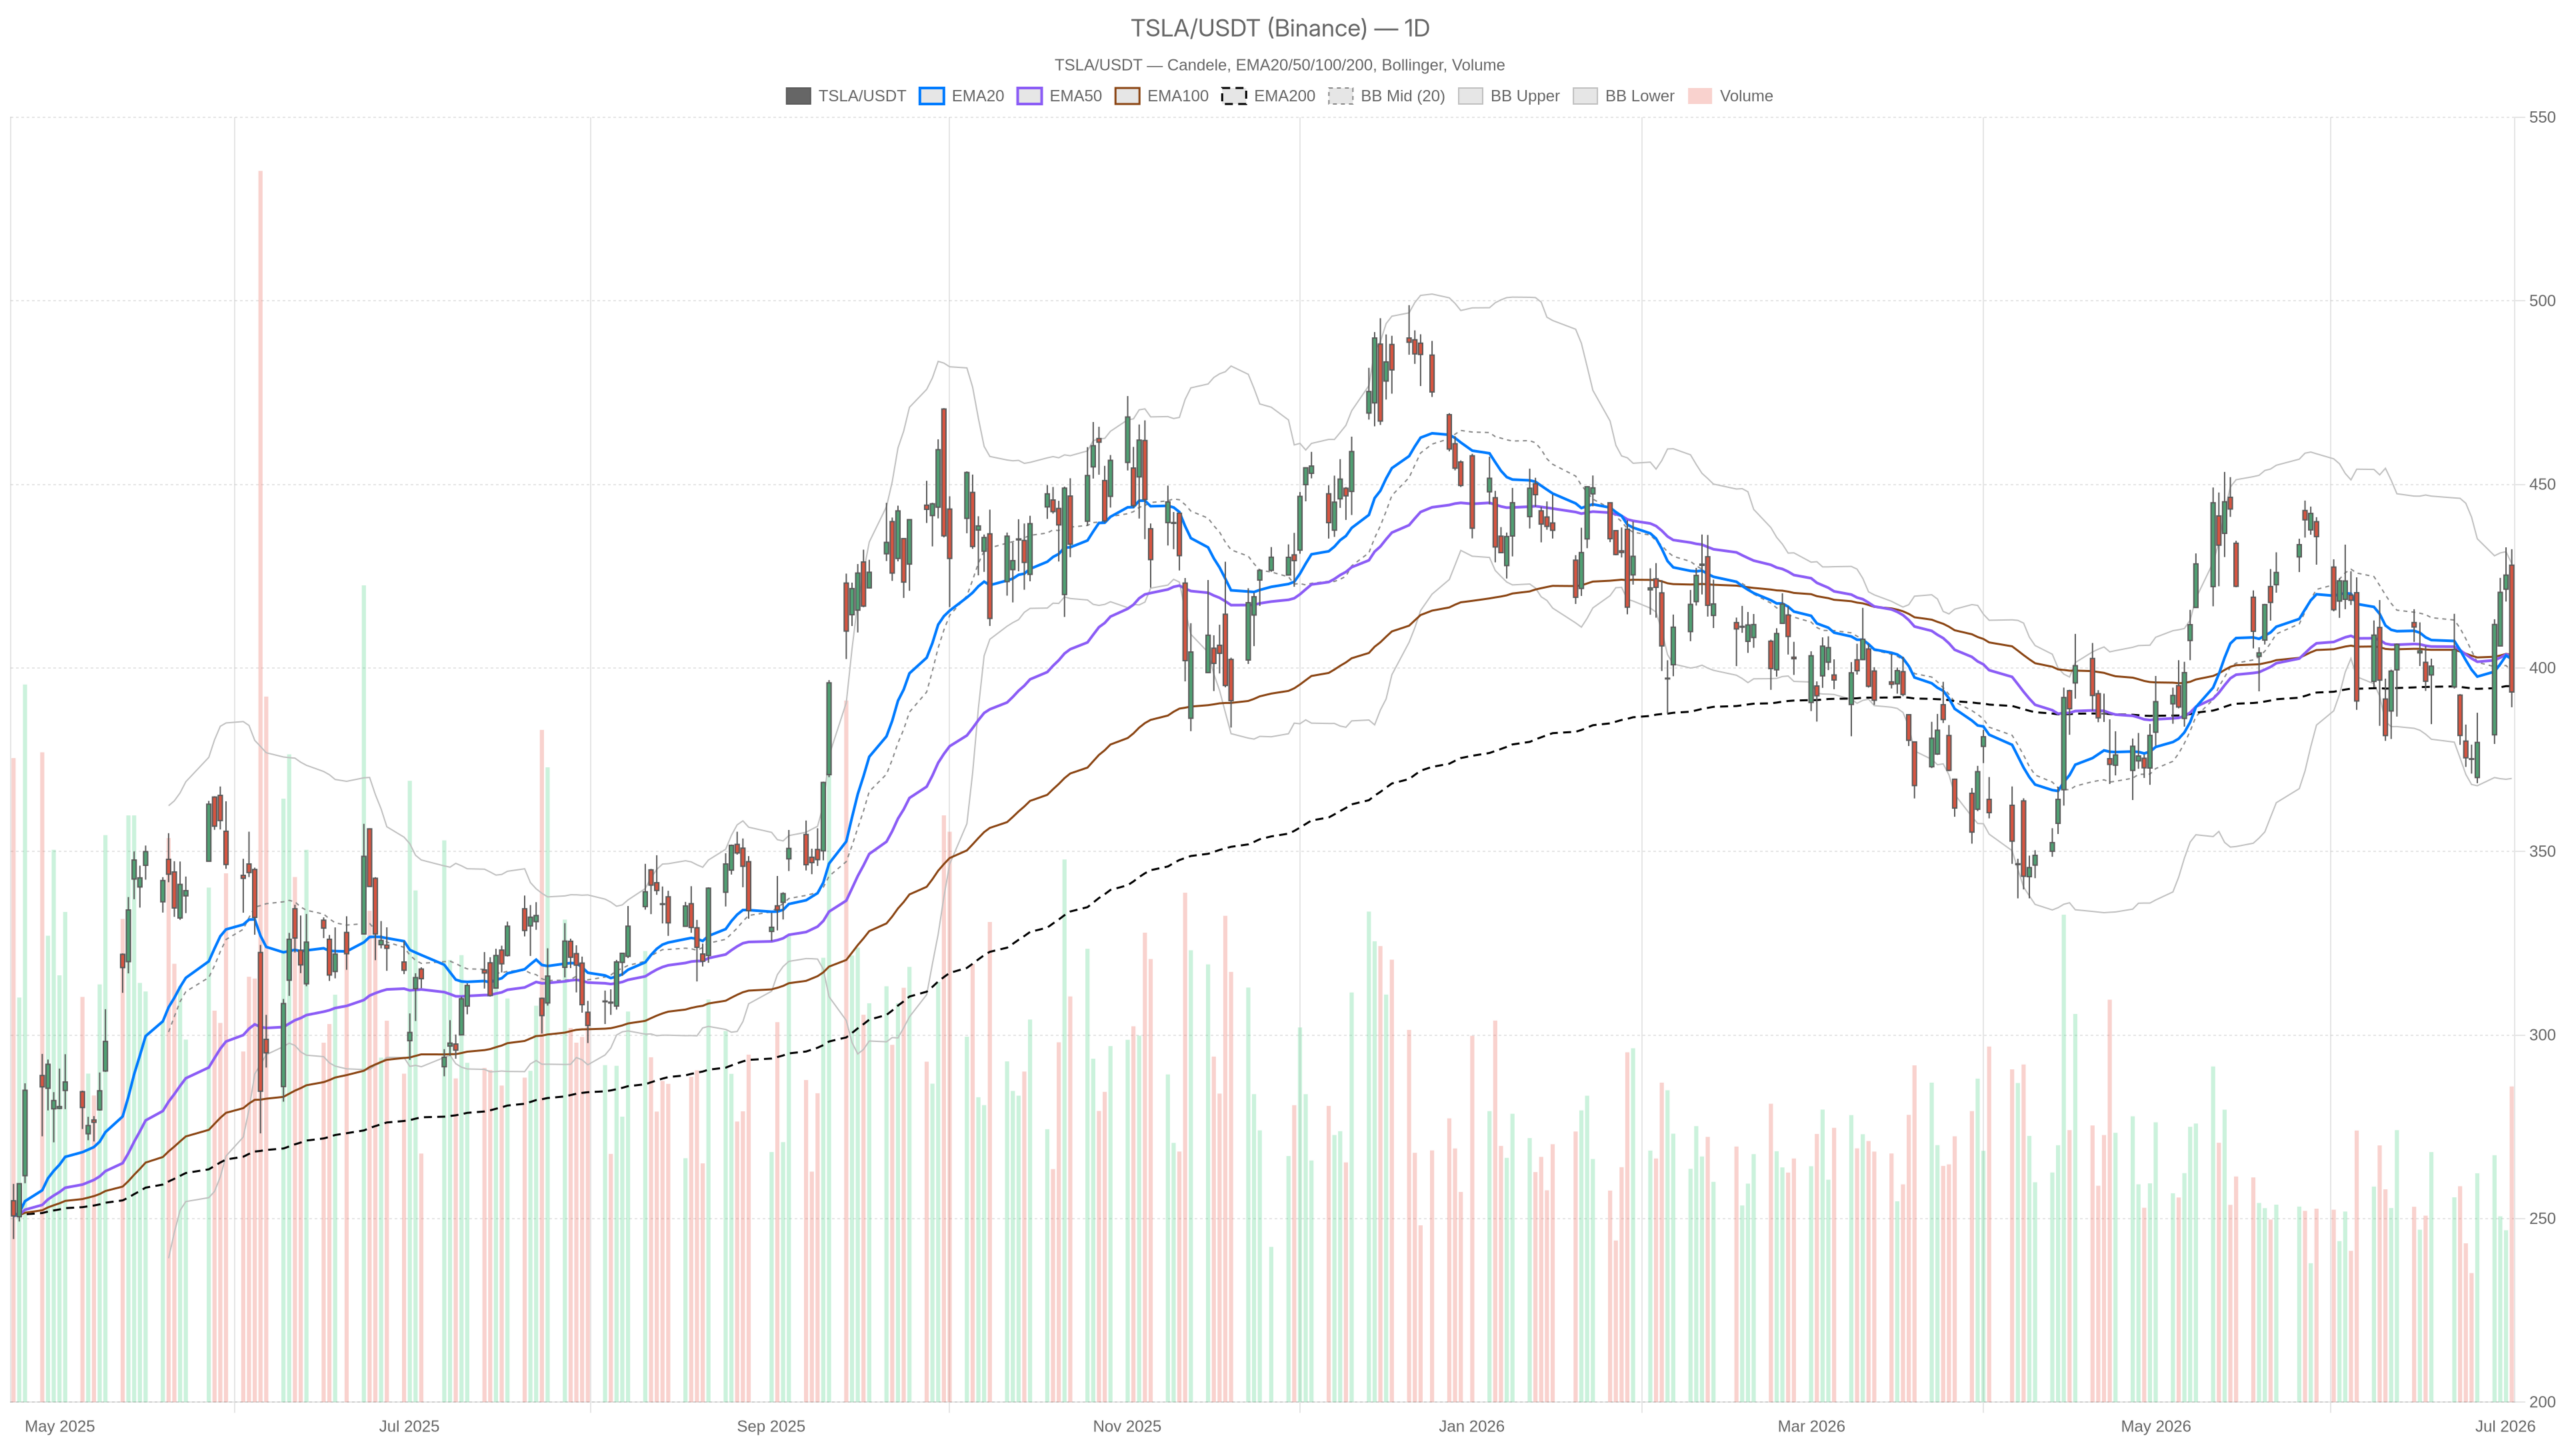
Daily Chart: Tesla Stock Sits Precariously Above the EMA200
Tesla stock’s daily chart shows price barely clinging above the EMA200 at $395.03. This proximity reflects a market in transition with no clear directional conviction. TSLA closed at $393.45 — just below that critical long-term average. That level has historically acted as both a magnet and a battlefield.
Meanwhile, both the EMA20 at $402.42 and the EMA50 at $403.29 are positioned above current price. That alignment confirms the path of least resistance is currently downward. Recovering above those EMAs would require a meaningful shift in buying pressure.
The daily RSI at 46.77 is retreating toward the lower half of its range. It has not crossed into oversold territory, but it is not recovering either. That reading is consistent with a market that has lost upside momentum without triggering a capitulation signal. The MACD tells a similar story, with the main line at -1.63 while the signal is at -3.29. However, the histogram is ticking positive at +1.65. This suggests the pace of selling may be slowing — a minor stabilizing sign, but not a reversal signal.
Meanwhile, Bollinger Bands on the daily frame show price mid-range. It sits between the lower band at $369.90 and the upper at $428.41. The mid-band at $399.16 now acts as overhead resistance. At the same time, daily ATR of 19.05 confirms this is a high-volatility stock. A single session can easily cover the distance between key support and resistance.
The daily pivot structure reinforces the caution. The pivot point is at $405.03, with R1 resistance at $420.77 and S1 support at $377.72. TSLA is trading below the pivot, which tilts the near-term structure bearish. A reclaim of $405 would be the first meaningful sign that bulls are regaining control.
Hourly Chart: TSLA Confirms Bearish Pressure Below Key Resistance
The hourly chart offers no contradicting comfort for Tesla stock. The short-term trend confirms the bearish bias visible on the daily timeframe. TSLA’s hourly close at $392.82 sits well below all three key EMAs. The EMA20 at $405.16, the EMA50 at $402.47, and the EMA200 at $403.63 are clustered tightly around $403. This creates a dense resistance zone that price must break through to shift the short-term narrative.
The hourly RSI at 37.32 is approaching oversold conditions. It is not there yet, but the trajectory is clear. An MACD histogram deep in negative territory at -4.62 reinforces ongoing selling pressure. Notably, the MACD line at -2.62 has crossed well below its signal line at +2.01. This bearish cross reinforces downside momentum on this timeframe.
The hourly Bollinger Bands show the mid-band at $413.12, significantly above price. That gap underscores how far TSLA has drifted from its recent mean on an intraday basis. Hourly support from the pivot sits at $391.09. The immediate floor around $390.91 comes from the session low. Bulls need to defend this level with urgency.
15-Minute Chart: Tesla Stock Nears Oversold Territory
The 15-minute chart suggests Tesla stock may be approaching conditions for a short-term technical bounce. This timeframe is primarily useful for timing entries and observing micro-structure behavior. Here, the RSI has dropped to 32.78 — sitting at the edge of oversold territory. The MACD histogram on this timeframe is ticking up at +1.06, echoing the daily histogram’s positive divergence.
However, price on the 15-minute chart trades below both the EMA50 at $403.97 and the EMA200 at $402.15. The EMA20 at $395.70 is the nearest overhead reference. That structure keeps any intraday bounce contained and speculative rather than trend-following. Traders watching for a scalp recovery would need to see price reclaim $394–$395 before adding confidence to the upside.
Bullish Case: What Could Drive a Tesla Stock Recovery
A credible bullish scenario for Tesla stock exists — but it needs to earn its credibility. The Q2 delivery figures appear to have exceeded expectations. This triggered overnight gains and renewed analyst attention. Analyst Gary Black flagged higher gas prices as a genuine tailwind for EV demand. He noted that macro factors may be driving volume more than Tesla’s autonomous driving narrative.
Additionally, Cathie Wood’s Ark Investment Management added $38.1 million in TSLA shares during the recent pullback. That kind of institutional conviction during a dip carries signaling weight, even if the trade is early. On the technical side, the EMA200 at $395.03 remains a key battleground. If TSLA reclaims that level and consolidates above it, the daily structure could stabilize quickly. The improving MACD histogram momentum supports this possibility.
In that scenario, a recovery toward the daily pivot at $405 becomes the logical first target. The EMA20 and EMA50 cluster at $402–$403 would also come into play. Above that, the Bollinger upper band at $428.41 aligns with the intraday high from July 2nd. This sets up a meaningful resistance test should bulls gather momentum.
Bearish Case: What Could Invalidate Tesla Stock Bulls
On the other hand, the fundamental backdrop for Tesla stock carries real headwinds. California’s new EV incentive program has explicitly excluded Tesla, benefiting rivals like Rivian and Lucid. That policy friction combines with pricing pressure and margin concerns flagged in recent analysis. Together, they undermine the earnings growth story. AI ambitions are not yet generating enough revenue to offset automotive segment weakness. This is a key concern for a stock trading at a $1.48 trillion market cap.
Technically, a daily close below the EMA200 at $395 would confirm the bears’ thesis. The S1 pivot at $377.72 would then become the next natural target. Given the daily ATR of 19 points, that move is achievable within two to three sessions. The hourly MACD histogram’s deep negative reading suggests selling momentum remains intact. This makes a sustained breakdown plausible.
Furthermore, the market cap comparison with Meta at $1.48 trillion raises a harder question. If two companies of vastly different business quality are valued the same, one is likely mispriced. That valuation debate adds an additional layer of downside risk for TSLA should sentiment shift.
Positioning and Volatility Outlook for TSLA
Overall, Tesla stock is at a technical inflection point that demands careful risk management. The daily bias leans bearish, the hourly confirms it, and the 15-minute hints at a minor stabilization that has yet to prove itself. That $390–$395 zone is the line in the sand. Holding it matters significantly for near-term direction.
At the same time, volatility remains elevated with a daily ATR of over 19 points. Positioning in either direction carries meaningful risk. The conflicting signals warn against premature confidence. Positive MACD histograms on daily and 15-minute contrast with a deeply negative hourly reading. Until TSLA reclaims the $403–$405 cluster with volume conviction, the risk/reward continues to favor caution over aggression.
FAQ
What is the key support level for Tesla stock right now?
The most critical support is the daily EMA200 at $395.03. TSLA closed at $393.45 on July 2nd, barely below it. A confirmed close beneath this level would open the door to the S1 pivot at $377.72.
What would signal a bullish reversal for TSLA?
A bullish reversal would require TSLA to reclaim the $403–$405 cluster with volume conviction. This zone contains the hourly EMA cluster and the daily pivot point. Above that, the Bollinger upper band at $428.41 becomes the next target.
Why is Tesla stock under pressure despite strong Q2 deliveries?
Strong delivery numbers triggered overnight gains but failed to hold. California’s new EV incentive program excluded Tesla, benefiting competitors. Combined with margin concerns and AI revenue uncertainty, the fundamental backdrop is weighing on sentiment despite operational positives.
What does the MACD histogram divergence signal?
The daily and 15-minute MACD histograms show positive divergence, suggesting selling momentum may be slowing. However, the hourly MACD remains deeply negative at -4.62. This mixed signal warns against reading the positive divergence as a confirmed reversal.
Disclaimer: This article is for informational purposes only and does not constitute financial advice, an investment recommendation, or a solicitation to buy or sell any financial instrument or cryptocurrency. The analysis provided is not indicative of future results. Investing in crypto assets and financial markets carries a high risk of capital loss. Always do your own research (DYOR) and consult a qualified financial advisor before making any decision.
Article produced with the assistance of artificial intelligence and reviewed by the editorial team.
