




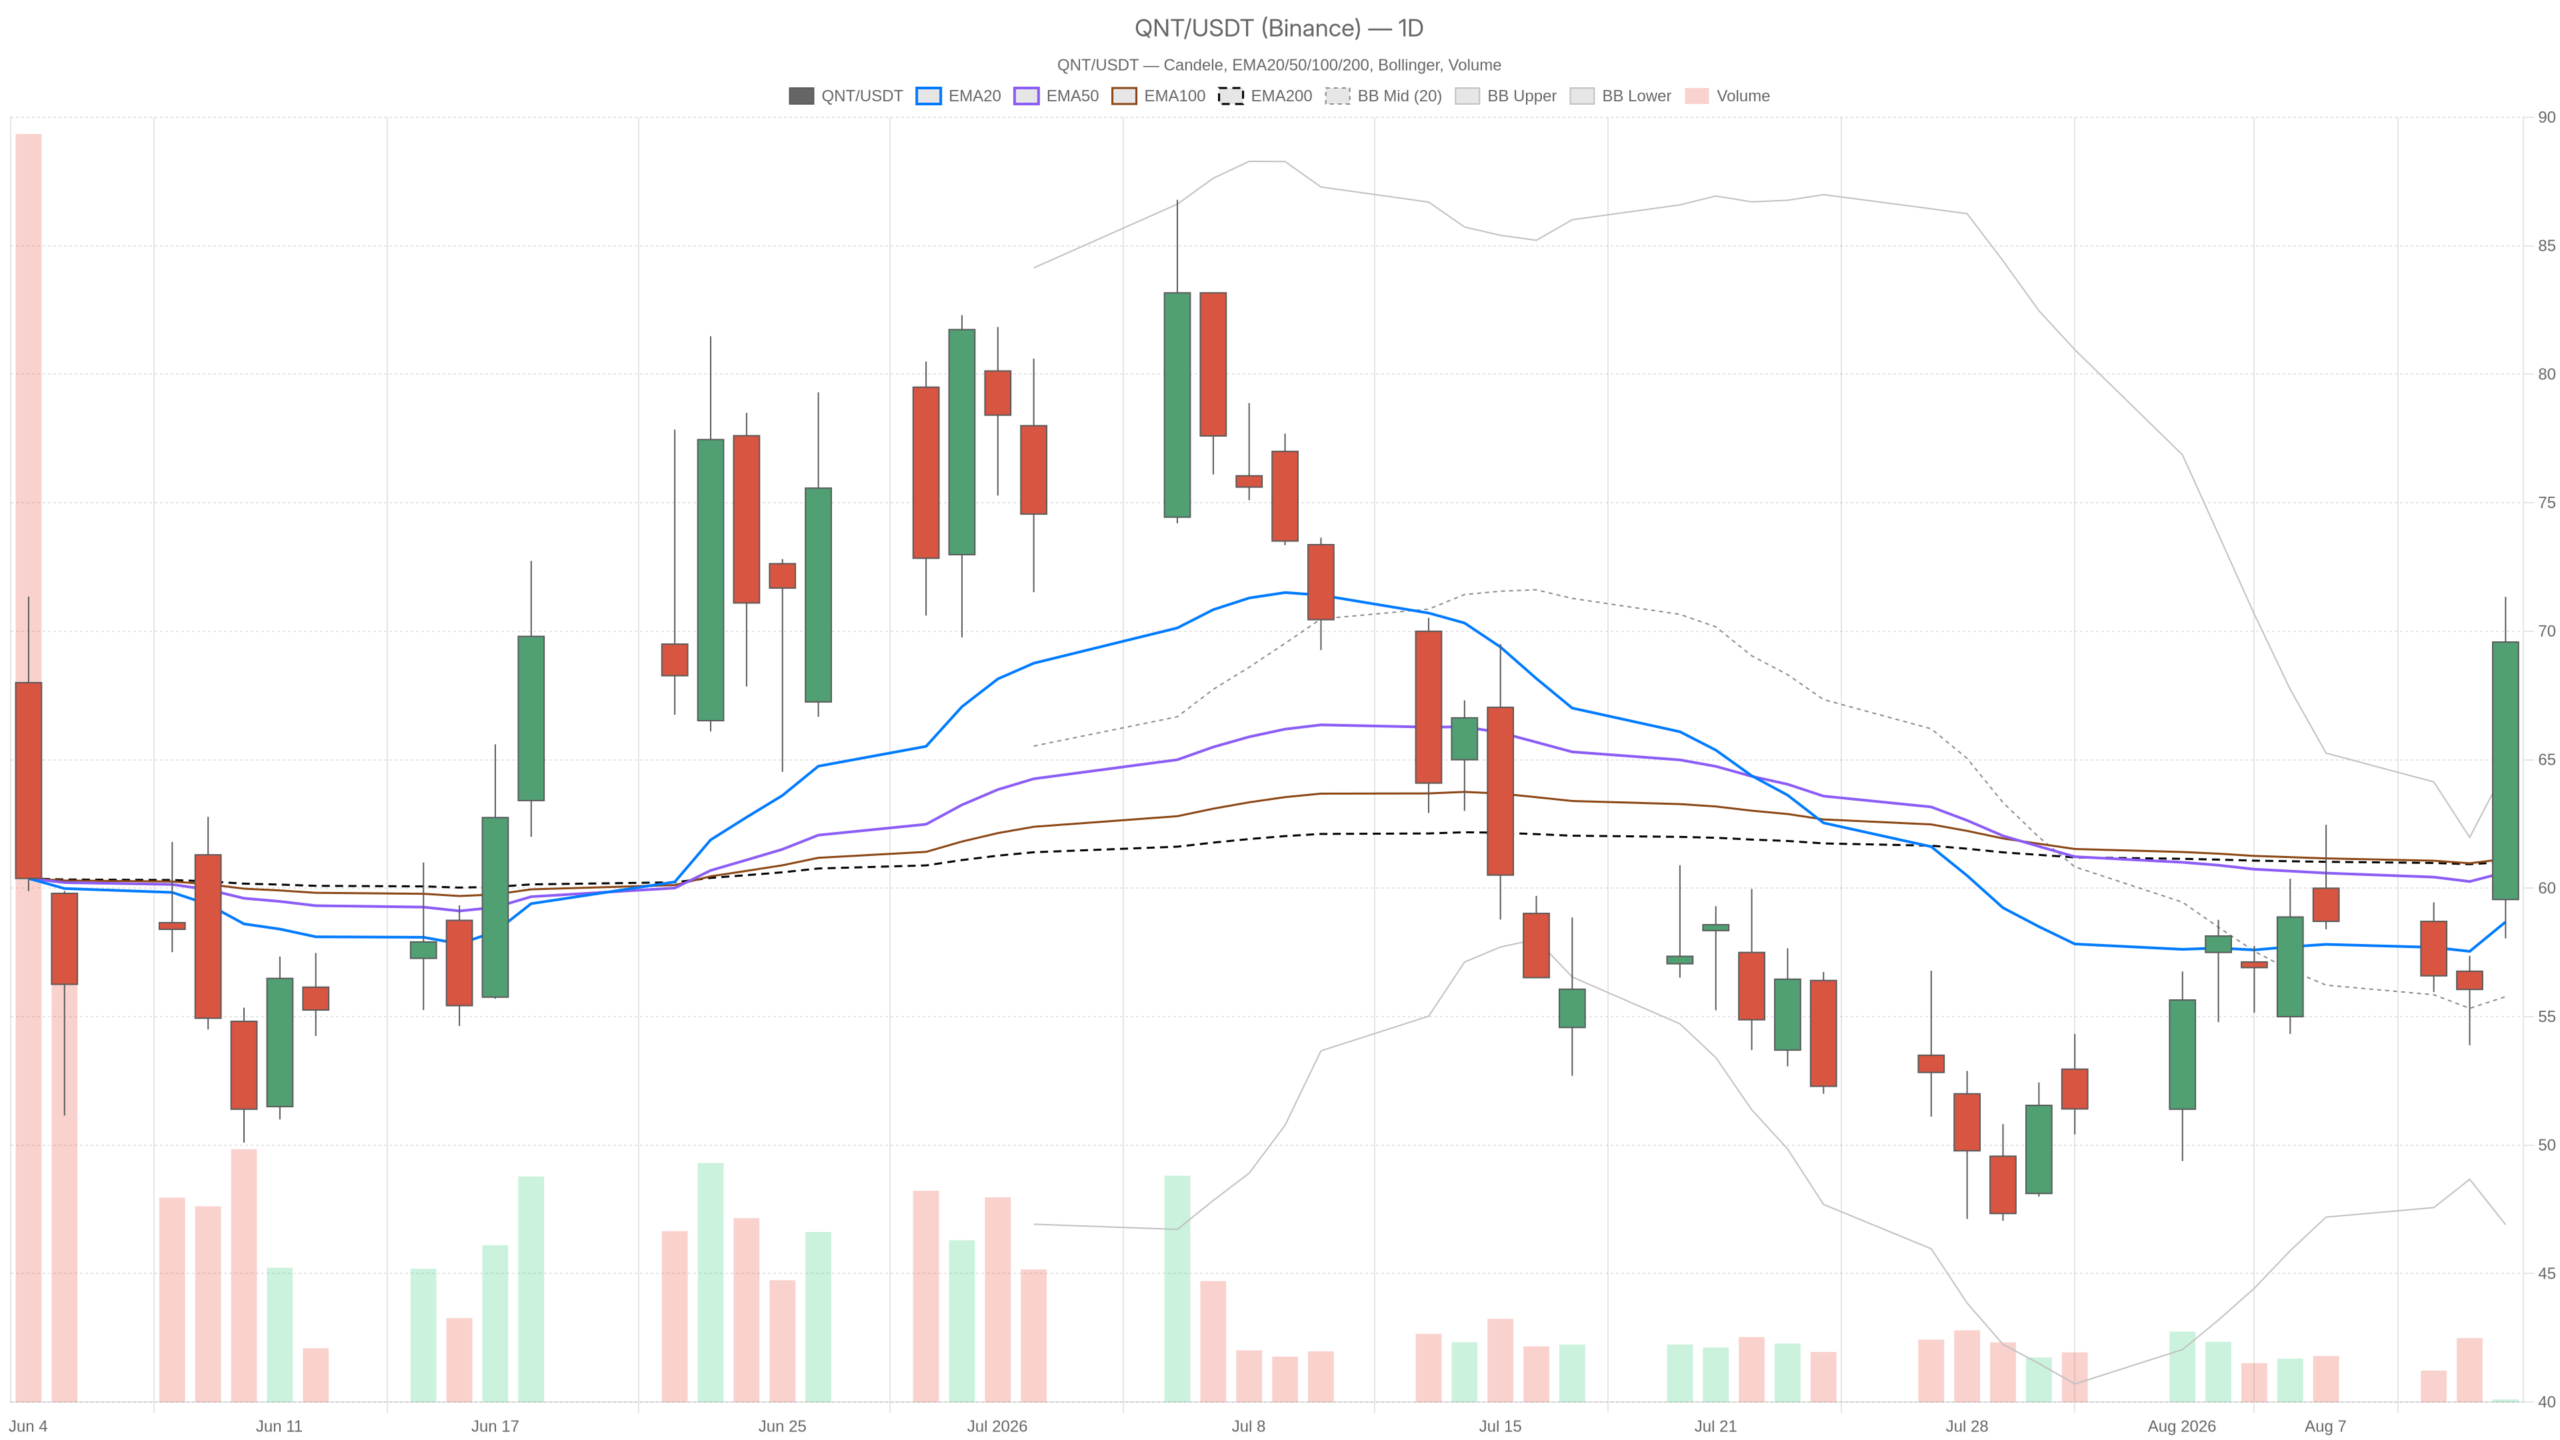
Quantinuum Inc. stock delivered the kind of session that resets a chart. QNT closed at 69.58 after opening at 59.56, a 13.29-point range roughly 2.5 times the daily ATR of 5.40. The bias has flipped constructive, but the violence of the move rarely resolves cleanly.
Summary
Key takeaways
- Quantinuum jumped 9% after its Q2 report, driven by a revenue beat, strong bookings, and the Oracle Helios deployment on OCI.
- Management guided 2026 revenue to $28M–$32M and flagged a 279% revenue surge in its first earnings call since the IPO debut.
- QNT closed at 69.58, well above every major daily moving average — but also outside the upper Bollinger band at 64.65.
- Daily RSI at 62.12 leaves room above, while hourly RSI at 78.19 flashes overbought on the shorter timeframe.
- The daily pivot at 66.32 is the first real test of the breakout — holding it as support would build credibility.
The catalyst is documented. Quantinuum jumped 9% after its Q2 report. Analysts pointed to a revenue beat and strong bookings, alongside the Oracle Helios deployment on OCI. Management guided 2026 revenue to $28M–$32M and flagged a 279% revenue surge. This is a repricing event, not a drift higher. That distinction matters for how the next sessions are likely to behave.
The daily chart on Quantinuum Inc. stock now leans bullish
The daily chart on Quantinuum Inc. stock has shifted constructive following the earnings-driven breakout. Price is above every major moving average. However, the structure still reflects a freshly broken range rather than an established uptrend.
Moving averages and momentum signal a shift
Price is above every major daily moving average. Notably, the EMA20 at 58.69 sits below both the EMA50 at 60.63 and the EMA200 at 61.02. That compression and misalignment is the signature of a range that has just been broken, not a trend that has been running. The daily regime remains classified as neutral, and that label is fair.
Momentum confirms the shift without confirming a trend. Daily RSI at 62.12 is firm but not extreme, leaving room above before the reading becomes problematic. Meanwhile, the MACD line at -0.79 remains below zero. Still, it has crossed above its signal at -2.33, producing a histogram of +1.54. The bearish phase has ended, but the bullish phase has not yet been established. That is the honest reading.
Volatility points to statistical stretch
The volatility picture is more emphatic. The close at 69.58 sits well above the upper Bollinger band at 64.65. The mid band is at 55.78 and the lower band at 46.91. Closing outside the band on a single expansion candle signals genuine strength. It also signals statistical stretch. Historically, such moves either consolidate sideways to let the bands catch up, or they snap back toward the breakout area.
Daily pivots frame the battleground clearly. The pivot point sits at 66.32, with R1 at 74.60 and S1 at 61.31. Price is trading above the pivot, keeping control with buyers. Therefore, the first real test of this move is whether 66.32 holds as support on the first pullback.
The 1H chart confirms strength but flashes exhaustion
The hourly chart on QNT reinforces the daily breakout but simultaneously warns of short-term exhaustion. Price sits far above all three hourly moving averages in a clean uptrend. Yet momentum readings are deep into overbought territory.
Overbought conditions and rejection near the highs
The hourly structure supports the daily message. EMA20 at 60.49 is above both the EMA50 at 58.25 and the EMA200 at 58.88, and price sits far above all three. Hourly MACD reinforces the uptrend, with the line at 2.39 above the signal at 0.73 and a histogram of 1.66.
However, hourly RSI at 78.19 is deep into overbought territory. Combined with a close above the upper hourly Bollinger band at 68.87, the picture is one of a market running hot. It is not building a base. The hourly ATR of 2.23 also tells you something useful. Ranges have expanded sharply, so any pullback will feel larger than it actually is in structural terms.
The last hourly candle deserves attention. It opened at 70.77, tagged 70.93, dipped to 69.15 and closed at 69.58. That is a rejection near the highs and a close below the open. At the same time, hourly volume of 2,688 shows participation is still present. Buyers are not gone, but the first sellers have appeared.
The hourly pivot set is tight: pivot at 69.89, R1 at 70.62, S1 at 68.84. Price closed just below the pivot. In practical terms, 69.89 is the immediate line separating continuation from a short-term stall.
15m: execution context, not direction
The 15-minute chart on Quantinuum Inc. stock shows textbook trend-day behavior that is now cooling internally. Moving averages are stacked in perfect bullish order, but momentum indicators are peaking across the board.
The intraday chart is the most bullish of the three, and it is also the least durable. EMA20 at 64.30, EMA50 at 60.52 and EMA200 at 57.46 are stacked in perfect order, and the regime reads bullish. Price remains far above all of them — classic trend-day behaviour.
Yet the internals are cooling. The 15m MACD line at 3.68 sits above its signal at 3.00, but the histogram has narrowed to 0.69. RSI at 77.90 mirrors the hourly overbought condition. The upper 15m band is up at 74.73 against a mid band of 62.71, so there is technically room higher. However, the ATR of 2.11 warns that entries chasing strength carry wide adverse excursion. This timeframe is useful for timing, nothing more.
The bullish scenario
The bullish case for Quantinuum Inc. stock hinges on consolidation above the daily pivot at 66.32 without a deep retracement. Successful defense of that level would give the breakout credibility and set up a run toward daily R1 at 74.60.
The constructive case rests on the fundamental catalyst holding the bid. If Quantinuum Inc. stock consolidates above the daily pivot at 66.32, the breakout gains credibility. Bulls would want to see the daily MACD line cross above zero. That would upgrade the signal from a bearish-momentum unwind to a genuine bullish crossover. The obvious upside reference is the daily R1 at 74.60, sitting just under the 15m upper band at 74.73.
Reclaiming the hourly pivot at 69.89 and then clearing 70.93 would be the first tell. Continued follow-through volume would keep the daily EMAs curling up beneath price. This needs to happen in the context of the Oracle Helios deployment and 2026 guidance of $28M–$32M.
The bearish scenario
The bearish path for QNT does not require negative news. It only needs the post-earnings buying impulse to exhaust itself. The daily close sits more than five points above the upper Bollinger band at 64.65. Mean reversion becomes the path of least resistance if momentum stalls.
A break below the hourly S1 at 68.84 would be the first warning. Loss of the daily pivot at 66.32 would then put daily S1 at 61.31 back in play. That zone matters, because 61.31 sits directly on the cluster formed by the EMA200 at 61.02 and the EMA50 at 60.63. A decisive close back below those averages would invalidate the bullish case. It would reframe this session as an earnings spike inside a broader range. In contrast, holding that cluster on a retest would be a textbook higher-low for the new structure.
The conflict across timeframes
The clearest conflict across timeframes is this. The daily says the trend change is early and unconfirmed. Meanwhile, the hourly and 15m say the move is already stretched. Both can be true at once. That combination typically produces a sideways digestion phase rather than an immediate second leg.
Overall, the technical evidence on Quantinuum Inc. stock points to a market that has genuinely improved its structure. Yet it is running well ahead of itself in the short term. Volatility is the dominant variable now, with a daily ATR of 5.40 against a stock that just moved 13 points in a session. Position sizing built for pre-earnings ranges no longer fits this chart. Until 66.32 is defended or lost, the honest assessment is that the signals are mixed. The burden of proof sits with the next two or three daily closes.
FAQ
What drove Quantinuum Inc. stock higher?
Quantinuum jumped 9% after its Q2 report, driven by a revenue beat, strong bookings, and the Oracle Helios deployment on OCI. Management also guided 2026 revenue to $28M–$32M and flagged a 279% revenue surge in its first earnings call since the IPO debut.
Is QNT overbought after the earnings breakout?
The picture is mixed across timeframes. Daily RSI at 62.12 still has room above, but hourly RSI at 78.19 is deep into overbought territory. The close above the upper daily Bollinger band at 64.65 also signals statistical stretch that historically leads to consolidation or a snapback.
What are the key levels to watch for Quantinuum Inc. stock?
The daily pivot at 66.32 is the first critical support test. Above, daily R1 at 74.60 serves as the nearest upside reference. Below, daily S1 at 61.31 aligns with the cluster formed by the EMA200 at 61.02 and the EMA50 at 60.63 — a decisive close below those averages would invalidate the bullish breakout.
Can Quantinuum Inc. stock sustain the post-earnings momentum?
The daily MACD line at -0.79 remains below zero despite crossing above its signal. Until the MACD line crosses into positive territory, the move is technically a bearish-momentum unwind rather than a confirmed bullish phase. The next two or three daily closes around the 66.32 pivot will determine whether the breakout holds or mean reversion takes over.
Disclaimer: This article is for informational purposes only and does not constitute financial advice, an investment recommendation, or a solicitation to buy or sell any financial instrument or cryptocurrency. The analysis provided is not indicative of future results. Investing in crypto assets and financial markets carries a high risk of capital loss. Always do your own research (DYOR) and consult a qualified financial advisor before making any decision.
Article produced with the assistance of artificial intelligence and reviewed by the editorial team.
