



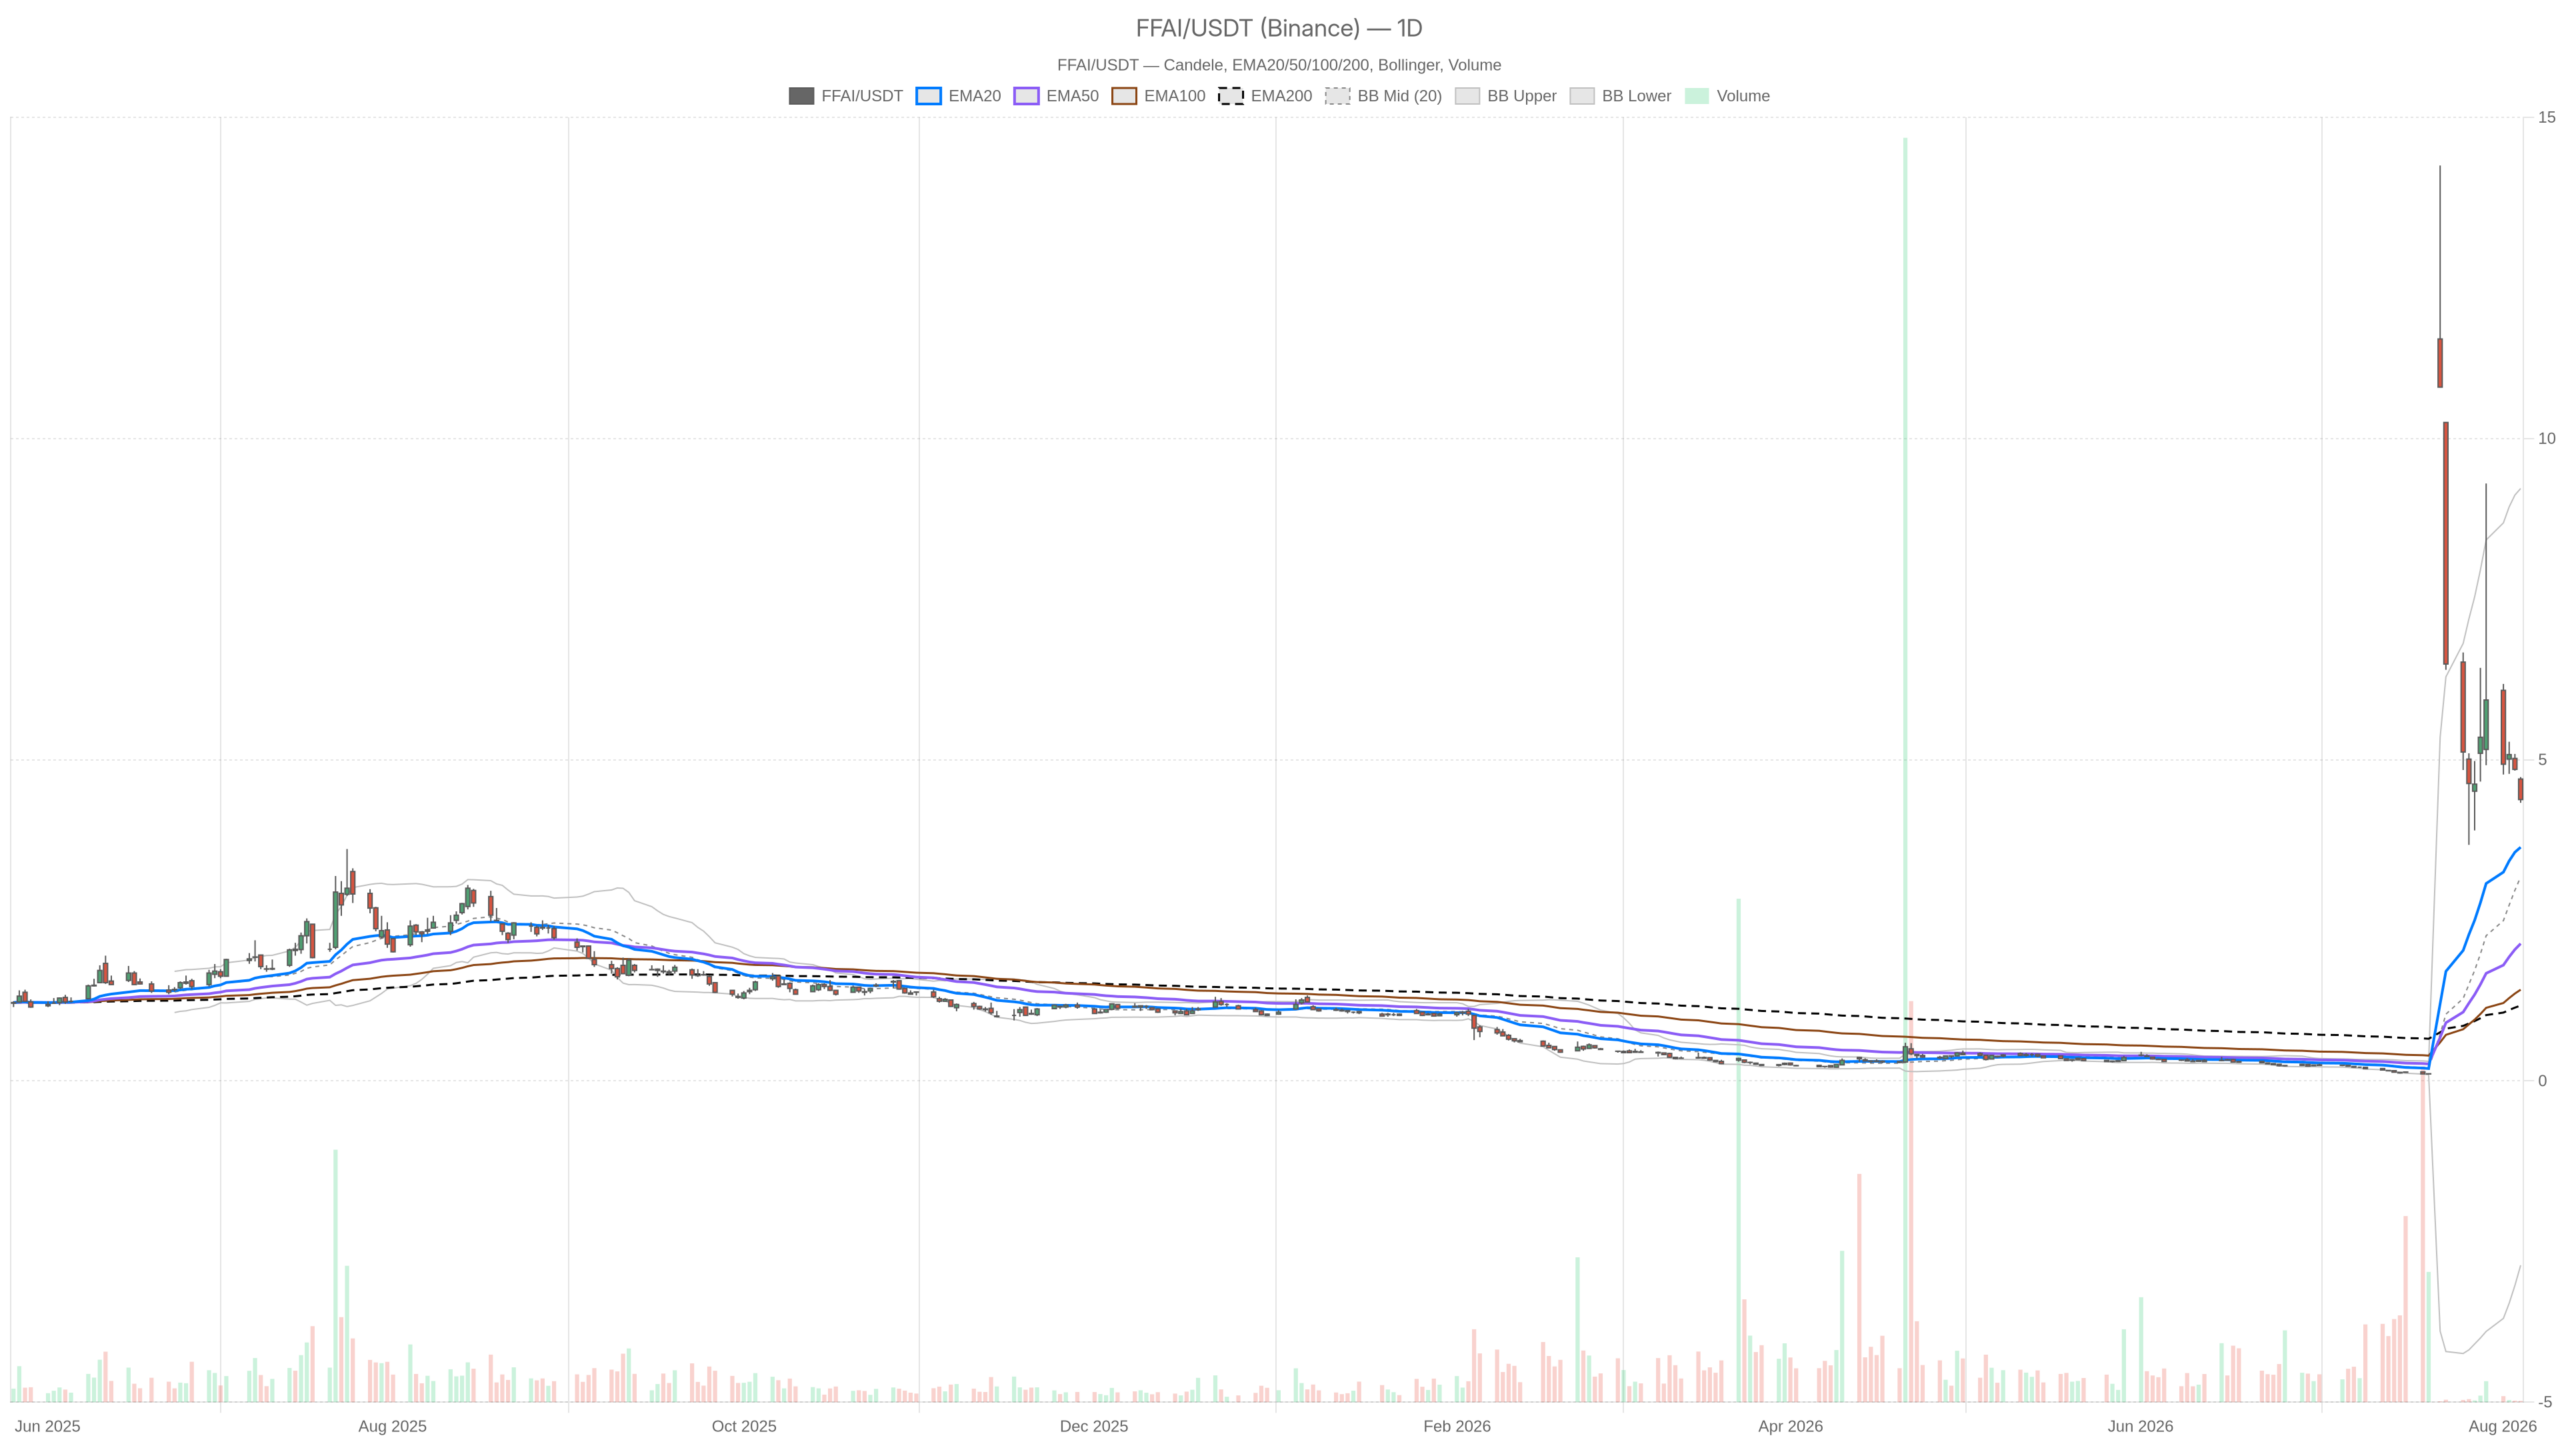
Faraday Future Stock closed at $4.38, well off its $4.73 session high and just five cents above the low. The daily trend remains firmly bullish. Yet intraday momentum has turned defensive. The honest read: a bullish primary bias under short-term pressure—not a signal to chase.
Summary
Key takeaways
- Faraday Future Stock closed at $4.38, above all key daily moving averages (EMA20 at $3.64, EMA50 at $2.14, EMA200 at $1.17).
- Daily RSI at 56.17 and MACD histogram at 0.03 suggest bullish momentum is flattening rather than accelerating.
- The hourly chart shows a bearish regime with price below EMA20 ($4.76) and RSI at 36.4.
- Daily ATR at $2.27 means the average daily range exceeds half the share price, demanding careful position sizing.
- The critical battleground sits between $4.30 and $4.48; a break in either direction will likely set the next directional move.
Why the Daily Chart Still Favours the Bulls
The daily moving averages confirm the bullish trend with price above EMA20, EMA50, and EMA200 in perfect ascending order. EMA20 sits at $3.64, EMA50 at $2.14 and EMA200 at $1.17. That stack, with price above all three, is textbook trend confirmation. The distance between them reveals just how violent the advance has been.
At $4.38, FFAI trades roughly four times its own 200-day average. Trends like this rarely resolve quietly. They either consolidate for an extended period or unwind fast. The daily volatility profile argues the second outcome is live.
Momentum, however, is far less aggressive than the trend. Daily RSI at 56.17 sits only modestly above the midline. This is despite price trading multiples above its long-term average. The gap between price extension and momentum strength signals a move that has already spent much of its energy.
The daily MACD tells a similar story. The line at 1.21 remains above its 1.19 signal, so the cross is still positive. However, the histogram has compressed to just 0.03. The bullish impulse is intact by definition but appears exhausted in practice. Momentum is flattening, not yet reversing.
Volatility Is the Real Risk Factor
Daily ATR at $2.27 is the single most important number on this chart, representing an average range greater than half the share price. Against a $4.38 close, that ATR level means normal equity position-sizing rules simply do not apply here.
The Bollinger Bands reinforce this: the daily midline sits at $3.18 with the upper band at $9.22. The lower band is mathematically negative. Bands that wide measure disorderly trading levels, not signals. Price currently sits above the midline but well below the upper band, placing FFAI in the middle of an enormous statistical envelope.
Meanwhile, daily pivots frame the immediate battleground more usefully. The pivot point stands at $4.48, with R1 at $4.63 and S1 at $4.23. The close below the pivot provides the first concrete evidence that short-term control has shifted.
The 1H Chart Weakens the Bullish Case
The hourly timeframe has flipped to a bearish regime, with price below all key moving averages and RSI confirming persistent selling pressure. Price at $4.37 sits below EMA20 at $4.76 and EMA50 at $5.73. The hourly EMA200 at $17.11 serves as a reminder of how far FFAI has fallen from earlier, much higher trading zones.
Hourly RSI at 36.4 confirms the drift. It is weak but not yet washed out. This typically means sellers still have room before exhaustion sets in. The hourly MACD is negative at -0.25 against a -0.24 signal. Downside momentum is mild but persistent.
Notably, price is pinned near the lower hourly Bollinger band at $4.30, with the midline at $4.79. That midline is now the first credible reclaim level for buyers. Hourly ATR of $0.16 also reveals something practical: intraday swings have cooled dramatically compared with the daily average range. This suggests a distribution or digestion phase rather than a panic.
15m Execution Context for Faraday Future Stock
The 15-minute chart confirms the short-term bearish structure while hinting at a possible stabilisation attempt near the lower Bollinger band. EMA20 at $4.48, EMA50 at $4.65 and EMA200 at $5.59 all sit above price. RSI at 37.15 mirrors the hourly reading. Still, there is one small crack in the selling. The 15m MACD histogram has turned marginally positive at 0.01, with the line at -0.07 above the -0.08 signal. Price is also sitting exactly on the lower 15m band at $4.36. That combination often marks a stabilisation attempt, not a trend change.
For execution purposes, 15m pivots matter: pivot at $4.40, R1 at $4.44, S1 at $4.33. With ATR at just $0.08 on this timeframe, the near-term range is tight and mechanical.
Bullish Scenario
The constructive path requires buyers to reclaim ground quickly, starting with the 15m pivot at $4.40. A push above that level and then through $4.44 would be the first step. Above that, the daily pivot at $4.48 re-establishes daily control, with R1 at $4.63 as the next objective.
Confirmation would come from the hourly chart. Reclaiming EMA20 at $4.76 and pressing toward the hourly Bollinger midline at $4.79 would neutralise the bearish intraday regime. In that case, the daily uptrend and its rising EMA20 at $3.64 would remain the dominant framework. The pullback would then be treated as routine within an extended advance.
Bearish Scenario
Failure here is easy to define. A sustained break below daily S1 at $4.23 would invalidate the near-term bullish argument. It would confirm the hourly downtrend is dictating terms. The immediate warning sign would be a loss of $4.33 and $4.30 on the intraday charts.
What makes the downside dangerous is the volatility profile, not the momentum readings. With daily ATR at $2.27, a directional break does not need much time to travel a long distance. The daily Bollinger midline at $3.18 and daily EMA20 at $3.64 become the realistic downside reference points if selling accelerates.
Meanwhile, a daily MACD cross below its signal line would provide the cleanest evidence that the primary trend is genuinely rolling over. With the histogram already at 0.03, that outcome is closer than the headline trend structure implies.
Positioning and Uncertainty
The signals are mixed by timeframe, with the daily bullish regime and the hourly bearish regime pulling against each other around the $4.30–$4.48 zone. Volatility, not direction, is the dominant variable in Faraday Future Stock right now.
Until price resolves that band, however, conviction on either side is thin. An average daily range greater than half the share price means the same technical levels carry very different risk than they would in a normal name.
Overall, traders watching the FFAI chart are effectively working with two markets at once: a strong medium-term trend and a weakening short-term one. Respecting both, rather than choosing one, is what the current data supports.
FAQ
Is Faraday Future Stock still in a daily uptrend?
Yes. Price at $4.38 remains above EMA20 ($3.64), EMA50 ($2.14), and EMA200 ($1.17), with all three in ascending order—a textbook bullish trend structure.
Why are the intraday charts bearish despite the daily uptrend?
On the 1H chart, price sits below EMA20 ($4.76) and EMA50 ($5.73), with RSI at 36.4. The 15m chart mirrors this weakness. Short-term momentum has shifted defensive even as the daily structure holds.
What is the key level to watch for a bullish recovery?
Buyers need to reclaim the 15m pivot at $4.40, then the daily pivot at $4.48. A push above the hourly EMA20 at $4.76 and the hourly Bollinger midline at $4.79 would neutralise the intraday bearish regime.
How significant is the daily ATR of $2.27?
It is extremely significant. At a $4.38 close, the average daily range exceeds half the share price. This level of volatility means position sizing must be far more conservative than for a typical equity.
Disclaimer: This article is for informational purposes only and does not constitute financial advice, an investment recommendation, or a solicitation to buy or sell any financial instrument or cryptocurrency. The analysis provided is not indicative of future results. Investing in crypto assets and financial markets carries a high risk of capital loss. Always do your own research (DYOR) and consult a qualified financial advisor before making any decision.
Article produced with the assistance of artificial intelligence and reviewed by the editorial team.
