




Advanced Micro Devices, Inc. stock closed at $526 on August 4, 2026, sharply above its $508.12 open following a volatile Q2 earnings reaction. AMD found buyers quickly amid a broader chip-sector rally, creating a compelling mix of strong fundamentals and a choppy technical picture.
Summary
Key takeaways
- AMD stock closed at $526, well above its $508.12 open, after a volatile post-earnings session.
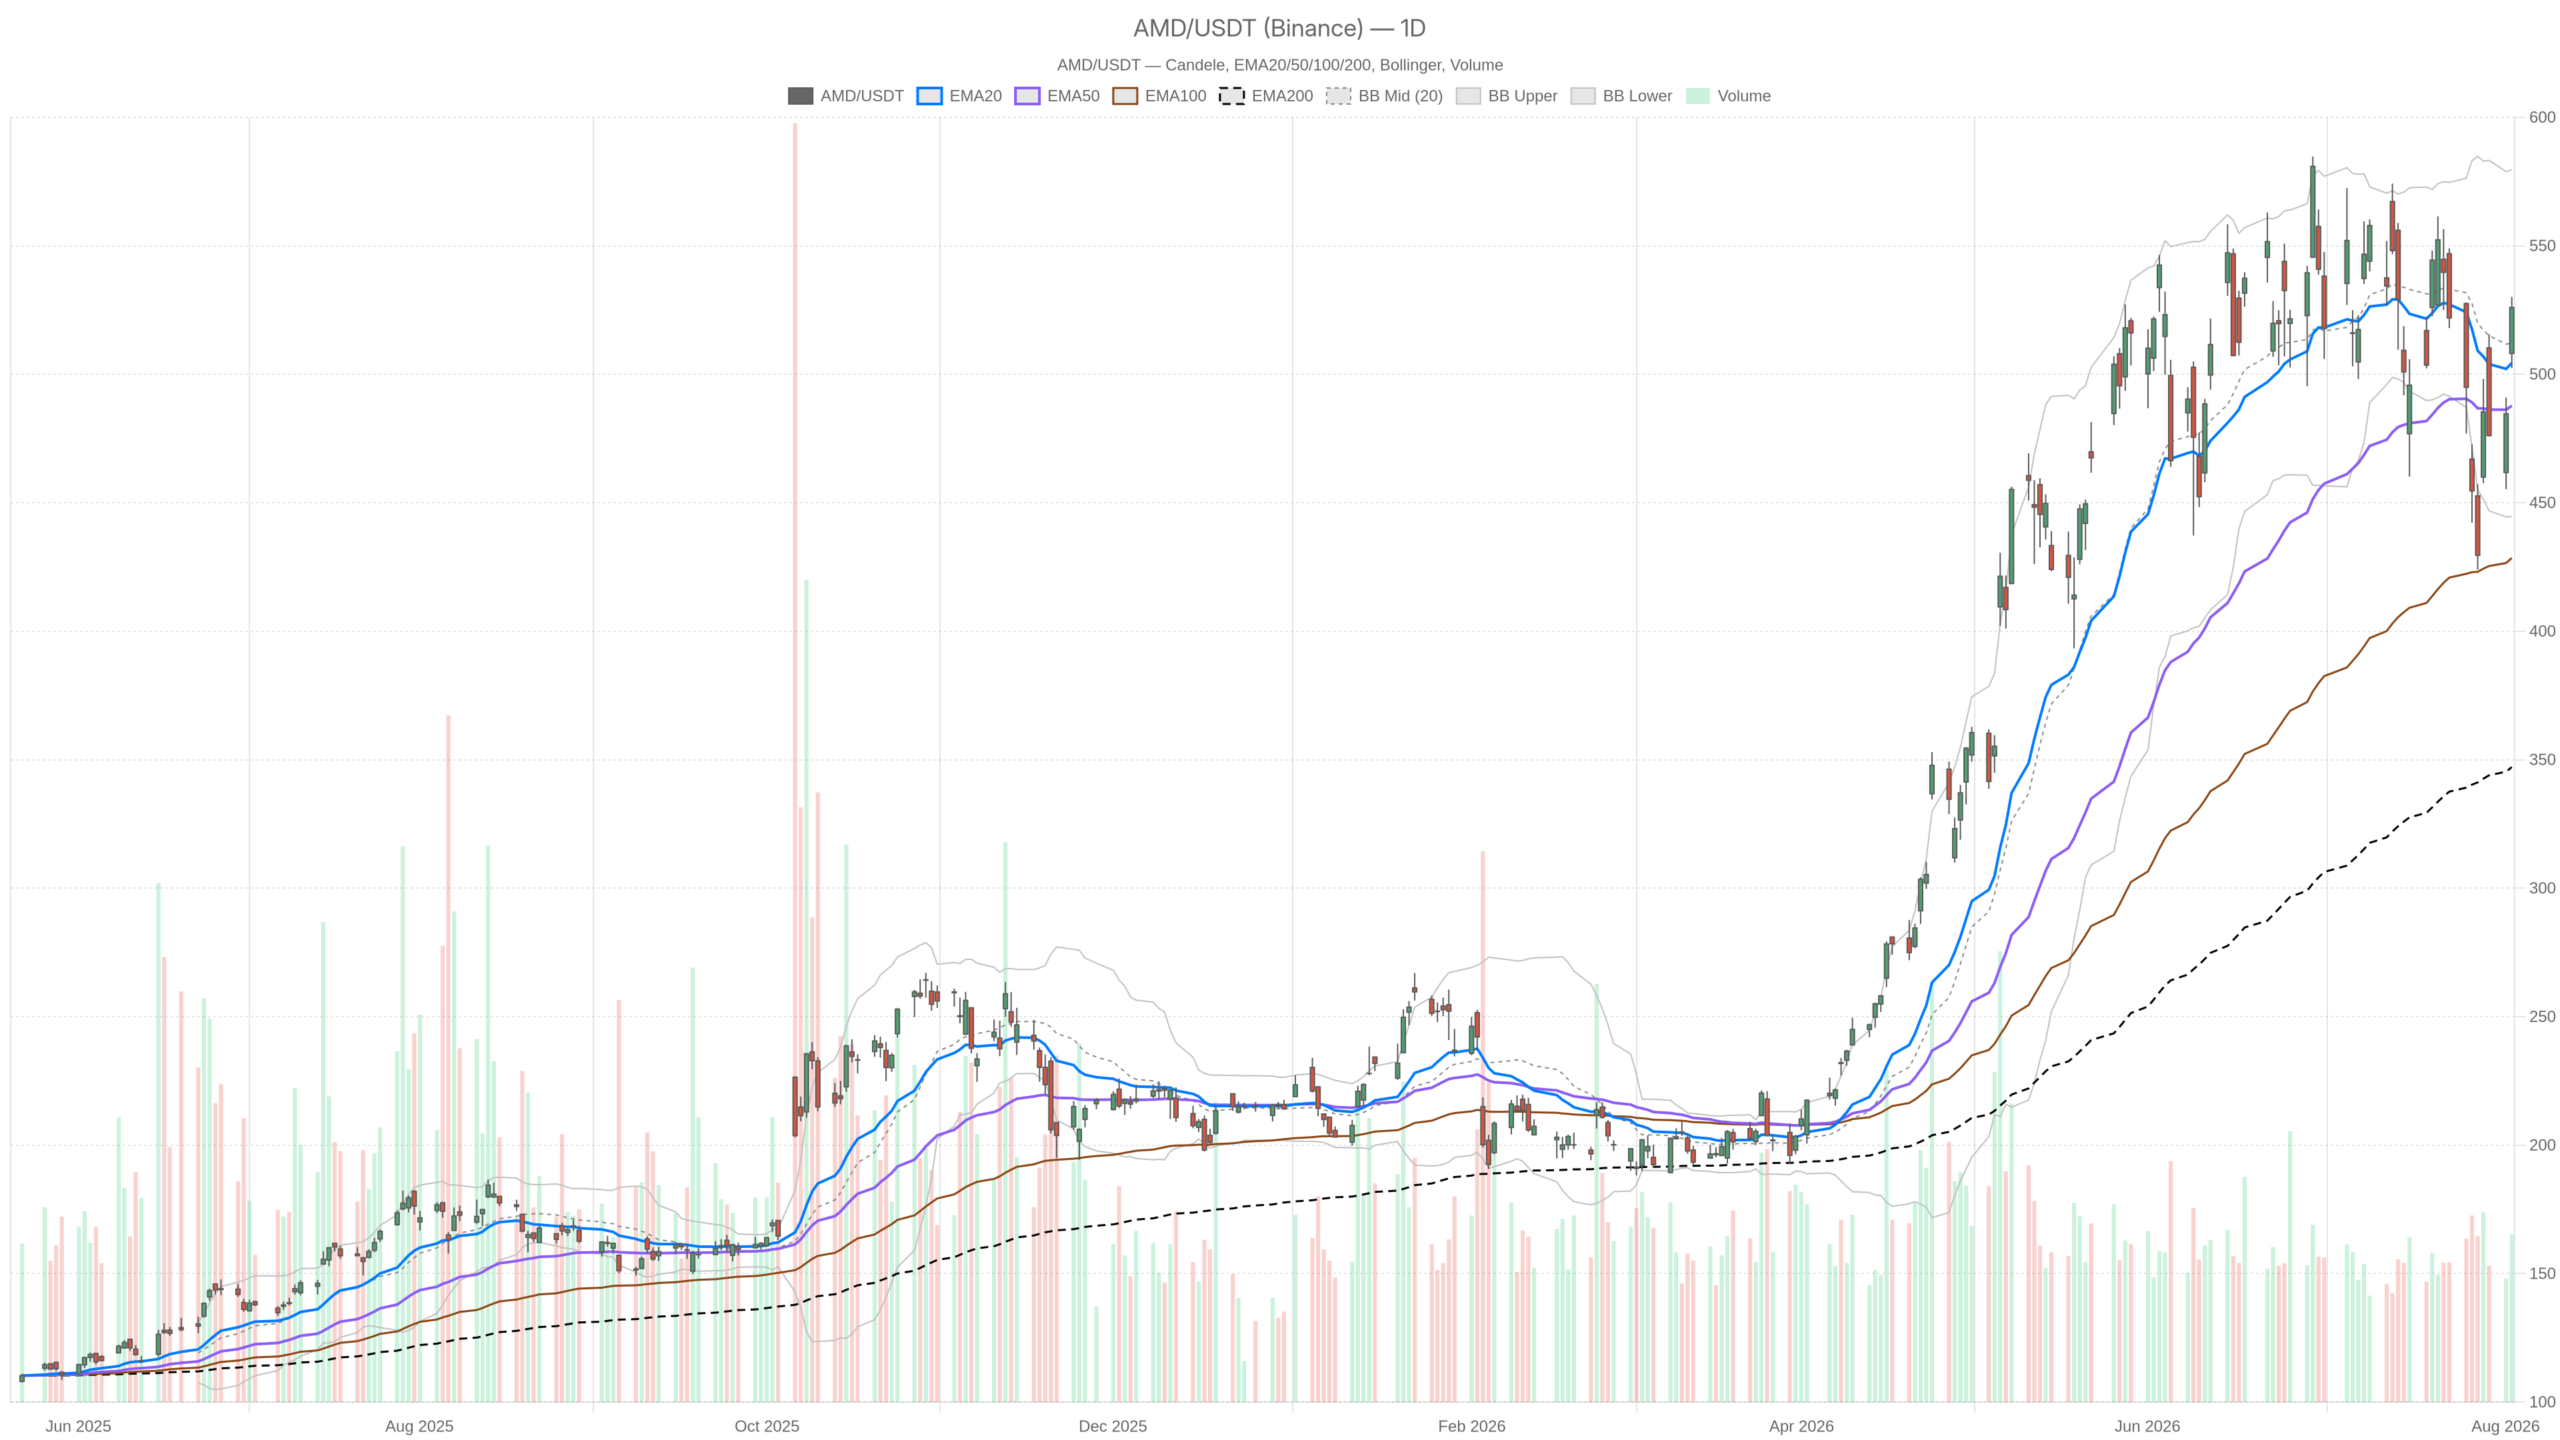
- The daily trend structure remains bullish with price above the EMA20 at 504.39, EMA50 at 487.77, and EMA200 at 347.14.
- Daily MACD shows a bearish momentum divergence at -7.01, below the signal line at -3.91, while price trades near recent highs.
- The 1-hour RSI14 has reached overbought territory at 70.94, even as the regime is classified as neutral.
- Daily ATR of 41.3 confirms outsized volatility, with the pivot zone between 519.51 and 536.62 framing the near-term battle.
Advanced Micro Devices, Inc. Stock: Daily Structure vs Momentum Divergence
The daily trend structure for Advanced Micro Devices, Inc. stock remains firmly bullish, but momentum indicators are flashing a warning that bears close watching. On the daily chart, price is trading above the EMA20 at 504.39, the EMA50 at 487.77, and the EMA200 at 347.14. That stacked structure reflects a long, established uptrend rather than a short-term bounce. The daily regime reading is labeled bullish. Price action around the $508–$530 range confirms buyers remain in control of the broader trend.
However, momentum on the daily timeframe is not fully aligned with price. The MACD line sits at -7.01, below the signal line at -3.91, with a histogram of -3.1. That is a bearish momentum signature showing up while price trades near recent highs. In practice, this kind of divergence often signals a rally driven more by news-flow and volume spikes than by sustained trend acceleration. It does not invalidate the uptrend, but it does suggest the move is stretched relative to underlying momentum.
Meanwhile, RSI14 on the daily chart stands at 53.4, a neutral reading that leaves room in either direction. The Bollinger setup shows price at $526 has already cleared the mid-band near 512.18. The upper band sits far above at 579.65. There is technical room to extend higher, but the wide band width also reflects elevated volatility. That reading is confirmed by an ATR14 of 41.3. Swings in AMD stock are currently oversized relative to typical conditions.
Daily pivot levels frame the near-term battle. The pivot point sits at 519.51, with resistance at 536.62 and support at 508.9. Price closing at $526 puts it comfortably above the pivot. That is constructive, but still short of the r1 resistance that would confirm a fresh leg higher.
1H Timeframe: Overbought Momentum Complicates the Picture
The 1-hour chart shows aggressive bullish momentum that has pushed RSI into overbought territory, complicating the near-term outlook for AMD stock. RSI14 has climbed to 70.94, deep into overbought territory. At the same time, the MACD line at 12.57 sits well above its signal at 8.46, with a positive histogram of 4.11. That is aggressive bullish momentum, the kind that typically accompanies a sharp intraday rally rather than a controlled grind higher.
Interestingly, the system classifies the 1H regime as neutral despite these bullish readings. That is not a contradiction so much as a caution flag. Price at $526 is trading above all three EMAs on this timeframe. The EMA20 sits at 503, EMA50 at 495.68, and EMA200 at 511.26. The trend structure is bullish. However, the overbought RSI combined with a neutral regime label points to a market that has moved fast. It may be due for consolidation before continuing.
At the same time, the 1H Bollinger bands show price at $526 pushing toward the upper band at 536.95. The mid-band at 497.93 sits well below current levels. Volatility on this timeframe, measured by an ATR14 of 9.08, is elevated but proportionate to the size of the intraday move. Pivot levels reinforce the same tension. The 1H pivot sits at 524.4, resistance at 530.2, and support at 520.2. Price is right at the pivot, with resistance close overhead.
15-Minute Execution Context
The 15-minute timeframe reveals early signs of short-term fatigue within an otherwise intact bullish structure for AMD stock. Zooming into the 15-minute chart, the regime reads bullish. Price at $526 remains above the EMA20 at 522.3, EMA50 at 509.25, and EMA200 at 495.12. That short-term EMA stack still favors buyers. However, the MACD line at 6.45 has slipped below its signal at 7.77, producing a negative histogram of -1.32. That is an early bearish crossover on the fastest timeframe, hinting at a possible short-term pause.
Meanwhile, RSI14 at 67.46 is elevated but not yet extreme. The 15-minute Bollinger bands are notably tight. Price at $526 sits near the mid-band at 524.96, with the upper band at 530.46 and lower band at 519.46. That compression, combined with an ATR14 of just 2.97, suggests the market is coiling near resistance. It is not breaking out decisively in either direction at this exact moment.
Bullish Scenario
The bullish case for Advanced Micro Devices, Inc. stock hinges on the daily uptrend absorbing short-term overbought conditions without a meaningful breakdown. A clean move above the daily r1 at 536.62, supported by renewed volume, would confirm buyers are still in charge. The fundamental backdrop supports this view. AMD’s Data Center unit revenue reportedly doubled, up 107% year-over-year, and overall revenue climbed 50%. That kind of growth gives bulls a narrative to lean on beyond the charts. Commentary from Microsoft CEO Satya Nadella, described as positive for AMD investors, reinforces this view.
At the same time, if chip stocks continue their broader risk-on rally alongside peers like Intel and Broadcom, AMD stock could extend its advance. The next target would be the upper Bollinger band near 579.65 on the daily chart.
Bearish Scenario
In contrast, the bearish risk centers on the daily MACD divergence resolving through price rather than through momentum catching up. If AMD stock fails to clear the resistance cluster at 530.2–536.62 and instead rolls over, the first test would come at the daily pivot near 519.51. Below that, support sits at 508.9. A break below that level would put recent gains at risk. It would validate the idea that the rally was driven more by earnings headlines and sector rotation than by sustainable trend strength.
The overbought 1H RSI at 70.94 adds near-term weight to this scenario. So does the fading 15-minute MACD histogram, if buyers fail to defend current levels quickly.
AMD Stock at a Crossroads
Advanced Micro Devices, Inc. stock sits at an interesting crossroads where strong fundamentals and an established uptrend collide with stretched short-term momentum. The daily trend remains bullish by structure. However, daily momentum is lagging price, and the 1-hour chart is overbought even as its regime reads neutral. In contrast, the 15-minute timeframe shows early signs of short-term fatigue within an otherwise bullish setup.
Meanwhile, volatility is elevated across all three timeframes, and the wide daily ATR confirms that swings in AMD price are currently outsized. Given the conflicting signals between strong fundamentals, an established uptrend, and stretched short-term momentum, positioning calls for caution. The concern is more about timing than direction. The next few sessions should clarify the picture. How price behaves around the 519–537 zone will determine whether this is a pause within a larger uptrend or the start of a deeper pullback.
FAQ
What is the current trend for Advanced Micro Devices, Inc. stock?
The daily trend is firmly bullish. Price trades above the EMA20 at 504.39, EMA50 at 487.77, and EMA200 at 347.14, and the daily regime is labeled bullish. This stacked EMA structure reflects a long, established uptrend rather than a short-term bounce.
Is AMD stock overbought right now?
On the 1-hour timeframe, RSI14 has reached 70.94, which is firmly in overbought territory. However, the daily RSI14 sits at a neutral 53.4, leaving room in either direction. The overbought condition is concentrated on shorter timeframes.
What are the key support and resistance levels for AMD stock?
The daily pivot sits at 519.51, with resistance at 536.62 and support at 508.9. On the 1-hour chart, the pivot is at 524.4, with resistance at 530.2 and support at 520.2. The 530.2–536.62 range forms a critical resistance cluster.
What fundamental factors support AMD’s stock price?
AMD’s Data Center unit revenue reportedly doubled, up 107% year-over-year, and overall revenue climbed 50%. Additionally, positive commentary from Microsoft CEO Satya Nadella has been described as supportive for AMD investors, giving bulls a fundamental narrative alongside the technical picture.
Disclaimer: This article is for informational purposes only and does not constitute financial advice, an investment recommendation, or a solicitation to buy or sell any financial instrument or cryptocurrency. The analysis provided is not indicative of future results. Investing in crypto assets and financial markets carries a high risk of capital loss. Always do your own research (DYOR) and consult a qualified financial advisor before making any decision.
Article produced with the assistance of artificial intelligence and reviewed by the editorial team.
