




Arista Networks, Inc. stock closed at $190.45 after a Q2 beat and raised guidance triggered a 13% single-session surge. The move builds on AI-driven data center networking demand and rising analyst optimism.
Summary
Key takeaways
- Arista Networks, Inc. stock surged 13% in a single session after beating Q2 estimates and raising full-year guidance.
- Daily RSI14 at 62.38 remains below overbought territory, leaving room for bullish continuation.
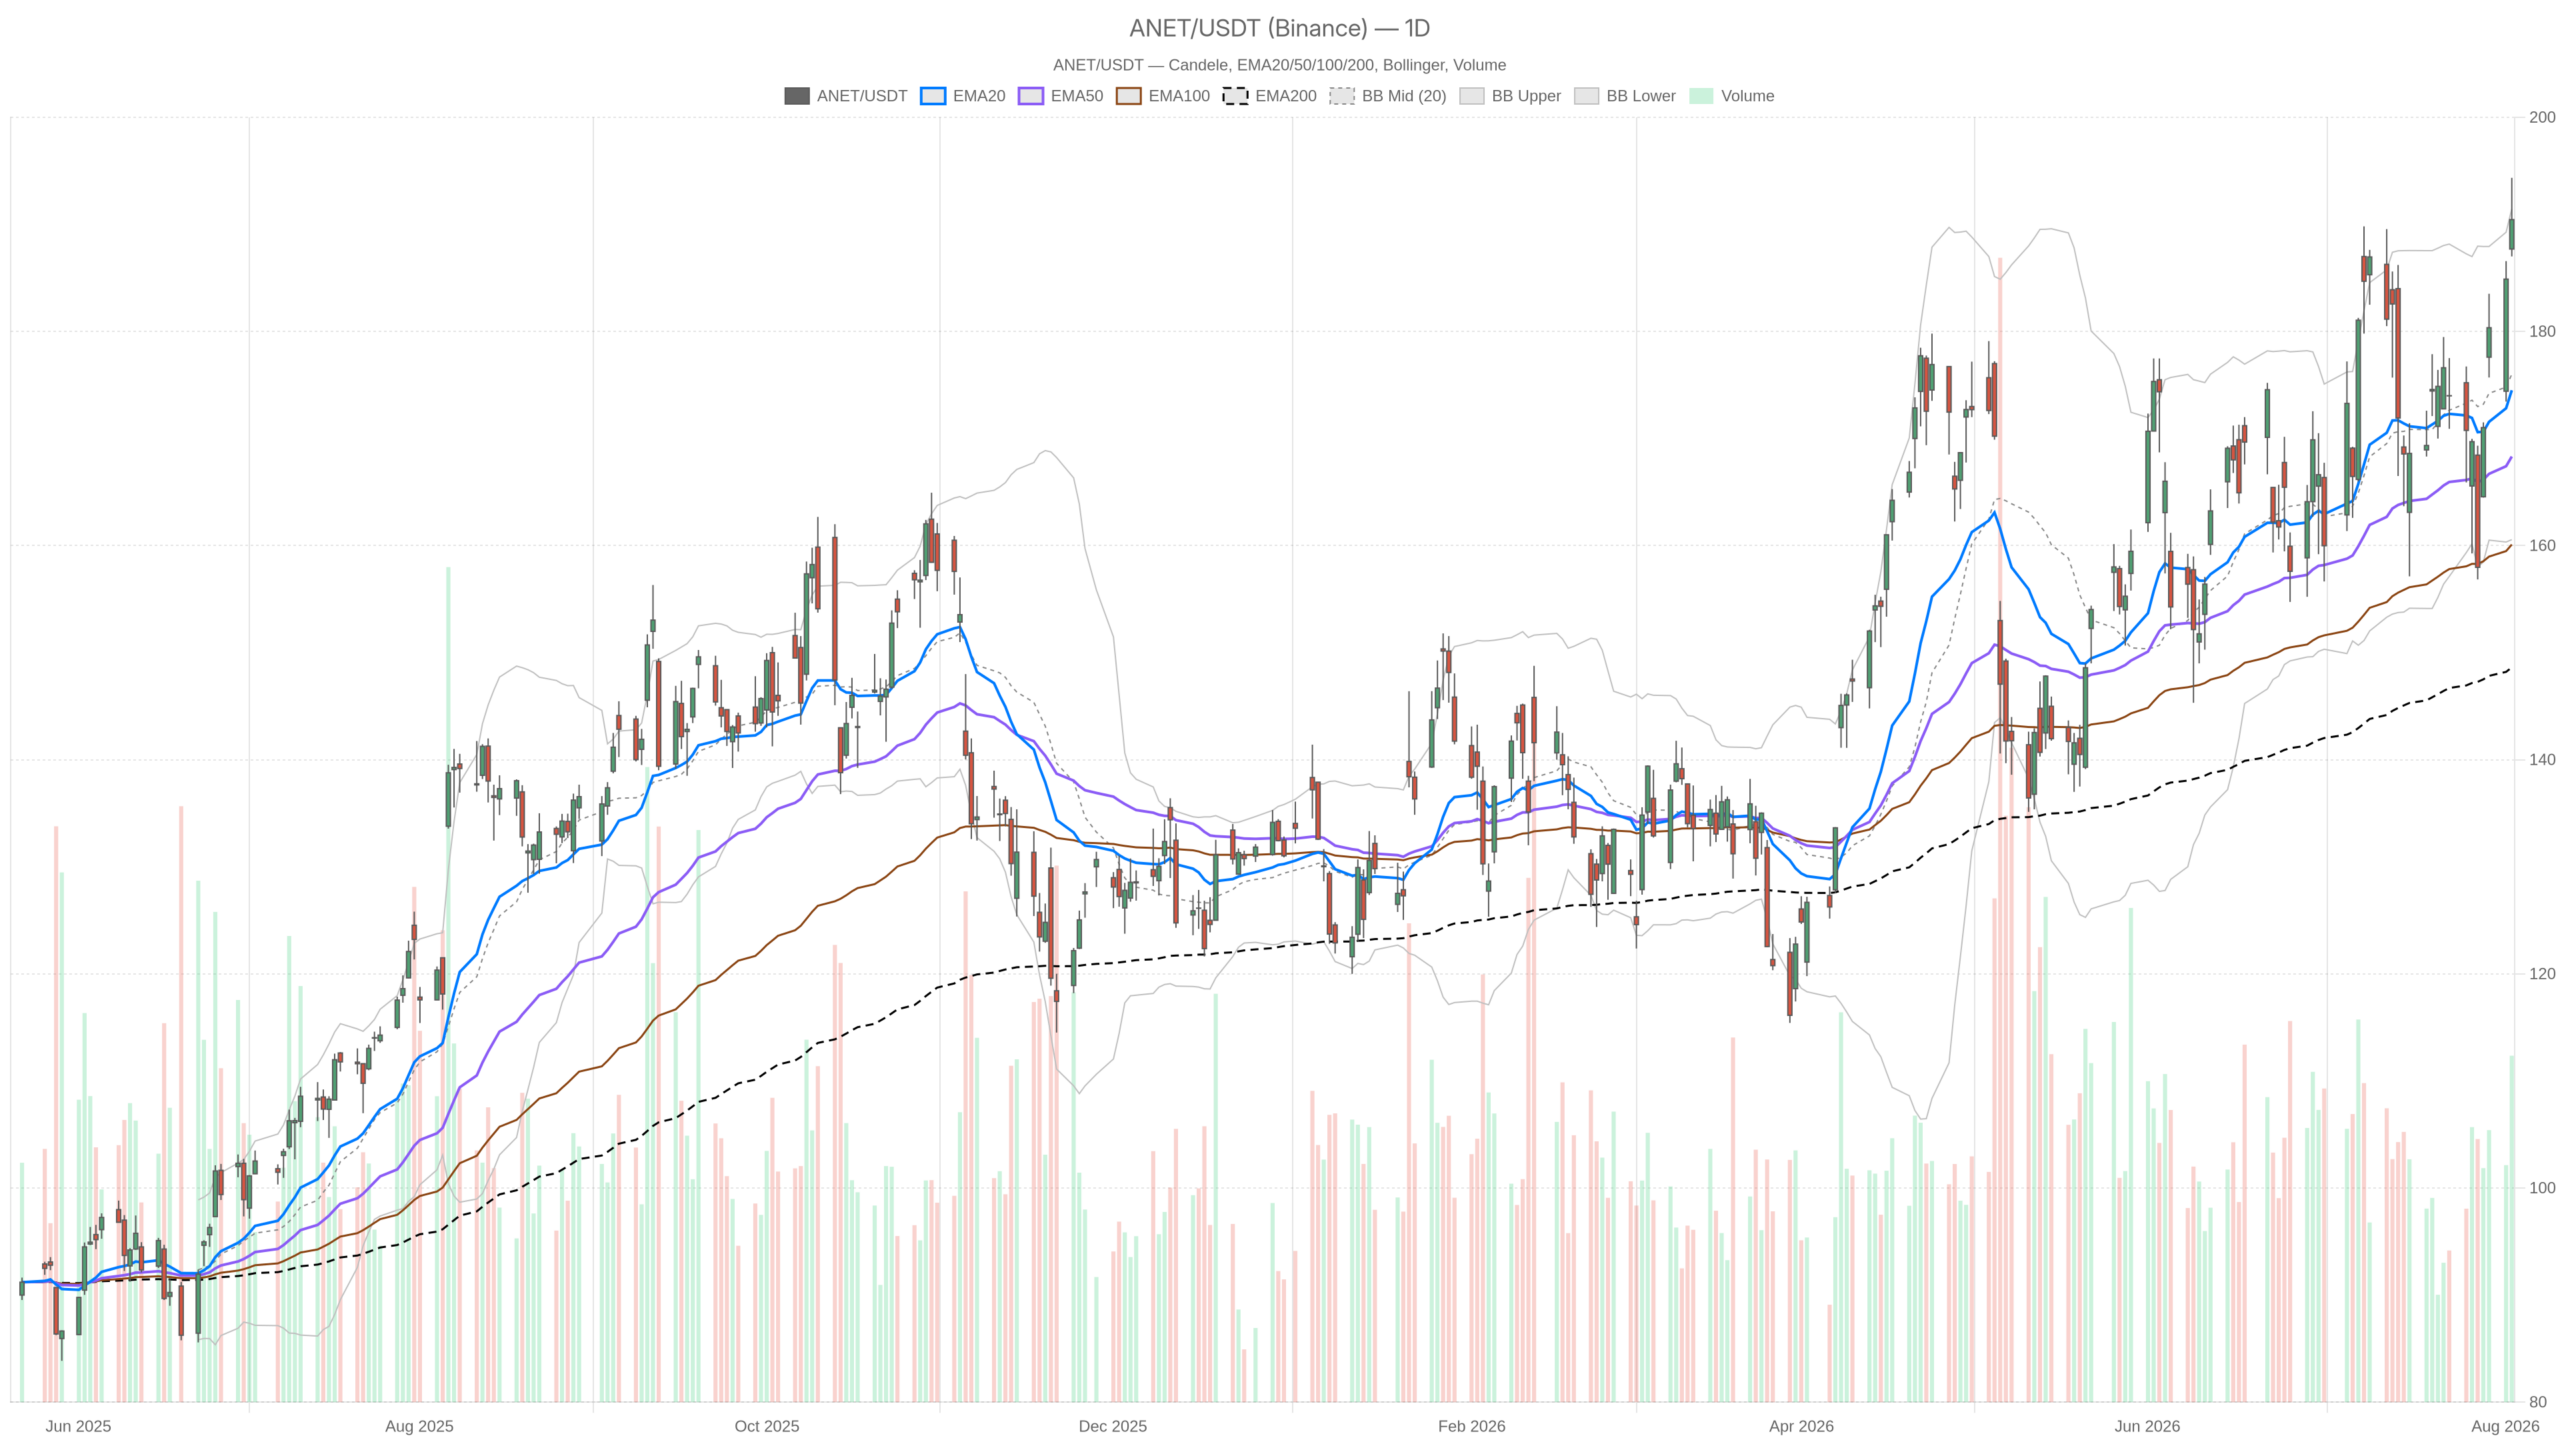
- The stock closed at $190.45, pressed against the daily upper Bollinger Band at $191.45.
- Hourly RSI14 at 67.8 signals near-term overbought conditions on the intraday timeframe.
- Key levels to watch: resistance at $194.20, pivot at $190.60, and support at $186.86.
The daily chart tells a clean bullish story. Price pushed to a high of $194.35 before settling at $190.45. It sits comfortably above the EMA20 at 174.51, the EMA50 at 168.32, and the EMA200 at 148.63. That stacked structure confirms the daily regime reading.
Daily Momentum Still Has Room, But Is Stretching
Daily momentum is bullish and not yet overbought. However, the stock is stretched against its volatility envelope, and near-term consolidation is possible.
RSI14 on the daily sits at 62.38, firmly in bullish territory without tipping into overbought extremes. MACD confirms this: the line at 3.36 sits above the signal at 2.25, with a positive histogram of 1.12. In plain terms, momentum is accelerating and buyers remain in control.
Bollinger Bands add useful context, however. The daily mid-band sits at 176, with the upper band at $191.45 and the lower band at 160.56. Friday’s close of $190.45 is pressed against that upper boundary. This reflects genuine strength. At the same time, it means the stock is stretched relative to its own recent volatility. The daily ATR14 of 9.92 underscores how volatile the name has become since earnings. Wide ATR readings typically mean bigger swings in both directions.
Meanwhile, daily pivot levels frame the immediate battlefield: pivot at $190.60, resistance at $194.20, and support at $186.86. The close landed almost exactly on the pivot. The next directional cue will likely come from whether price clears 194.20 or slips back toward 186.86.
1H Timeframe Confirms the Trend, With a Caveat
The hourly chart confirms the bullish trend, but RSI14 at 67.8 is nearing overbought and MACD momentum is decelerating at the margin.
EMA20 at 185.32, EMA50 at 178.78, and EMA200 at 173.57 are all stacked bullishly. The regime tag on this timeframe also reads bullish. However, RSI14 on the 1H has climbed to 67.8, meaningfully closer to overbought than the daily reading. This suggests the intraday rally has run further, proportionally, than the broader trend. It raises the odds of near-term consolidation even within a healthy uptrend.
MACD on the hourly chart still shows a bullish configuration. The line at 5.36 remains above the signal at 4.99. Still, the histogram has narrowed to just 0.37, down from wider separation implied by the spread. Momentum is decelerating slightly at the margin, even though direction remains up. Hourly Bollinger Bands, with the mid at 185.19 and the upper at 196.11, leave room above current price. Yet the RSI and shrinking histogram together hint that buyers may need to pause before the next push.
15-Minute Chart: Execution Context Turns Neutral
The 15-minute chart describes a short-term cooling phase after an explosive move, with a neutral regime tag, RSI at 46.64, and negative MACD. This does not contradict the broader bullish thesis.
RSI14 on this timeframe sits at 46.64, essentially neutral and well off the elevated readings on higher timeframes. MACD has flipped negative intraday: the line at 1.06 below the signal at 1.72, with a histogram of -0.65. Price has also slipped under its own 15-minute EMA20 of 191.66. It sits near the lower Bollinger band at 191.19 against an upper band of 194.46.
Notably, none of this contradicts the broader bullish picture. Rather, it describes exactly what you would expect following a 13% single-day surge: a pause, not a reversal. The conflict between timeframes is clear. The daily and hourly charts point higher. The 15-minute chart, in contrast, is flashing consolidation risk. Intraday traders should treat this as a timing concern rather than a trend change.
Bullish Scenario for Arista Networks, Inc. Stock
The bullish case rests on the daily trend’s strength and the AI-driven fundamental catalyst. A clean break above $194.20 would confirm continuation.
A hold above daily resistance at $194.20 would confirm continuation, especially with sustained volume. The narrative supports this. AI-driven data center networking demand and raised guidance anchor the fundamental case. The stock has gained 3,330% since 2015’s first major institutional inflow, according to recent coverage. If daily RSI stays below overbought extremes while price grinds higher, that would signal the rally still has fuel.
Bearish Scenario and What Would Invalidate the Bullish Case
The bearish warning comes from an overbought hourly RSI at 67.8 and a narrowing MACD histogram. A break below $186.86 would open the door to a deeper pullback.
On the other hand, if price fails to hold the daily pivot at $190.60 and breaks below support at $186.86, a deeper pullback toward the daily EMA20 near 174.51 becomes likely. The elevated daily ATR of 9.92 means such a move could develop quickly. A sustained negative MACD reading spreading from the 15-minute chart into the hourly timeframe would be the clearest signal that momentum is genuinely fading.
Closing Take
The technical and fundamental backdrop for Arista Networks, Inc. stock remains constructive on higher timeframes, but stretched hourly momentum and elevated volatility warrant caution around entry timing.
Overall, the earnings beat, raised guidance, and AI-driven demand anchor the bullish case. The daily trend structure supports this, with price well above all three key moving averages. However, the stretched hourly RSI and the neutral 15-minute picture argue for patience. Volatility remains elevated. The stock sits right on a key pivot. Positioning should account for short-term consolidation risk and the possibility that a break of support could trigger a sharper retracement than recent momentum suggests.
FAQ
Is Arista Networks, Inc. stock overbought after the earnings surge?
Not on the daily timeframe. Daily RSI14 sits at 62.38, which is firmly bullish but below the overbought threshold. However, hourly RSI14 at 67.8 is meaningfully closer to overbought, suggesting the intraday rally has stretched further than the broader trend.
What are the key support and resistance levels for ANET?
Daily resistance stands at $194.20, with the daily pivot at $190.60. Support sits at $186.86. A break below that level would open the door to a deeper pullback toward the daily EMA20 near 174.51.
What is driving Arista Networks, Inc. stock higher?
The primary catalyst is AI-driven data center networking demand. The company’s Q2 earnings beat and raised full-year guidance triggered the most recent 13% surge, which builds on weeks of rising analyst optimism and favorable estimate revisions.
Should traders be concerned about the neutral 15-minute chart?
Not necessarily. The neutral regime and negative MACD on the 15-minute chart reflect a normal cooling phase after an explosive 13% single-day move. It signals consolidation risk for intraday timing, not a trend reversal.
Disclaimer: This article is for informational purposes only and does not constitute financial advice, an investment recommendation, or a solicitation to buy or sell any financial instrument or cryptocurrency. The analysis provided is not indicative of future results. Investing in crypto assets and financial markets carries a high risk of capital loss. Always do your own research (DYOR) and consult a qualified financial advisor before making any decision.
Article produced with the assistance of artificial intelligence and reviewed by the editorial team.
