




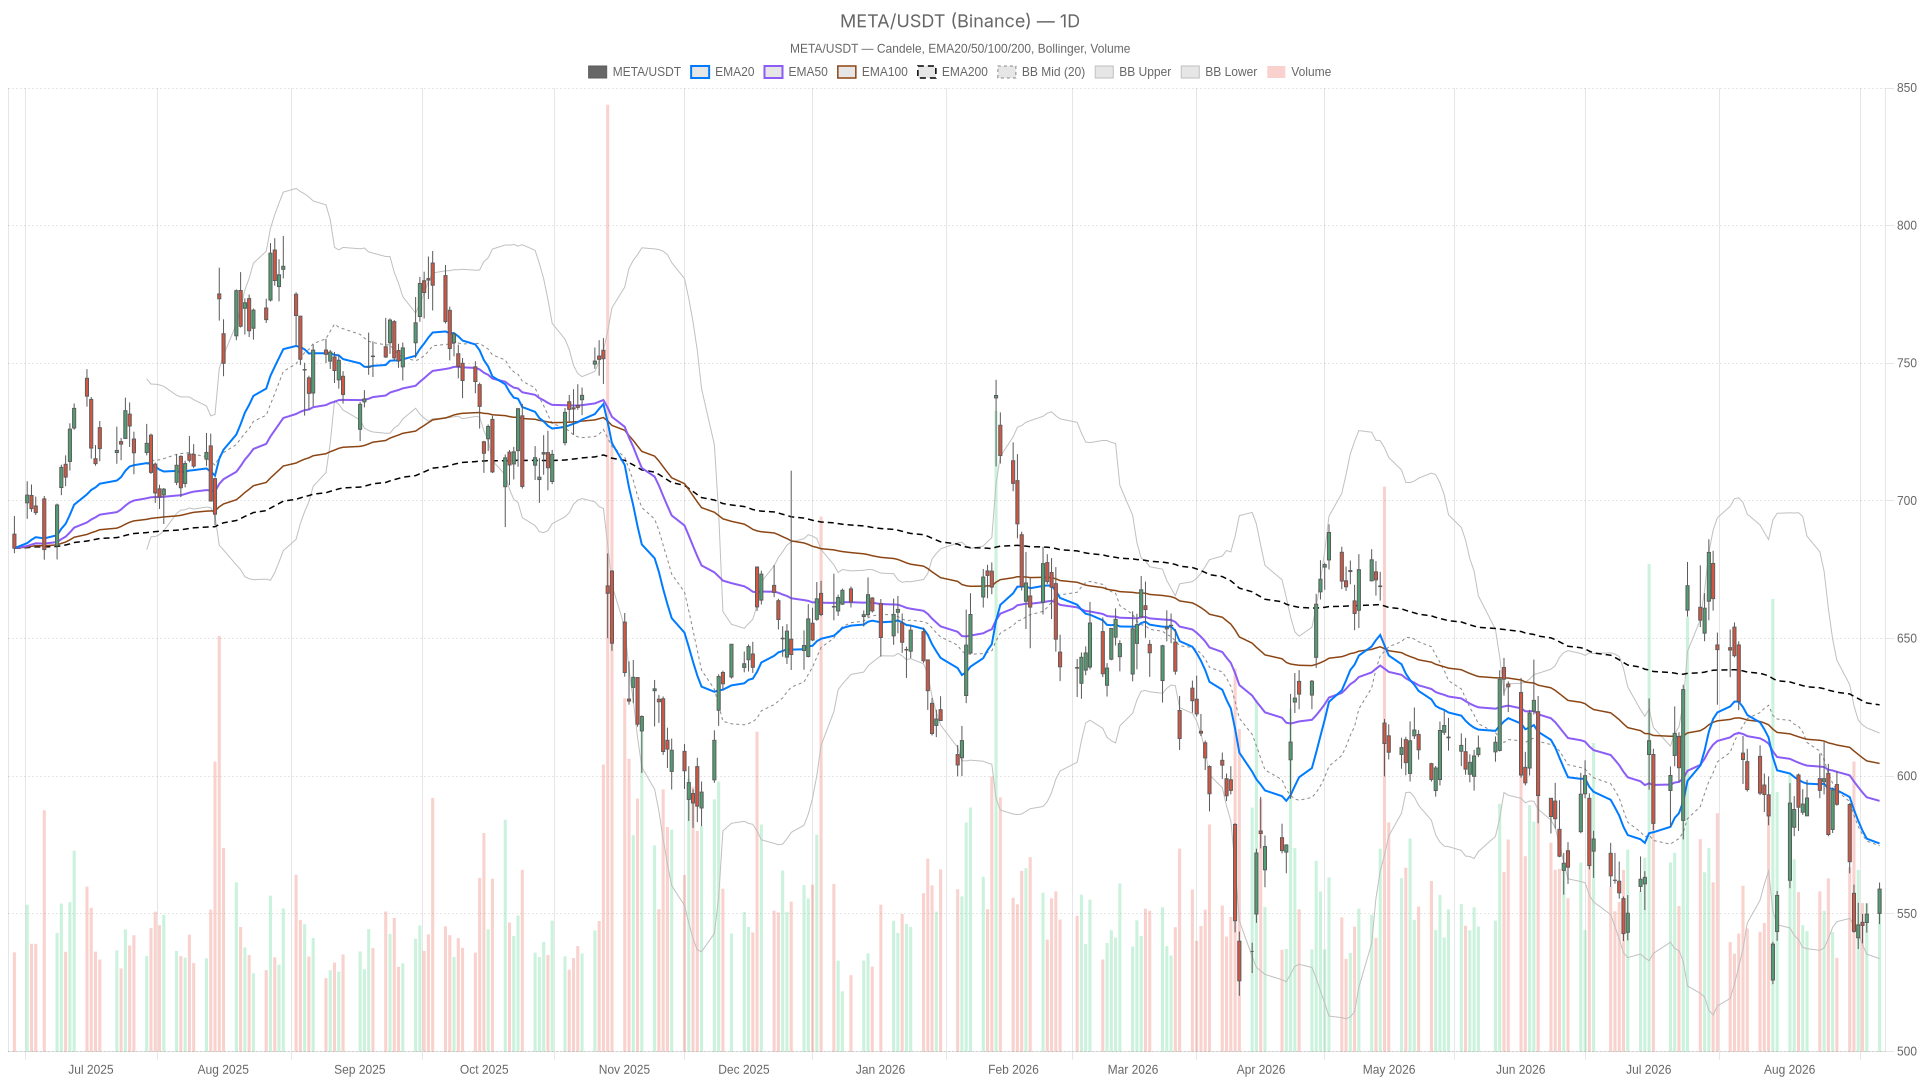
Meta stock sits at a crossroads. The daily chart still points lower, yet recent sessions produced a sharp recovery that complicates the bearish narrative. Price closed at 559.02 on August 24 after printing a high of 561.42. This bounce demands careful interpretation, not blind chasing.
Summary
Key takeaways
- Daily EMA structure remains bearish with price below all three major moving averages (20, 50, 200-period).
- Daily RSI14 at 42.3 leaves room for further downside before oversold conditions emerge.
- The hourly chart shows a bullish MACD crossover, creating direct conflict with daily momentum readings.
- Daily ATR14 at 17.06 confirms elevated volatility; multi-point swings per session are normal.
- A $1.4 trillion legal overhang debate adds fundamental uncertainty to the technical picture.
Meta Stock Price Action: Daily Bias Stays Bearish
On the daily chart, Meta stock remains firmly in bearish territory. Price is trapped below all three major moving averages, and the regime tag confirms a negative structure.
The 20, 50 and 200-period EMAs sit at 575.59, 591.07 and 625.96 respectively — all stacked above current price. That is a textbook bearish alignment. Price trading below all three major moving averages signals the broader trend has not turned. No matter how encouraging the bounce looks, the daily structure remains negative.
Momentum Indicators on the Daily Chart
RSI14 on the daily sits at 42.3. That is soft but not oversold. There is room for price to fall further before momentum becomes stretched to the downside. Meanwhile, MACD reinforces the same message. The line reads -13.77 against a signal of -10.66, leaving a histogram of -3.11. Momentum remains negative on this timeframe. However, the histogram is narrower than a fully accelerating downtrend would suggest. This hints at some loss of bearish speed.
Volatility and Pivot Levels
Bollinger Bands add context on volatility. The mid-band sits at 574.74, with the upper band at 615.7 and the lower band at 533.78. Price at 559.02 trades below the mid-band but comfortably inside the channel. It remains away from either extreme. Notably, ATR14 at 17.06 confirms elevated daily volatility. Swings of several points per session should be expected, not treated as anomalies.
The daily pivot sits at 555.58, with resistance at 564.86 and support at 549.74. Price currently holds above the pivot — a modest short-term positive. Still, it remains well below the broader resistance structure defined by the falling EMAs.
1H Timeframe: A Bounce That Contradicts the Bigger Trend
The hourly chart for Meta stock tells a different story. The regime flips to neutral, and several indicators lean constructive, creating a direct conflict with the daily outlook.
RSI14 on the H1 reads 59.52, comfortably above the midpoint. This is consistent with active buying interest over the past sessions. MACD on this timeframe is also positive. The line sits at 0.81 above a signal of -1.26, producing a histogram of 2.07. That is a genuine bullish crossover on the hourly chart. It stands in direct conflict with the daily momentum reading.
EMA and Volatility Structure on the Hourly
The EMA structure on H1 tells a mixed story. Price at 559.14 sits above the 20-period EMA of 553.89. It sits just below the 50-period EMA of 559.54. However, it remains well under the 200-period EMA at 580.98. In other words, Meta stock has recovered short-term ground without repairing the larger trend.
Bollinger Bands on H1 show the mid-band at 550.51. Price is pushing toward the upper band at 562.45, reflecting the strength of the recent rally. However, ATR14 here is only 4.27. Intraday volatility, while present, is far more contained than the daily swings would suggest.
Therefore, the conflict between timeframes is clear. It should not be glossed over. The daily trend remains bearish under the weight of declining EMAs and negative MACD. At the same time, the hourly chart is actively building bullish momentum. This kind of disagreement typically signals one of two things: either the early stage of a larger reversal or a corrective bounce inside a longer downtrend. At this stage, the data does not confirm which outcome is more likely.
15-Minute Chart: Execution Context
On the 15-minute chart, Meta stock is consolidating near resistance. Early signs suggest momentum may be stalling at current levels.
The regime on this timeframe is also neutral. Price consolidates just under the pivot point of 559.85. RSI14 reads 61.04, still leaning bullish. However, MACD is showing early signs of stalling. The histogram has flipped to -0.08 after a run of positive momentum. That subtle shift suggests short-term buying pressure may be losing steam right at this level.
The EMA alignment places price between the 50-period EMA at 554.32 and the 200-period EMA at 560.82. The 20-period EMA at 557.59 sits in between. Bollinger Bands show price near the mid-band of 557.72. It shows no extension toward the upper band at 561.93 or the lower band at 553.52. ATR14 here is just 1.78. This confirms short-term volatility has compressed as the market pauses near resistance. That resistance is defined by the hourly pivot at 560.71.
What the News Flow Adds to the Meta Stock Story
The fundamental backdrop for Meta stock mirrors the technical conflict. Ad growth momentum is offset by legal risk concerns, leaving no clear directional catalyst.
Ad Growth and Institutional Support
On the positive side, reports highlight accelerating ad growth. Meta’s AI tools and advertiser adoption help the company stay ahead of rivals like RDDT and SNAP. Hedge fund positioning also turned constructive in the second quarter. Notably, two well-known investors added Meta Platforms stock to their holdings.
The Legal Overhang Debate
On the other side, legal risk remains a live debate. Gary Black has warned that a $1.4 trillion “tobacco-like” legal overhang could cause Meta stock to underperform the S&P 500. He acknowledges the shares look cheap at 15.6 times 2026 adjusted earnings against long-term growth above 15%. Jim Cramer, in contrast, has pushed back on that framing. He calls the trial risk overblown and describes the $1.4 trillion figure as a ceiling rather than an actual demand. This disagreement among prominent voices adds another layer of uncertainty. It compounds the technical crosscurrents already in play.
Bullish Scenario for Meta Stock
A bullish reversal in Meta stock requires a sustained close above the daily EMA20 at 575.59. Without that, the bounce remains unconfirmed.
A move through the daily pivot resistance at 564.86 would add credibility. For full confirmation, the daily MACD histogram would need to shrink further and eventually turn positive. RSI14 on the daily would need to climb back above 50. Supportive fundamentals already exist. These include accelerating ad revenue and renewed hedge fund interest. If legal concerns continue to be dismissed as overblown by figures like Cramer, sentiment could shift further in favor of buyers.
Bearish Scenario and Invalidation Levels
The bearish case remains the default for Meta stock given the daily trend structure. A rejection near current levels would confirm the hourly bounce was corrective.
A break below daily support at 549.74 would reinforce this view. In that scenario, RSI14 staying below 50 and MACD remaining negative would validate continued downside pressure. A sustained news cycle around the $1.4 trillion legal overhang could also act as a fundamental catalyst. This would be especially true if Gary Black’s underperformance thesis gains traction over Cramer’s dismissal. That would reinforce the technical downtrend.
Closing Take
Overall, Meta stock is trading in a genuine state of conflict between timeframes. The daily chart still favors sellers. Bearish EMA alignment, negative MACD and price trapped below key moving averages support this view. In contrast, the hourly chart shows real short-term strength. The 15-minute chart suggests that strength may already be pausing near resistance. Given the elevated daily ATR of 17.06, volatility is likely to remain a defining feature. The mixed fundamental narrative around legal risk versus ad growth adds to the uncertainty. Positioning should reflect that uncertainty rather than conviction. Traders should wait until price confirms a clear break of the daily EMA20 or the daily support level.
FAQ
Is Meta stock in a downtrend or an uptrend right now?
The daily chart shows a clear downtrend. Price sits below all three major EMAs, with negative MACD and RSI14 at 42.3. However, the hourly chart shows short-term bullish momentum, creating a genuine conflict between timeframes that traders must navigate carefully.
What are the key support and resistance levels for Meta stock?
Daily support sits at 549.74, with resistance at 564.86. The daily EMA20 at 575.59 is the critical level any bullish reversal must reclaim. On the hourly chart, resistance is defined by the pivot at 560.71.
What is the $1.4 trillion legal risk facing Meta stock?
Gary Black has warned of a $1.4 trillion “tobacco-like” legal overhang that could cause Meta stock to underperform the S&P 500. Jim Cramer has pushed back, calling the figure a ceiling rather than an actual demand. The shares currently trade at 15.6 times 2026 adjusted earnings against long-term growth above 15%.
Disclaimer: This article is for informational purposes only and does not constitute financial advice, an investment recommendation, or a solicitation to buy or sell any financial instrument or cryptocurrency. The analysis provided is not indicative of future results. Investing in crypto assets and financial markets carries a high risk of capital loss. Always do your own research (DYOR) and consult a qualified financial advisor before making any decision.
Article produced with the assistance of artificial intelligence and reviewed by the editorial team.
