




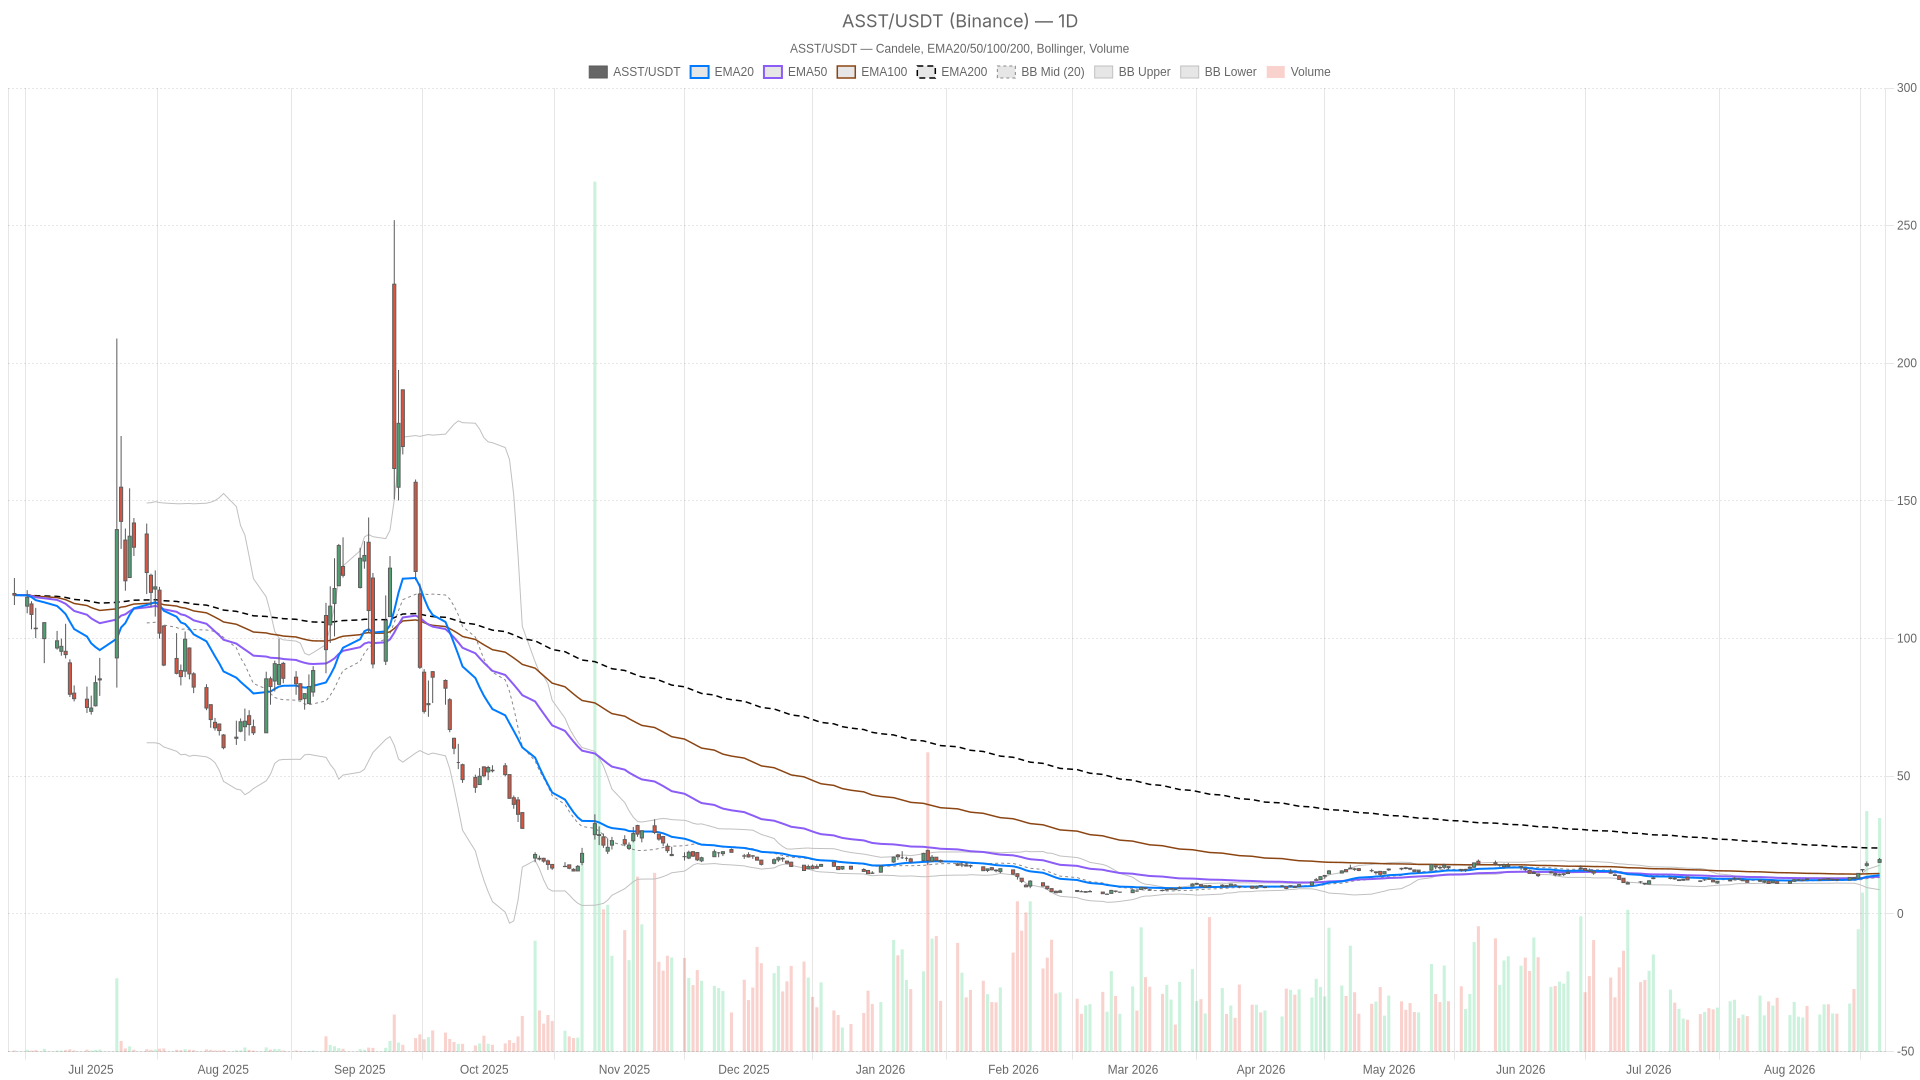
Strive stock surged Monday, closing at $19.73 on heavy volume of over 14.5 million shares. The powerful rally now faces overbought daily readings and a falling 200-EMA at $23.95. This tension defines the immediate outlook for ASST.
Summary
Key takeaways
- ASST closed at $19.73 on Monday with volume exceeding 14.5 million shares, confirming strong participation.
- Daily RSI14 hit 79.82 — firmly overbought — while price closed above the upper Bollinger Band at $17.66.
- The daily 200-EMA sits at $23.95, meaning Strive stock has not yet reclaimed its long-term trend average.
- Insider buying by director Pierre Rochard and a reiterated Benchmark Buy rating add fundamental conviction.
- Immediate resistance stands at $20.50 (daily R1), with key support at $18.77 and the hourly pivot near $19.70.
How Overbought Is Strive Stock on the Daily Chart?
Strive stock shows a daily RSI14 of 79.82, firmly in overbought territory. Meanwhile, price closed at $19.73 — well above the upper Bollinger Band at $17.66. This overshoot typically signals an emotional, momentum-driven move rather than a controlled advance.
On the daily chart, price trades above both the EMA20 at $14.09 and the EMA50 at $13.53. This reflects a sharp short-to-medium-term uptrend. However, the EMA200 sits far above at $23.95. ASST therefore remains technically below its long-term trend average. The rally is powerful, but it has not yet reclaimed the broader downtrend structure.
The daily MACD is unambiguously bullish. The line at 1.18 stands well above the signal at 0.38. The positive histogram of 0.8 confirms strong momentum. Still, the ATR14 of 1.09 points to expanded daily volatility. Swings of a dollar or more per session should be expected. Notably, the system still tags the daily regime as neutral. Price has simply not yet reclaimed the EMA200. That single detail keeps the bigger picture from turning outright bullish.
What Are the Short-Term Signals for ASST?
Hourly Chart: Bullish with Early Hesitation
The hourly chart largely confirms bullish momentum. Strive stock trades above all three EMAs, stacked in bullish order: EMA20 at $18.24, EMA50 at $16.10, and EMA200 at $13.57. The regime here is explicitly bullish, contrasting with the cautious daily read.
However, the 1H MACD reveals a more nuanced story. The line and signal are essentially converged at 1.42, with a histogram of just 0.01. That signals momentum flattening. Price also sits almost exactly at the hourly pivot of $19.70. Resistance stands at $19.87 and support at $19.56. In effect, the hourly chart is pausing right at a decision point after the strong daily push.
15-Minute Chart: Cooling Within a Bullish Frame
On the 15-minute chart, the bullish EMA alignment persists. Yet RSI14 has cooled to a neutral 55.57 — a clear step down from overbought extremes. The 15m MACD has flipped slightly negative with a histogram of -0.08. The line at 0.21 sits below the signal at 0.29. This points to a short-term momentum stall, not a trend reversal. Price sits just under the 15m Bollinger mid of $19.85. The pivot at $19.74 acts as the immediate battleground for execution purposes.
Does Fundamental News Support the ASST Rally?
Fundamentally, sentiment around Strive stock has turned more constructive. Benchmark reiterated a Buy rating, citing the company’s risk management edge. Separately, board director Pierre Rochard purchased 15,900 ASST shares. This move coincided with the SATA perpetual preferred stock approaching par value.
The stock jumped over 1% in premarket trading on the insider buying news. Insider purchases alongside a reiterated analyst Buy rating add conviction to the technical strength. This is noteworthy even as the charts flag overbought conditions. The fundamental layer offers some justification for the rally’s persistence.
What Scenarios Should Traders Watch for Strive Stock?
Bullish Scenario
For bulls, the path forward requires ASST to hold above the daily support at $18.77 and the hourly pivot near $19.70. If buyers defend these zones through the current cooling phase, the next objective becomes the daily R1 at $20.50. Continued volume support — similar to the 14.5 million shares seen Monday — would strengthen the case. Ultimately, a decisive close above the daily EMA200 at $23.95 would confirm a genuine structural trend shift. Insider buying and the Benchmark Buy call provide some fundamental backing.
Bearish Scenario
On the other hand, the overbought daily RSI at 79.82 and the Bollinger overshoot set up a textbook mean-reversion case. If ASST breaks below the daily support at $18.77, a pullback toward the hourly EMA20 at $18.24 becomes plausible. In an extended move, the daily EMA50 at $13.53 could come into play. A deepening negative histogram on the 15m MACD would be an early warning. Similarly, losing the hourly pivot at $19.70 would suggest the stall is becoming a more serious retracement. The bullish case weakens meaningfully if price fails to reclaim the hourly pivot zone soon.
Closing Take
Overall, Strive stock is caught between two realities. The short-term rally is genuine and confirmed on the hourly chart. Yet the daily structure remains technically stretched and still below its long-term trend average.
Momentum indicators across daily and hourly frames flag overbought conditions. The 15-minute chart already shows early signs of cooling. Therefore, traders should expect elevated volatility. ATR readings across all three timeframes point to wider-than-usual price swings. Positioning here demands discipline, given the mix of bullish price action, supportive news flow, and overbought technical readings.
FAQ
Is Strive stock overbought right now?
Yes. The daily RSI14 reached 79.82 and price closed above the upper Bollinger Band at $17.66, both signaling overbought conditions. However, the 15-minute chart already shows cooling, with RSI at a neutral 55.57.
What is the key resistance level for ASST?
The immediate resistance is the daily R1 at $20.50. Beyond that, the critical level is the daily 200-EMA at $23.95, which would need to be reclaimed for a genuine structural trend shift.
Does insider buying support the Strive stock rally?
Yes. Board director Pierre Rochard purchased 15,900 ASST shares, and Benchmark reiterated a Buy rating. These add fundamental conviction to the technical strength, even as overbought signals persist.
What would invalidate the bullish case for ASST?
A break below the daily support at $18.77 would be the first warning. Losing the hourly pivot at $19.70, combined with a deepening negative 15m MACD histogram, would suggest a more serious retracement is underway.
Disclaimer: This article is for informational purposes only and does not constitute financial advice, an investment recommendation, or a solicitation to buy or sell any financial instrument or cryptocurrency. The analysis provided is not indicative of future results. Investing in crypto assets and financial markets carries a high risk of capital loss. Always do your own research (DYOR) and consult a qualified financial advisor before making any decision.
Article produced with the assistance of artificial intelligence and reviewed by the editorial team.
