




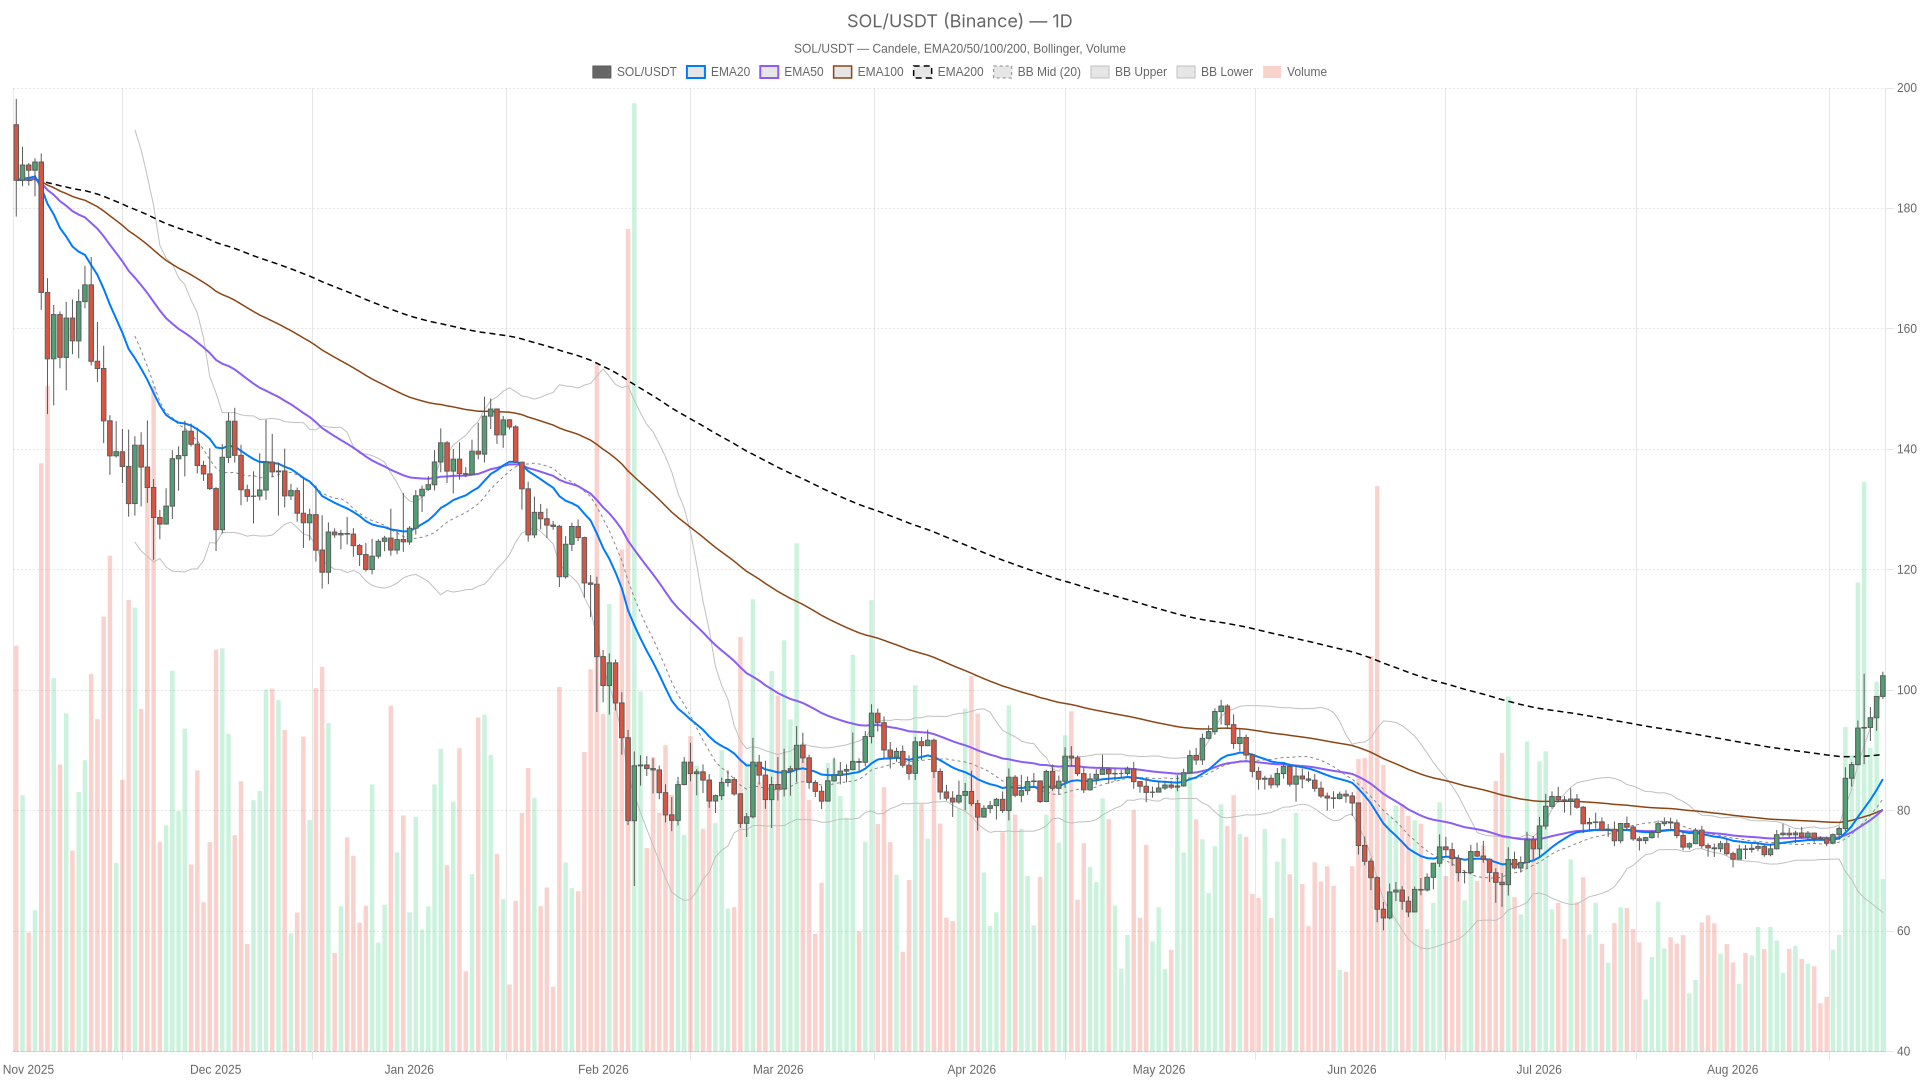
As of August 25, 2026, the tension in Solana crypto is unmistakable: price grinds higher while every classic overbought signal on the daily chart flashes red. SOL/USDT closed at $102.41, above its Bollinger upper band, with RSI at 88.12.
Summary
Key takeaways
- SOL/USDT closed at $102.41 with daily RSI at 88.12, deep in overbought territory on August 25, 2026
- On-chain DEX fees are surging: Orca up 429% weekly, Raydium up 140%, and multiple protocols posting triple-digit gains
- Fear & Greed Index at 74 and total crypto market cap at $2.73 trillion signal strong risk appetite across the market
- The daily trend remains structurally bullish, but lower timeframe momentum is stalling at the execution level
- BTC dominance at 59.27%, yet SOL still holds 2.18% of total market cap according to CoinGecko-sourced data
Daily Structure: Bullish Trend, Overbought Momentum for SOL
The daily chart tells a clean trend story despite overbought readings. SOL remains in a textbook uptrend with all moving averages aligned bullishly, and the EMA stack is unambiguously constructive. The 20-period EMA at $85.25 sits above the 50-period at $80.15, and price trades well above both. Even the 200 EMA at $89.35 now acts as distant support rather than resistance. The MACD line at 6.01 versus a signal line of 3.37, with a histogram of 2.64, confirms that momentum has been building rather than fading. This is not a low-conviction grind; it is a trend with genuine force behind it.
However, the RSI at 88.12 and a close above the upper Bollinger Band at $100.77 are extreme readings. Historically, such levels do not sustain for long without a cooling-off period. That cooling could come through a price pullback or a sideways digestion phase. The system’s regime classification labels the daily setup as neutral rather than outright bullish, and that detail is worth taking seriously. It likely reflects how far price has run above its own mean, raising the odds of a snapback even within a broader uptrend. Trend-followers see confirmation, mean-reversion traders see exhaustion, and both are reading the same chart correctly.
1H Timeframe: Confirming the Uptrend, But Momentum Is Hot
The 1-hour chart, meanwhile, backs up the bullish bias without reservation. Price at $102.33 sits above the 20 EMA at $98.55, the 50 EMA at $96.36, and the 200 EMA at $89.12. The system tags this timeframe outright bullish. MACD is positive at 1.8 versus a 1.3 signal line, with a histogram of +0.5, reinforcing that short-term buyers are still driving the action. RSI at 73.22 is elevated but nowhere near the extreme seen on the daily. It is hot, but not screaming exhaustion.
Price is also pressing against the upper Bollinger Band on this timeframe at $102.86, versus a mid-band of $97.86. This tells you buyers have been willing to pay up rather than wait for pullbacks. The daily pivot at $101.35 has already been reclaimed, and price is edging toward daily R1 at $104.14. On the hourly chart, price sits just above its own pivot at $102.22, with R1 at $103.19 nearby. In short, the 1H timeframe agrees with the daily trend direction but does not share the same degree of overbought alarm.
15-Minute View: Momentum Is Cooling at the Execution Level
The 15-minute chart reveals a more nuanced picture. The trend remains bullish, but short-term momentum is stalling right where execution matters most. Price at $102.34 is still above all three EMAs, with the 20 at $101.19, the 50 at $99.51, and the 200 at $96.60, keeping the regime tag bullish. However, the MACD histogram has flipped slightly negative at -0.06, with the MACD line at $0.84 now sitting just under the signal line at $0.90. That is a subtle but real signal that short-term momentum is rolling over.
Price is also compressed just under the 15-minute Bollinger upper band at $102.68, hovering around its own pivot point at $102.43. A tight range sits between S1 at $102.11 and R1 at $102.65. The ATR readings across timeframes back this up: the daily ATR sits at $4.60, the hourly at $1.68, but the 15-minute ATR has dropped to just $0.84. Volatility is compressing at the execution level even as the bigger picture stays stretched. That combination often precedes a decisive move in either direction rather than more drift.
The Fundamental Backdrop: DEX Activity Is Surging
For Solana crypto, the fundamental backdrop arguably matters more than the chart right now. On-chain activity is posting extraordinary growth across decentralized exchanges. Notably, fee data from DefiLlama shows Solana-based DEXs recording exceptional gains. Orca DEX fees are up 429.29% over 7 days and 1,131.33% over 30 days. Raydium AMM fees climbed 140.26% over 7 days and 468.80% over 30 days. BisonFi posted a 96.29% weekly gain and 479.38% monthly gain in fees. PumpSwap, despite a small daily dip of -2.51%, is still up 86.33% weekly and 45.29% monthly. This is not speculative noise layered on top of a chart pattern. It is a genuine surge in on-chain economic activity across the ecosystem, and it gives the bullish technical case real fundamental backing.
Bullish Scenario for SOL
If buyers can defend the daily pivot at $101.35 and push through R1 at $104.14, the trend structure across all three timeframes stays aligned and the move likely extends. Moreover, DEX fee growth suggests real demand for the network is not fading. A holding pattern above the 1H EMA20 at $98.55 while the 15-minute MACD histogram flips back positive would be the clearest sign that the pause was just a breather rather than a top. This scenario would be invalidated if price loses the daily pivot and closes back below $99.62 at daily S1. That would suggest the overbought daily RSI finally won the argument.
Bearish Scenario for SOL
A mean-reversion pullback remains a real possibility given the daily RSI at 88.12 and a close already outside the upper Bollinger Band. Price could retrace toward the daily BB mid-band at $81.93, or at minimum toward the 50 EMA at $80.15, if momentum breaks down. Additionally, a more immediate warning sign would be the 15-minute MACD histogram staying negative while price loses the 15-minute pivot at $102.43 and then the 1H EMA20 at $98.55. That combination would suggest the stall seen at the execution level is turning into genuine distribution. The bearish case would be invalidated if price reclaims and holds above the daily BB upper band at $100.77 and pushes cleanly through $104.14.
Positioning and Risk
SOL sits at a genuine crossroads between trend continuation and overdue mean reversion, and both cases carry merit depending on which timeframe carries the most weight. The daily chart’s extreme RSI and Bollinger Band breach argue for caution. The hourly chart’s clean bullish alignment argues for staying with the trend. Meanwhile, the 15-minute chart’s momentum stall suggests the market itself has not decided yet. Layer on a Fear & Greed reading of 74 and a broader market cap that is still expanding, and you get a backdrop where risk appetite is real but sentiment is also getting stretched across the board, not just in SOL.
Moreover, volatility compression on the lower timeframe, with the 15-minute ATR at just $0.84 against a daily ATR of $4.60, means whatever move comes next could arrive quickly once it starts. Anyone tracking this setup should think in terms of levels and confirmation rather than conviction in either direction. The daily pivot, the $100.77 Bollinger line, and the reaction at $104.14 on the upside or $99.62 on the downside will likely do more to answer the question than any single indicator on its own.
FAQ
Is Solana overbought right now?
Yes. The daily RSI sits at 88.12 and price closed above the upper Bollinger Band at $100.77, both classic overbought signals. However, overbought conditions can persist in strong trends, and the underlying EMA structure remains firmly bullish with the 20-period EMA well above the 50-period.
What does the surge in DEX fees mean for SOL?
It signals genuine on-chain demand rather than purely speculative price action. Orca fees rose 429% weekly, Raydium climbed 140%, and multiple other protocols posted triple-digit gains. This suggests real economic activity is driving the network, giving the technical uptrend fundamental support.
Where are the key support levels to watch?
The daily pivot at $101.35 serves as near-term support, with S1 at $99.62. Below that, the 1H EMA20 at $98.55 and the daily Bollinger mid-band at $81.93 are the levels that matter most for maintaining trend integrity. The 50 EMA at $80.15 provides an additional floor.
What would invalidate the bullish case?
A close below the daily pivot at $101.35 followed by a break of $99.62 would suggest the overbought signals are winning. Conversely, a clean push above $104.14 with the 15-minute MACD turning positive would invalidate the bearish mean-reversion thesis and confirm trend continuation.
Disclaimer: This article is for informational purposes only and does not constitute financial advice, an investment recommendation, or a solicitation to buy or sell any financial instrument or cryptocurrency. The analysis provided is not indicative of future results. Investing in crypto assets and financial markets carries a high risk of capital loss. Always do your own research (DYOR) and consult a qualified financial advisor before making any decision.
Article produced with the assistance of artificial intelligence and reviewed by the editorial team.
