




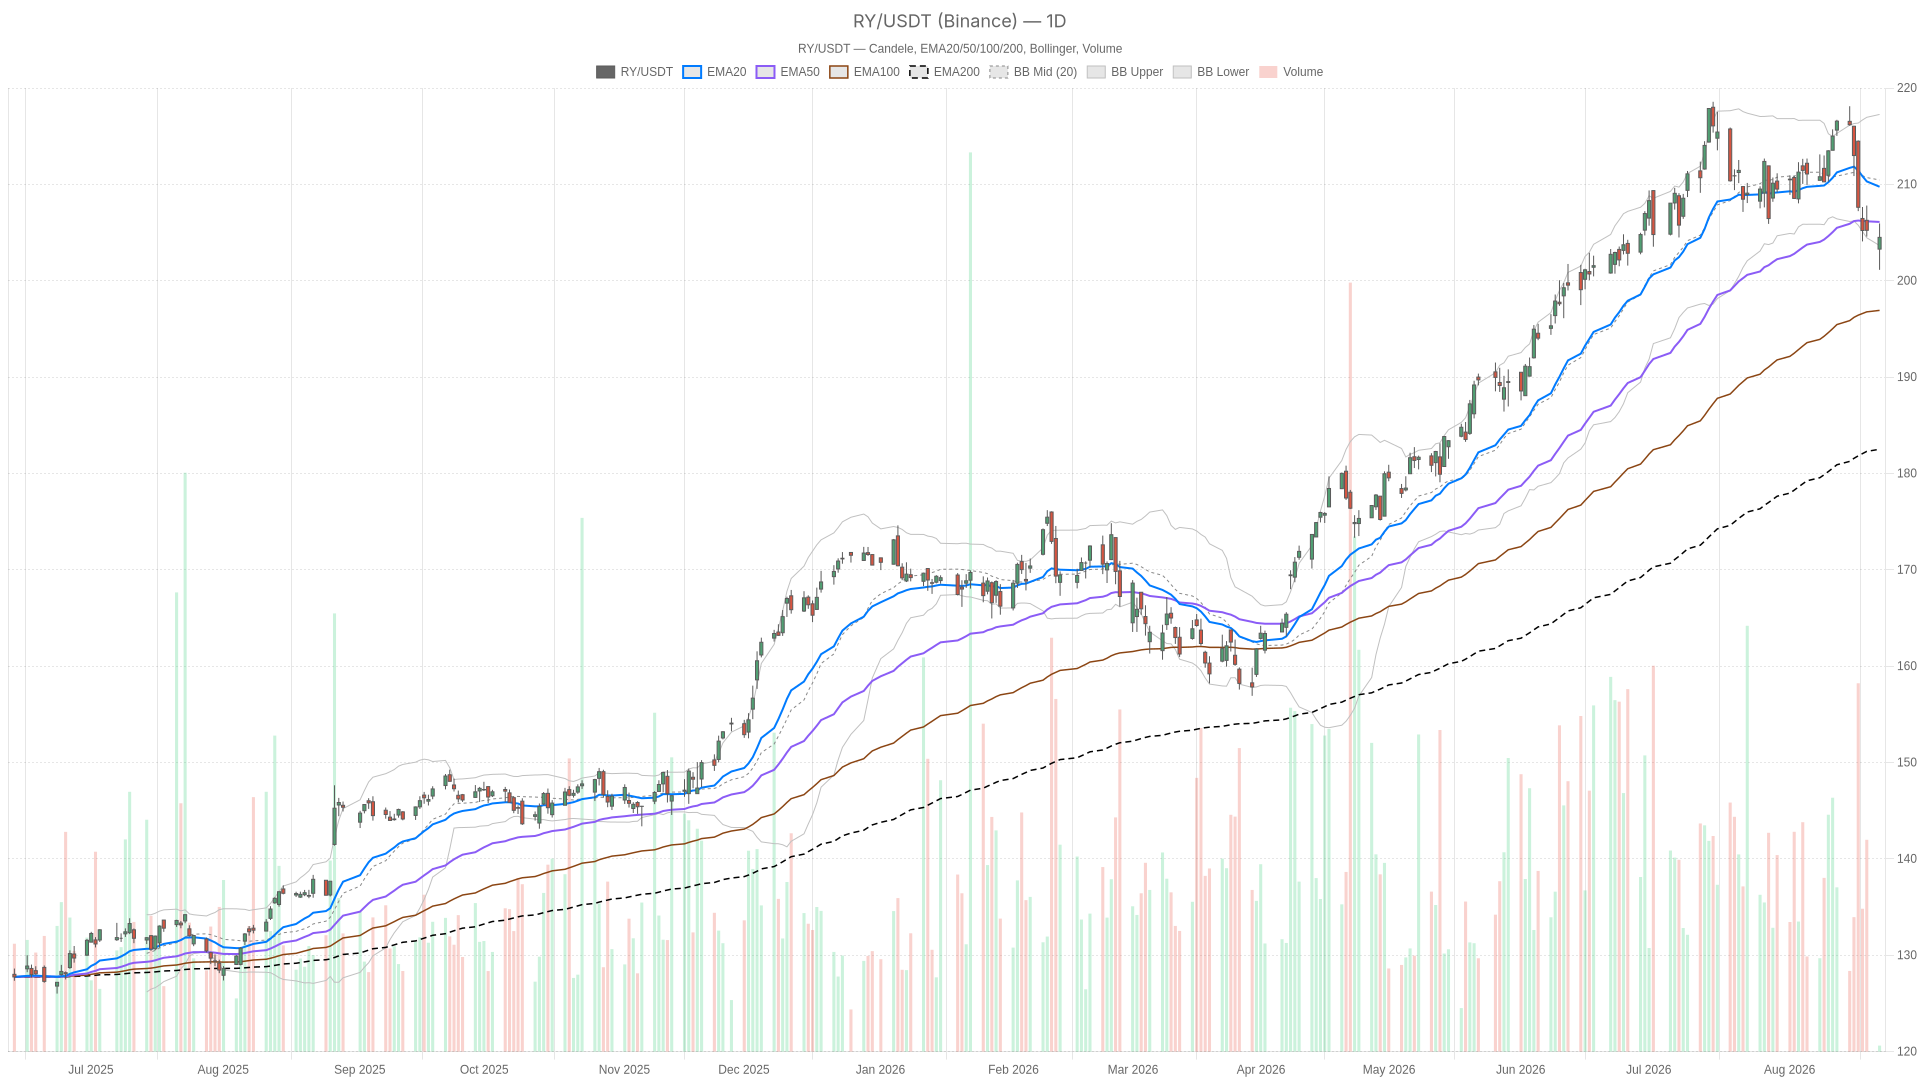
Royal Bank of Canada (RBC) stock is testing critical support as earnings approach. RY closed at 204.50, hovering near the daily pivot at 203.86. The long-term uptrend remains intact, but short-term momentum has faded, placing RBC stock at a technical crossroads ahead of the report.
Summary
Key takeaways
- RY closed at 204.50, sitting directly on the daily pivot point of 203.86
- Price trades below both the 20-day EMA (209.75) and 50-day EMA (206.10), confirming short-term weakness
- The 200-day EMA at 182.51 remains far below price, validating the multi-month uptrend
- Daily RSI14 at 39.48 approaches oversold territory without yet confirming it
- Wall Street expects earnings growth; the report could catalyze a technical reversal
Daily Structure: Uptrend Intact, Momentum Fading
Royal Bank of Canada stock remains in a structurally bullish long-term uptrend, but short-term momentum has clearly deteriorated. Price now sits well above the 200-day EMA at 182.51, confirming the dominant multi-month direction. However, RY has slipped below both the 20-day EMA (209.75) and the 50-day EMA (206.10). This is the core tension: a bullish market trading below its short and medium-term averages.
Momentum Indicators Turn Bearish
RSI14 on the daily timeframe sits at 39.48, approaching oversold territory without yet confirming it. Meanwhile, the MACD line at -0.23 has crossed below its signal line at 1.00. The resulting histogram reading of -1.23 reinforces the bearish momentum signal. Sellers have taken control of the near-term narrative, even though the broader trend remains unbroken.
Bollinger Bands and Volatility Context
Bollinger Bands add further context. The daily mid-band stands at 210.45, with the upper band at 217.26 and the lower band at 203.65. Price is currently hugging that lower band. This often signals either an oversold stretch ready to mean-revert or the early stage of a deeper breakdown. Daily ATR14 of 3.47 confirms volatility has picked up, giving each session more room to move. The daily pivot structure frames the immediate battleground, with support at 201.77 (S1) and resistance at 206.59 (R1).
1H Timeframe Confirms Near-Term Weakness
The 1-hour chart confirms the daily weakness rather than contradicting it. Its regime reading is outright bearish, and the indicator stack backs that up. Price trades below the 20-hour EMA (206.24), the 50-hour EMA (208.77), and the 200-hour EMA (209.99). This fully bearish EMA alignment strengthens the case that the current pullback is a genuine short-term risk, not merely daily noise.
RSI14 at 34.40 sits closer to oversold conditions than the daily reading. This suggests the intraday decline has been sharper than daily candles alone would imply. At the same time, the MACD picture shows some nuance. The MACD line at -1.50 remains above the signal line at -1.72, keeping the broader bearish bias intact. Yet the histogram has ticked into positive territory at 0.21. This is a small but notable sign that downside momentum may be losing steam intraday.
The 1H Bollinger Bands show the mid-band at 205.60 with price near the lower boundary at 203.83, consistent with the daily setup. Overall, the 1-hour timeframe reinforces the bearish short-term outlook while hinting at a possible pause in selling pressure.
15-Minute Execution Context
The 15-minute chart offers no strong directional signal of its own. Price is essentially glued to the pivot point at 204.51, with resistance at 204.55 and support at 204.46. This extremely tight range reflects a market in a holding pattern rather than a decisive move.
The regime is also labeled bearish, but RSI14 at 44.59 is far more neutral than on higher timeframes. The MACD histogram is nearly flat at 0.01. In short, this chart is best read as a waiting zone. The resolution will likely come from the daily and 1H structure, particularly with earnings on the calendar.
Bullish Scenario for RY Stock
A bullish reversal for Royal Bank of Canada stock requires price to reclaim the daily 50-day EMA at 206.10 and ideally push back toward the 20-day EMA at 209.75. Recovery in RSI14 above the 50 level, combined with a narrowing and turning MACD histogram, would suggest sellers are losing control. Holding above the daily S1 at 201.77 would also signal that the pullback is contained rather than accelerating.
Notably, the fundamental backdrop offers supportive context. Wall Street expects Royal Bank to report earnings growth in its upcoming release. A strong report could provide the catalyst needed to reverse recent technical weakness. Separately, Royal Bank of Canada has been named Official Bank Partner and Official Wealth Management Partner for Wrexham AFC for the 2026/27 season. While not a near-term technical driver, this reflects continued corporate expansion. It fits the longer-term bullish narrative embedded in the wide gap above the 200-day EMA.
Bearish Scenario: What Invalidates the Upside
A break below the daily S1 at 201.77 would invalidate the near-term bullish case. Combined with a decisive close under the lower Bollinger Band at 203.65, it would open the door to a deeper correction. If RSI14 on the daily chart pushes decisively below 35, sellers are confirmed to be firmly in control. A MACD histogram that continues widening negatively would reinforce that signal.
On the 1-hour timeframe, a breakdown below tight support at 204.46 with rising volume would align with the already-bearish EMA stack. This would reinforce the case for further downside. In this context, the earnings report becomes a risk rather than a catalyst. A disappointing print against already-fragile momentum could accelerate the corrective move rather than reverse it.
Closing Thoughts
Royal Bank of Canada (RBC) stock sits at a technical crossroads. The daily chart shows a long-term uptrend that remains structurally intact given the substantial distance from the 200-day EMA. However, short-term momentum has clearly deteriorated. The 1-hour timeframe confirms this weakness with a fully bearish EMA alignment. The MACD histogram on that timeframe does hint at a possible pause in selling pressure, but this does not overturn the bearish intraday regime.
Volatility, as measured by ATR across all three timeframes, suggests the market has room to move once a direction is chosen. With earnings expected, positioning around RY stock should account for the possibility of a sharp reaction in either direction. Until price decisively clears the daily EMA structure to the upside or breaks below S1 support, the near-term picture remains genuinely uncertain. Traders should treat the current range as a transitional phase rather than a settled trend.
FAQ
Is Royal Bank of Canada stock still in a long-term uptrend?
Yes. RY trades well above the 200-day EMA at 182.51, which confirms the multi-month uptrend remains structurally intact despite the recent pullback below short-term moving averages.
What are the key support levels to watch for RY stock?
The most critical support is the daily S1 pivot at 201.77. A break below this level, combined with a close under the lower Bollinger Band at 203.65, would signal that a deeper correction may be underway.
What could trigger a bullish reversal in RBC stock?
A reclaim of the 50-day EMA at 206.10, ideally followed by a push toward the 20-day EMA at 209.75, would suggest buyers are regaining control. The upcoming earnings report could serve as that catalyst if results beat expectations.
What is the near-term outlook for RY ahead of earnings?
The near-term picture is uncertain. The 1H chart shows a fully bearish EMA stack, but the MACD histogram hints at slowing downside momentum. Until price breaks decisively above the daily EMAs or below S1 support, the stock remains in a transitional range.
Disclaimer: This article is for informational purposes only and does not constitute financial advice, an investment recommendation, or a solicitation to buy or sell any financial instrument or cryptocurrency. The analysis provided is not indicative of future results. Investing in crypto assets and financial markets carries a high risk of capital loss. Always do your own research (DYOR) and consult a qualified financial advisor before making any decision.
Article produced with the assistance of artificial intelligence and reviewed by the editorial team.
