




Sadot Group Inc. stock surged 50.7% in pre-market and intraday trading, jumping from $18.37 in pre-market to $27.68 at the close after debt restructuring progress and an AI-powered commodity trading pivot were unveiled. This violent repricing now collides with an unresolved longer-term downtrend.
Summary
Key takeaways
- Sadot Group Inc. stock rallied from $18.37 in pre-market to $27.68 at the close following debt restructuring news and the company’s AI-powered commodity trading pivot.
- The daily EMA200 at $54.88 sits roughly double the current price, confirming the stock remains in a longer downtrend.
- RSI14 on the 1H timeframe hit 78.22, deep in overbought territory, signaling the rally is stretched.
- ATR14 at 3.23 confirms genuinely elevated volatility with wide ranges across all timeframes.
- Key resistance stands at $32.03; a breakdown below $26.65 would suggest fading momentum.
Sadot Group Inc. Stock Daily Structure: Momentum Meets a Deep Downtrend
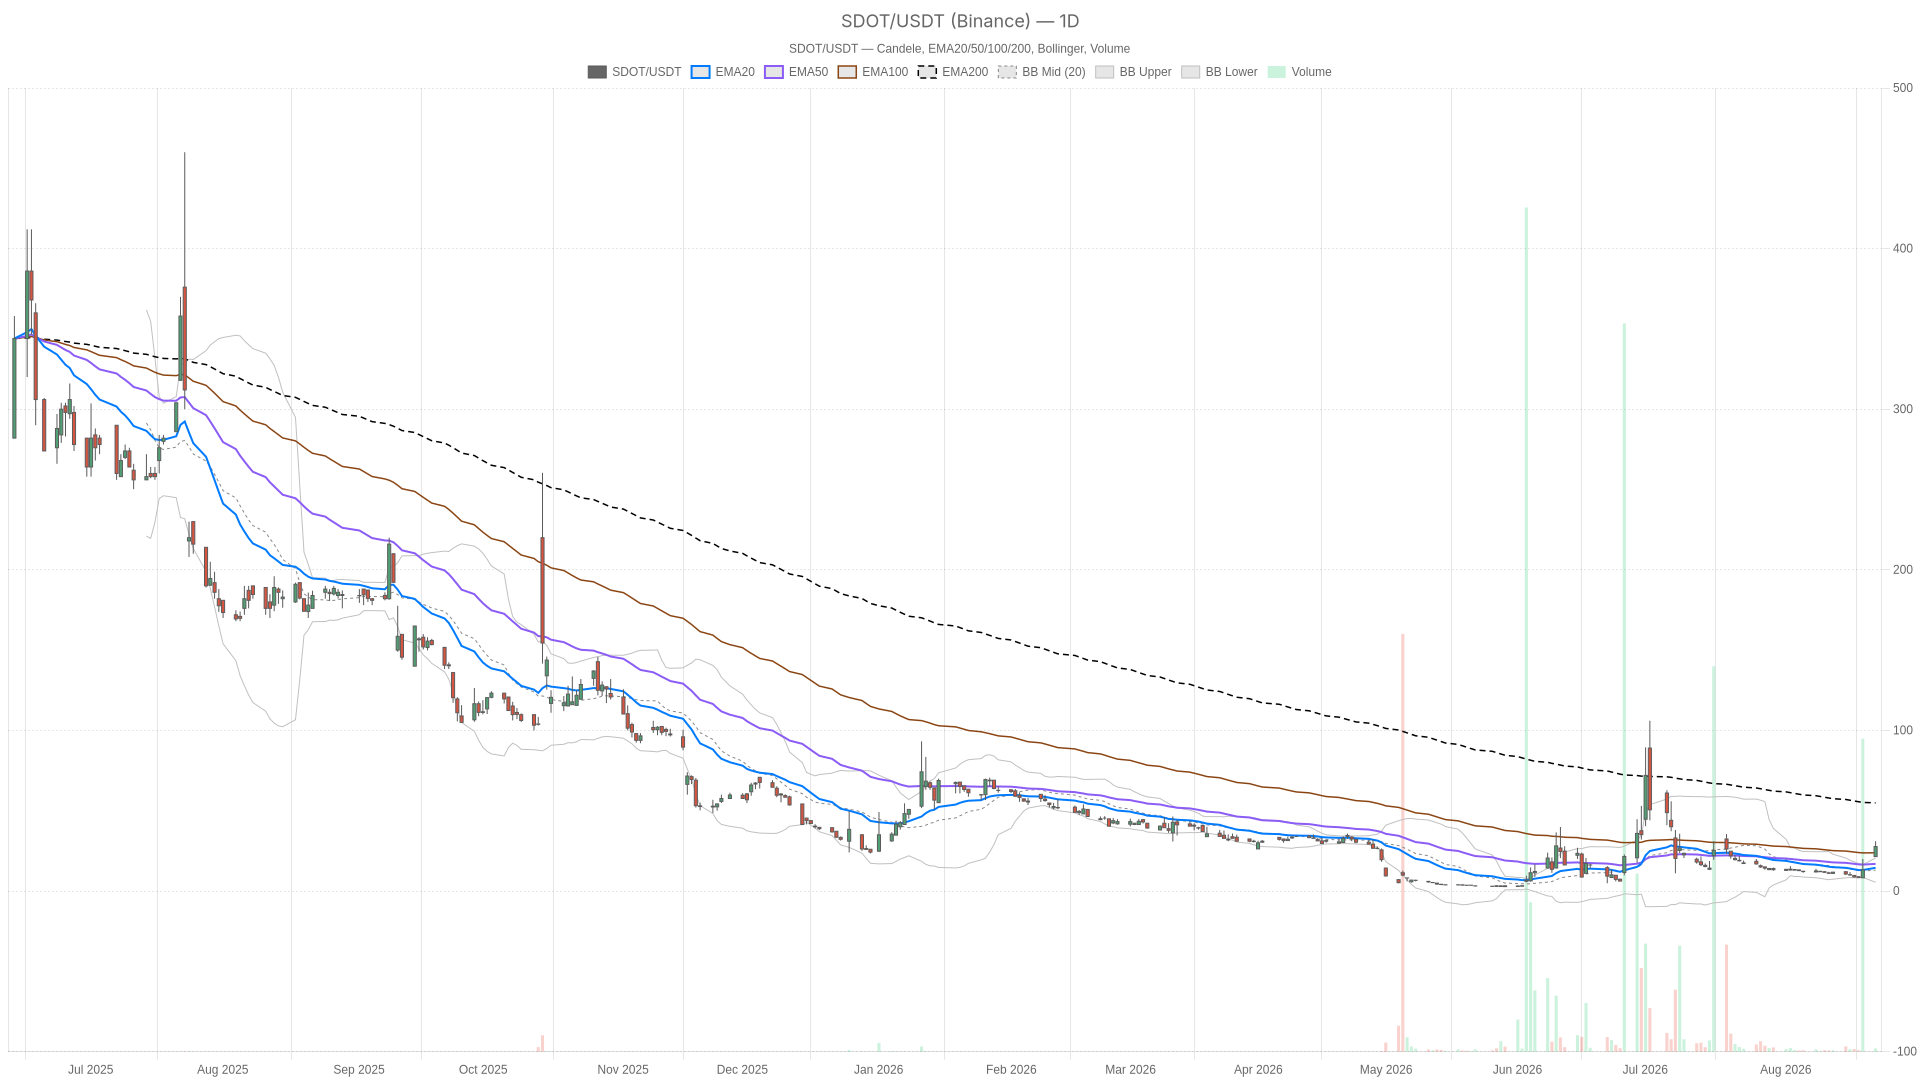
The daily chart shows an explosive rally still trapped inside a longer downtrend, with price trading far below the EMA200 at $54.88. Price closed at $27.68 after a wide-ranging session. EMA20 at $14.44 and EMA50 at $16.88 sit far below current price, confirming just how sharp the recent thrust has been.
However, the EMA200 tells a very different story. At $54.88, it sits roughly double where the stock trades today. SDOT remains deep inside a longer downtrend on the daily timeframe, even after this explosive rally. That divergence between short-term and long-term averages is the central conflict in this chart.
RSI14 on the daily reads 66.57, showing momentum has turned bullish without reaching extreme overbought territory. There is still some room before daily momentum becomes exhausted. MACD adds nuance: the line sits at -0.97 against a signal of -2.24, with a histogram of +1.27. A bullish crossover is forming, but from deeply negative territory. The MACD line itself has not turned positive — typical of a stock recovering from oversold conditions rather than one in a confirmed uptrend.
Meanwhile, Bollinger Bands reinforce the extended nature of this move. The mid-band sits at 12.98, with the upper band at 20.54 and the lower at 5.43. Price at $27.68 trades well above the upper band — a classic signature of a volatility-driven breakout that has stretched statistically. ATR14 at 3.23 confirms daily ranges have expanded sharply, consistent with news-driven spikes rather than orderly trending. Price holds above the daily pivot at $26.65, with resistance at $32.03 and support at $22.30.
1H Timeframe: Bullish Trend Confirmed, But Overbought
The hourly chart confirms the bullish thrust but warns that RSI14 has reached 78.22 — deep into overbought territory. EMA20 at 14.64, EMA50 at 12.55, and EMA200 at 14.59 are all clustered well below current price near 27.30. This shows the hourly trend structure has turned decisively bullish. However, RSI14 at 78.22 sits deep in overbought territory. The trend direction is confirmed, but the pace looks stretched.
MACD on the hourly reads 3.00 against a signal of 1.30, with a histogram of 1.71 — all strongly positive and confirming active bullish momentum. At the same time, Bollinger Bands show price trading above the upper band of 24.01, again pointing to an extended condition. The hourly pivot sits at 27.04, with resistance at 28.71 and support at 25.63.
Notably, this is where the timeframe conflict becomes clear. The 1H chart confirms bullish momentum from an overbought extreme. Meanwhile, the daily chart still shows price trading far below its EMA200. This looks more like a sharp momentum spike or short-covering event than a confirmed structural trend reversal.
15-Minute Execution Context
The 15-minute chart shows a decisively bullish regime with stacked EMAs and some remaining intraday room before exhaustion. EMA20 at 19.50, EMA50 at 15.32, and EMA200 at 12.15 all stack in bullish order below price. RSI14 at 78.82 is overbought. MACD at 3.80 against a signal of 2.49 confirms strong short-term momentum.
Bollinger Bands show the upper band at 29.50, with price at 27.30 still trading below it. This suggests some room remains before intraday exhaustion on this specific timeframe. Pivot levels are tight: the pivot point at 26.99, resistance at 27.88, and support at 26.42 — useful markers for timing entries or exits around this volatile session.
Bullish Scenario: Room Toward $32.03
If SDOT holds above the daily pivot at $26.65, the rally has room to extend toward the daily R1 resistance at $32.03. Defending hourly support near 25.63 would further strengthen the near-term case. Continued positive headlines around debt restructuring progress and the company’s AI-powered commodity trading initiative could keep attracting buying interest. A sustained daily close above the upper Bollinger Band — rather than a single spike through it — would signal that this breakout has real follow-through behind it.
Bearish Scenario: Overbought Risks Point to a Sharp Pullback
Overbought RSI readings on the 1H and 15m timeframes make a sharp pullback a real and present risk. The 1H RSI at 78.22 and the 15m RSI at 78.82 are hard to ignore. Combined with price trading well above upper Bollinger Bands on every timeframe, a sharp pullback would not be surprising. The daily EMA200 at $54.88 remains a significant overhead reminder that the stock is still technically in a downtrend on a longer horizon.
A move back below the daily pivot at $26.65 would suggest the momentum spike is fading. A breakdown through hourly support at $25.63 would open the door toward daily S1 support at $22.30.
Volatility Context and the Bigger Picture
SDOT is caught between an aggressive news-driven surge and a daily structure that has not yet confirmed a trend reversal. ATR readings near 3.2 to 3.3 across timeframes point to genuinely elevated volatility. Ranges are wide, and moves can happen quickly in either direction. Given the overbought momentum readings sitting against an unconfirmed daily trend reversal, this remains a highly uncertain setup. Position sizing and risk management deserve particular attention.
FAQ
What drove Sadot Group Inc. stock higher?
Shares surged after the company announced further progress on debt restructuring and a growing pivot toward AI-powered commodity trading technology. The stock jumped from $18.37 in pre-market to $27.68 at the close.
Is SDOT still in a downtrend?
Yes, on the daily timeframe. Despite the explosive rally, the daily EMA200 sits at $54.88 — roughly double the current price — confirming the stock remains deep inside a longer downtrend.
What are the key levels to watch for SDOT?
Key resistance stands at the daily R1 at $32.03, with hourly resistance at $28.71. On the downside, the daily pivot at $26.65 serves as the first critical support, followed by hourly support at $25.63 and daily S1 at $22.30.
How overbought is SDOT right now?
RSI14 on the 1H timeframe sits at 78.22 and on the 15m timeframe at 78.82 — both deep in overbought territory. The daily RSI14 at 66.57 still has room before reaching extreme levels.
Disclaimer: This article is for informational purposes only and does not constitute financial advice, an investment recommendation, or a solicitation to buy or sell any financial instrument or cryptocurrency. The analysis provided is not indicative of future results. Investing in crypto assets and financial markets carries a high risk of capital loss. Always do your own research (DYOR) and consult a qualified financial advisor before making any decision.
Article produced with the assistance of artificial intelligence and reviewed by the editorial team.
