




Tesla stock is caught between daily resistance and rising support. The hourly chart leans bullish while the daily timeframe remains neutral. This divergence defines the setup as Tesla navigates robotaxi regulatory news and broader market caution ahead of Nvidia earnings.
Summary
Key Takeaways
- Tesla stock closed at 357.78, sitting almost exactly on the daily pivot at 357.50 — a level reflecting indecision.
- The hourly chart shows a bullish alignment with price above the 20, 50, and 200-hour EMAs, diverging from the neutral daily picture.
- Daily RSI at 55.38 and a positive MACD histogram at 6.20 suggest downside momentum is fading, though the trend has not yet flipped bullish.
- Resistance sits at 358–363 (50-day EMA and daily highs); failure there risks a slide toward the daily EMA20 at 343.59.
- Robotaxi safety data and analyst Market Perform ratings provide a mixed fundamental backdrop ahead of Nvidia earnings.
Daily Structure: Tesla Stock Stuck Between Support and Resistance
Tesla stock is boxed in. The daily chart shows price caught below medium-term resistance while holding above near-term support — a classic consolidation pattern.
Moving Averages Frame the Ceiling
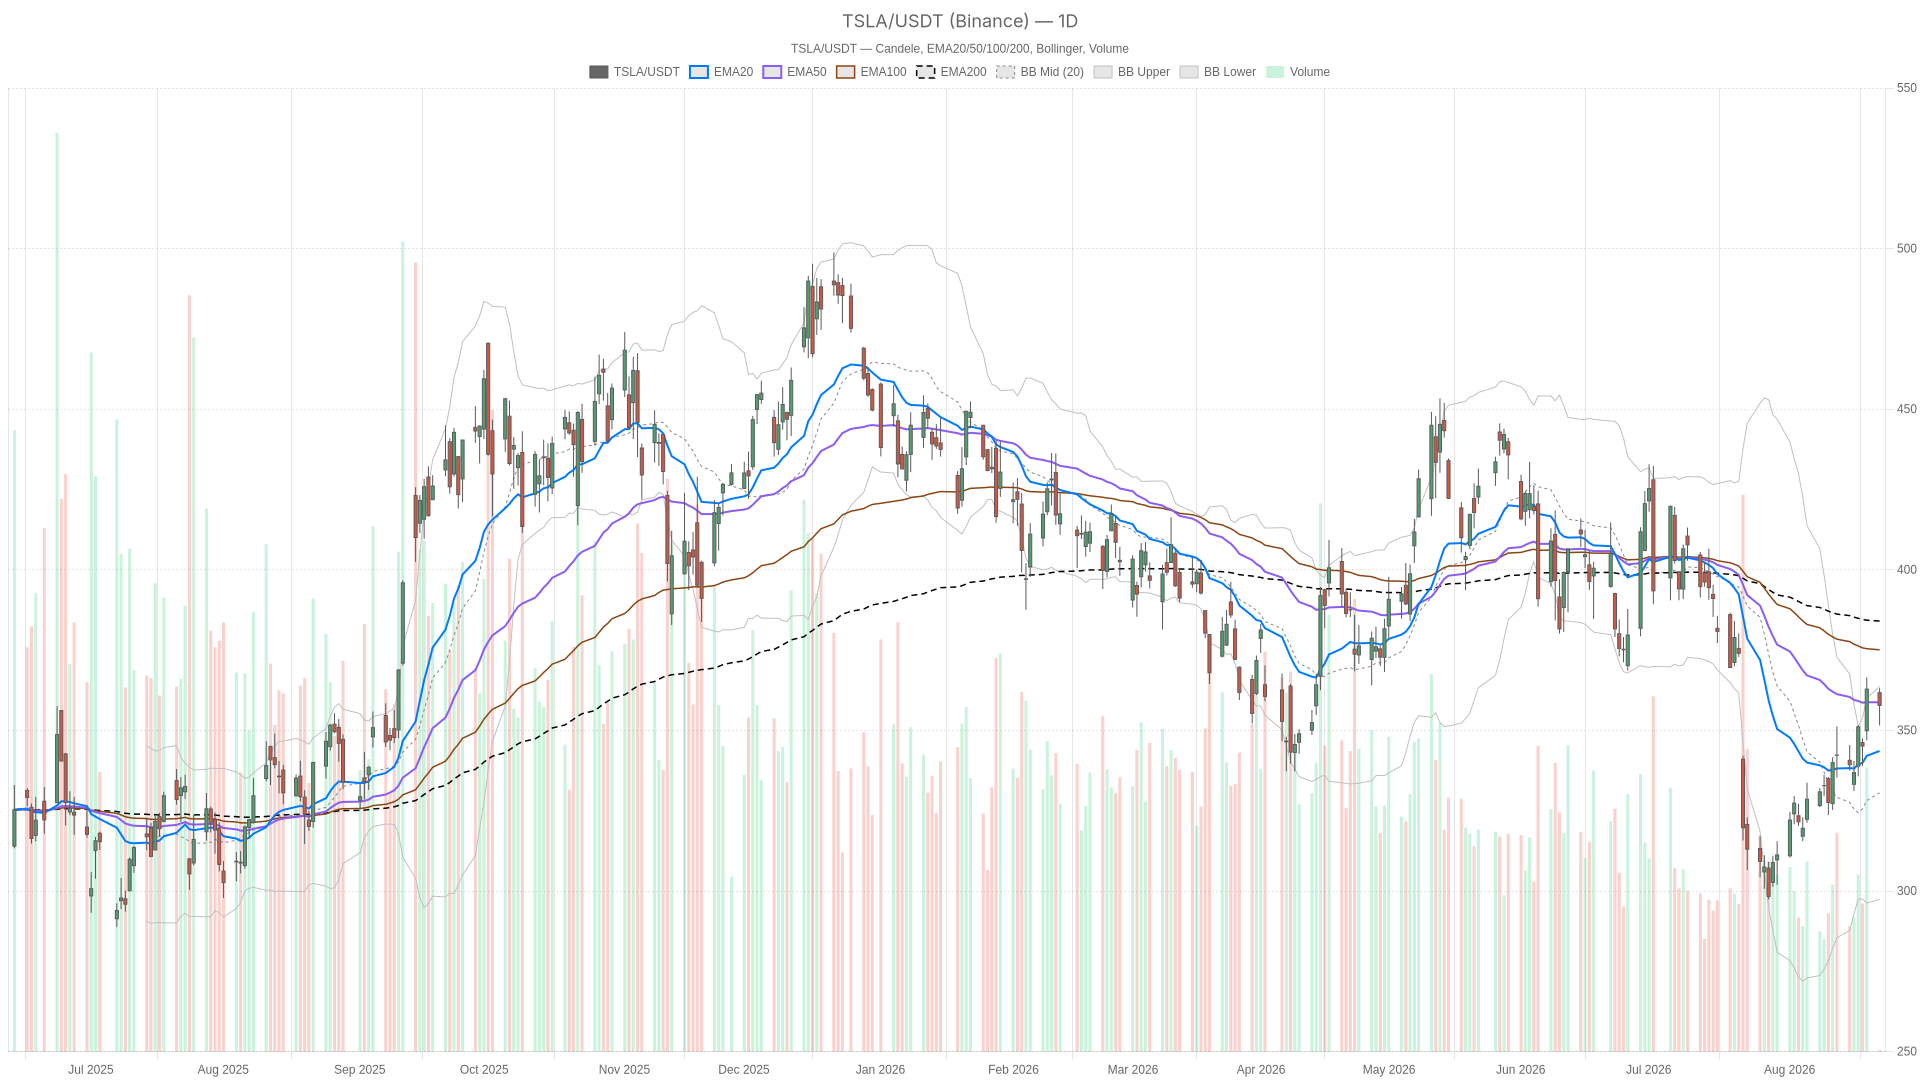
The session closed at 357.78 after printing a high of 363.13 and a low of 351.60. Price sits almost exactly on the daily pivot at 357.50, a level that often acts as an indecision magnet. The close holds above the 20-day EMA at 343.59. However, it remains below both the 50-day EMA at 358.74 and the 200-day EMA at 384.04. Short-term momentum has been reclaimed. Medium and long-term trend resistance still caps the stock.
Momentum and Volatility Signal Transition
The daily RSI at 55.38 is neutral-to-firm. It is neither overbought nor oversold. Instead, it reflects stabilization after a prior decline rather than a market stretched in either direction. The MACD tells a parallel story. Its line sits at -1.80, above the signal at -8.01. The histogram has turned positive at 6.20. That gap closing signals fading downside momentum, even though the trend has not flipped bullish on a strict signal-line basis.
Bollinger Bands add context. Price trades near the upper band at 363.69, well above the mid-band at 330.57. This shows recent strength relative to the broader range. At the same time, it means the stock is not far from stretched territory. The ATR14 reading of 11.71 confirms elevated volatility. Tesla stock has been moving in wide daily ranges rather than drifting quietly. Overall, the daily regime is best described as neutral — recovering but not yet trending.
Hourly Momentum Tells a Different Story for Tesla Stock
The hourly chart is clearly more constructive. Price sits above all three key moving averages on this timeframe — a textbook bullish alignment.
Tesla stock closed at 357.67 on the hourly chart. It holds above the 20-hour EMA at 353.57, the 50-hour EMA at 345.74, and the 200-hour EMA at 345.13. That stacked alignment confirms a short-term uptrend is in motion. The hourly RSI at 58.78 supports the read, sitting comfortably above the midline without flashing overbought risk.
The hourly MACD reinforces the message. Its line at 5.20 sits above the signal at 4.90, with a modest positive histogram of 0.30. It is not an aggressive bullish push, but it is a genuine crossover. Price also holds above the hourly pivot at 356.65 and presses toward R1 resistance at 359.09.
This is where the two timeframes disagree. The daily chart shows a stock still boxed in below its 50-day and 200-day averages. Meanwhile, the hourly chart shows a stock that has already broken into a short-term uptrend within that larger range. Tesla stock is attempting a recovery on lower timeframes. However, it has not yet proven itself on the higher timeframe that defines the broader trend.
15-Minute Chart: Momentum Cools Without Breaking the Trend
The 15-minute tape adds nuance rather than resolution. Very short-term momentum is cooling, but the hourly trend remains intact.
Price at 357.67 trades below the 20-period EMA at 358.97. Still, it holds above the 50-period EMA at 355.53 and the 200-period EMA at 344.24. The 15-minute RSI at 48.24 sits just under the midline. Notably, the MACD histogram has turned negative at -1.55, with the line at 0.01 crossing below its signal at 1.56.
Therefore, the very short-term tape is cooling off even as the hourly trend stays constructive. This looks more like a pause or shallow pullback within the broader hourly move — not a reversal signal. For timing purposes, the 15-minute Bollinger mid-band at 361.44 and lower band at 353.14 frame the near-term range. The key battleground remains the hourly pivot cluster, roughly 355.22 to 359.09.
What’s Driving Tesla Stock: Robotaxi News and Market Crosscurrents
The fundamental backdrop is mixed but not alarming. Broader market pressure, not Tesla-specific trouble, is weighing on the tape.
Tesla stock slid alongside softness in the S&P 500 and Nasdaq. Markets are positioning ahead of the Bessent briefing and Nvidia’s earnings release. That pressure is market-wide, not isolated to Tesla.
On the company side, Citizens reiterated a Market Perform rating on Tesla stock following robotaxi approval. The stance is cautious but not negative. Separately, the latest safety data from Tesla’s robotaxi rollout has been described as impressive. Still, some analysis frames the stock as a Hold based on the broader data set. Tesla also maintained its majority share of the U.S. EV market in the second quarter. However, that dominance has not extended as clearly outside the U.S.
On a longer horizon, some analysis argues Tesla stock still has room to run into 2027. The growth potential lies in full self-driving, energy, and AI businesses despite near-term challenges.
Bullish Scenario for Tesla Stock
The bull case depends on the hourly structure continuing to lead the daily chart higher. A break above key resistance would meaningfully shift the technical picture.
If Tesla stock holds above the hourly EMA cluster near 345 to 353, the next step is clearing R1 resistance at 359.09. After that, the daily 50-EMA at 358.74 and the daily high zone near 363 come into play. A daily close above the 50-EMA would strengthen the bullish argument considerably. Positive follow-through on robotaxi-related news could provide the fundamental catalyst. One analyst has already reiterated approval, supporting the technical breakout case.
Bearish Scenario and What Invalidates the Setup
The bearish risk is equally clear. The daily chart still shows price below both the 50-day and 200-day EMAs. That ceiling has not been broken.
If Tesla stock fails at the 358 to 363 resistance band and slips back below the daily EMA20 at 343.59, the recent bounce would look more like a relief rally inside a larger downtrend. A break below the daily pivot support at 351.88 would be especially damaging. If paired with the hourly regime flipping neutral or bearish, the near-term bullish setup would be invalidated. That would open the door toward retesting lower support near the Bollinger mid-band at 330.57.
Closing Take: Tesla Stock at an Inflection Point
Tesla stock sits at a genuine inflection point across timeframes. Conflicting signals suggest a market still searching for confirmation rather than one already committed to a trend.
The daily chart remains neutral, caught between a recovering short-term trend and unresolved medium-term resistance. The hourly chart is more constructive. The 15-minute tape shows momentum cooling in the immediate term. Given elevated ATR readings on both daily and hourly charts, volatility is likely to persist regardless of direction. Positioning should account for that uncertainty.
FAQ
Is Tesla stock bullish or bearish right now?
The daily chart is neutral, with Tesla stock boxed below the 50-day and 200-day EMAs but holding above the 20-day EMA. The hourly chart is more constructive, showing price above all three hourly moving averages. This conflict across timeframes means the stock is at an inflection point, not yet committed to a clear direction.
What are the key resistance levels for Tesla stock?
Key resistance sits at the daily 50-EMA of 358.74 and the R1 pivot at 359.09, with the daily high zone near 363 as the next target. A daily close above the 50-EMA would meaningfully strengthen the bullish case.
What would invalidate the bullish setup?
A failure at the 358–363 resistance band followed by a drop below the daily EMA20 at 343.59 would suggest the bounce is a relief rally inside a larger downtrend. A break below daily pivot support at 351.88, especially if paired with the hourly regime turning bearish, would invalidate the near-term bullish case and open the door toward 330.57.
What news is moving Tesla stock today?
Tesla stock is trading amid broader market softness ahead of Nvidia earnings and the Bessent briefing. On the company-specific side, Citizens reiterated a Market Perform rating following robotaxi approval, while safety data from the robotaxi rollout has been described as impressive. Tesla also maintained its majority share of the U.S. EV market in the second quarter.
Disclaimer: This article is for informational purposes only and does not constitute financial advice, an investment recommendation, or a solicitation to buy or sell any financial instrument or cryptocurrency. The analysis provided is not indicative of future results. Investing in crypto assets and financial markets carries a high risk of capital loss. Always do your own research (DYOR) and consult a qualified financial advisor before making any decision.
Article produced with the assistance of artificial intelligence and reviewed by the editorial team.
