

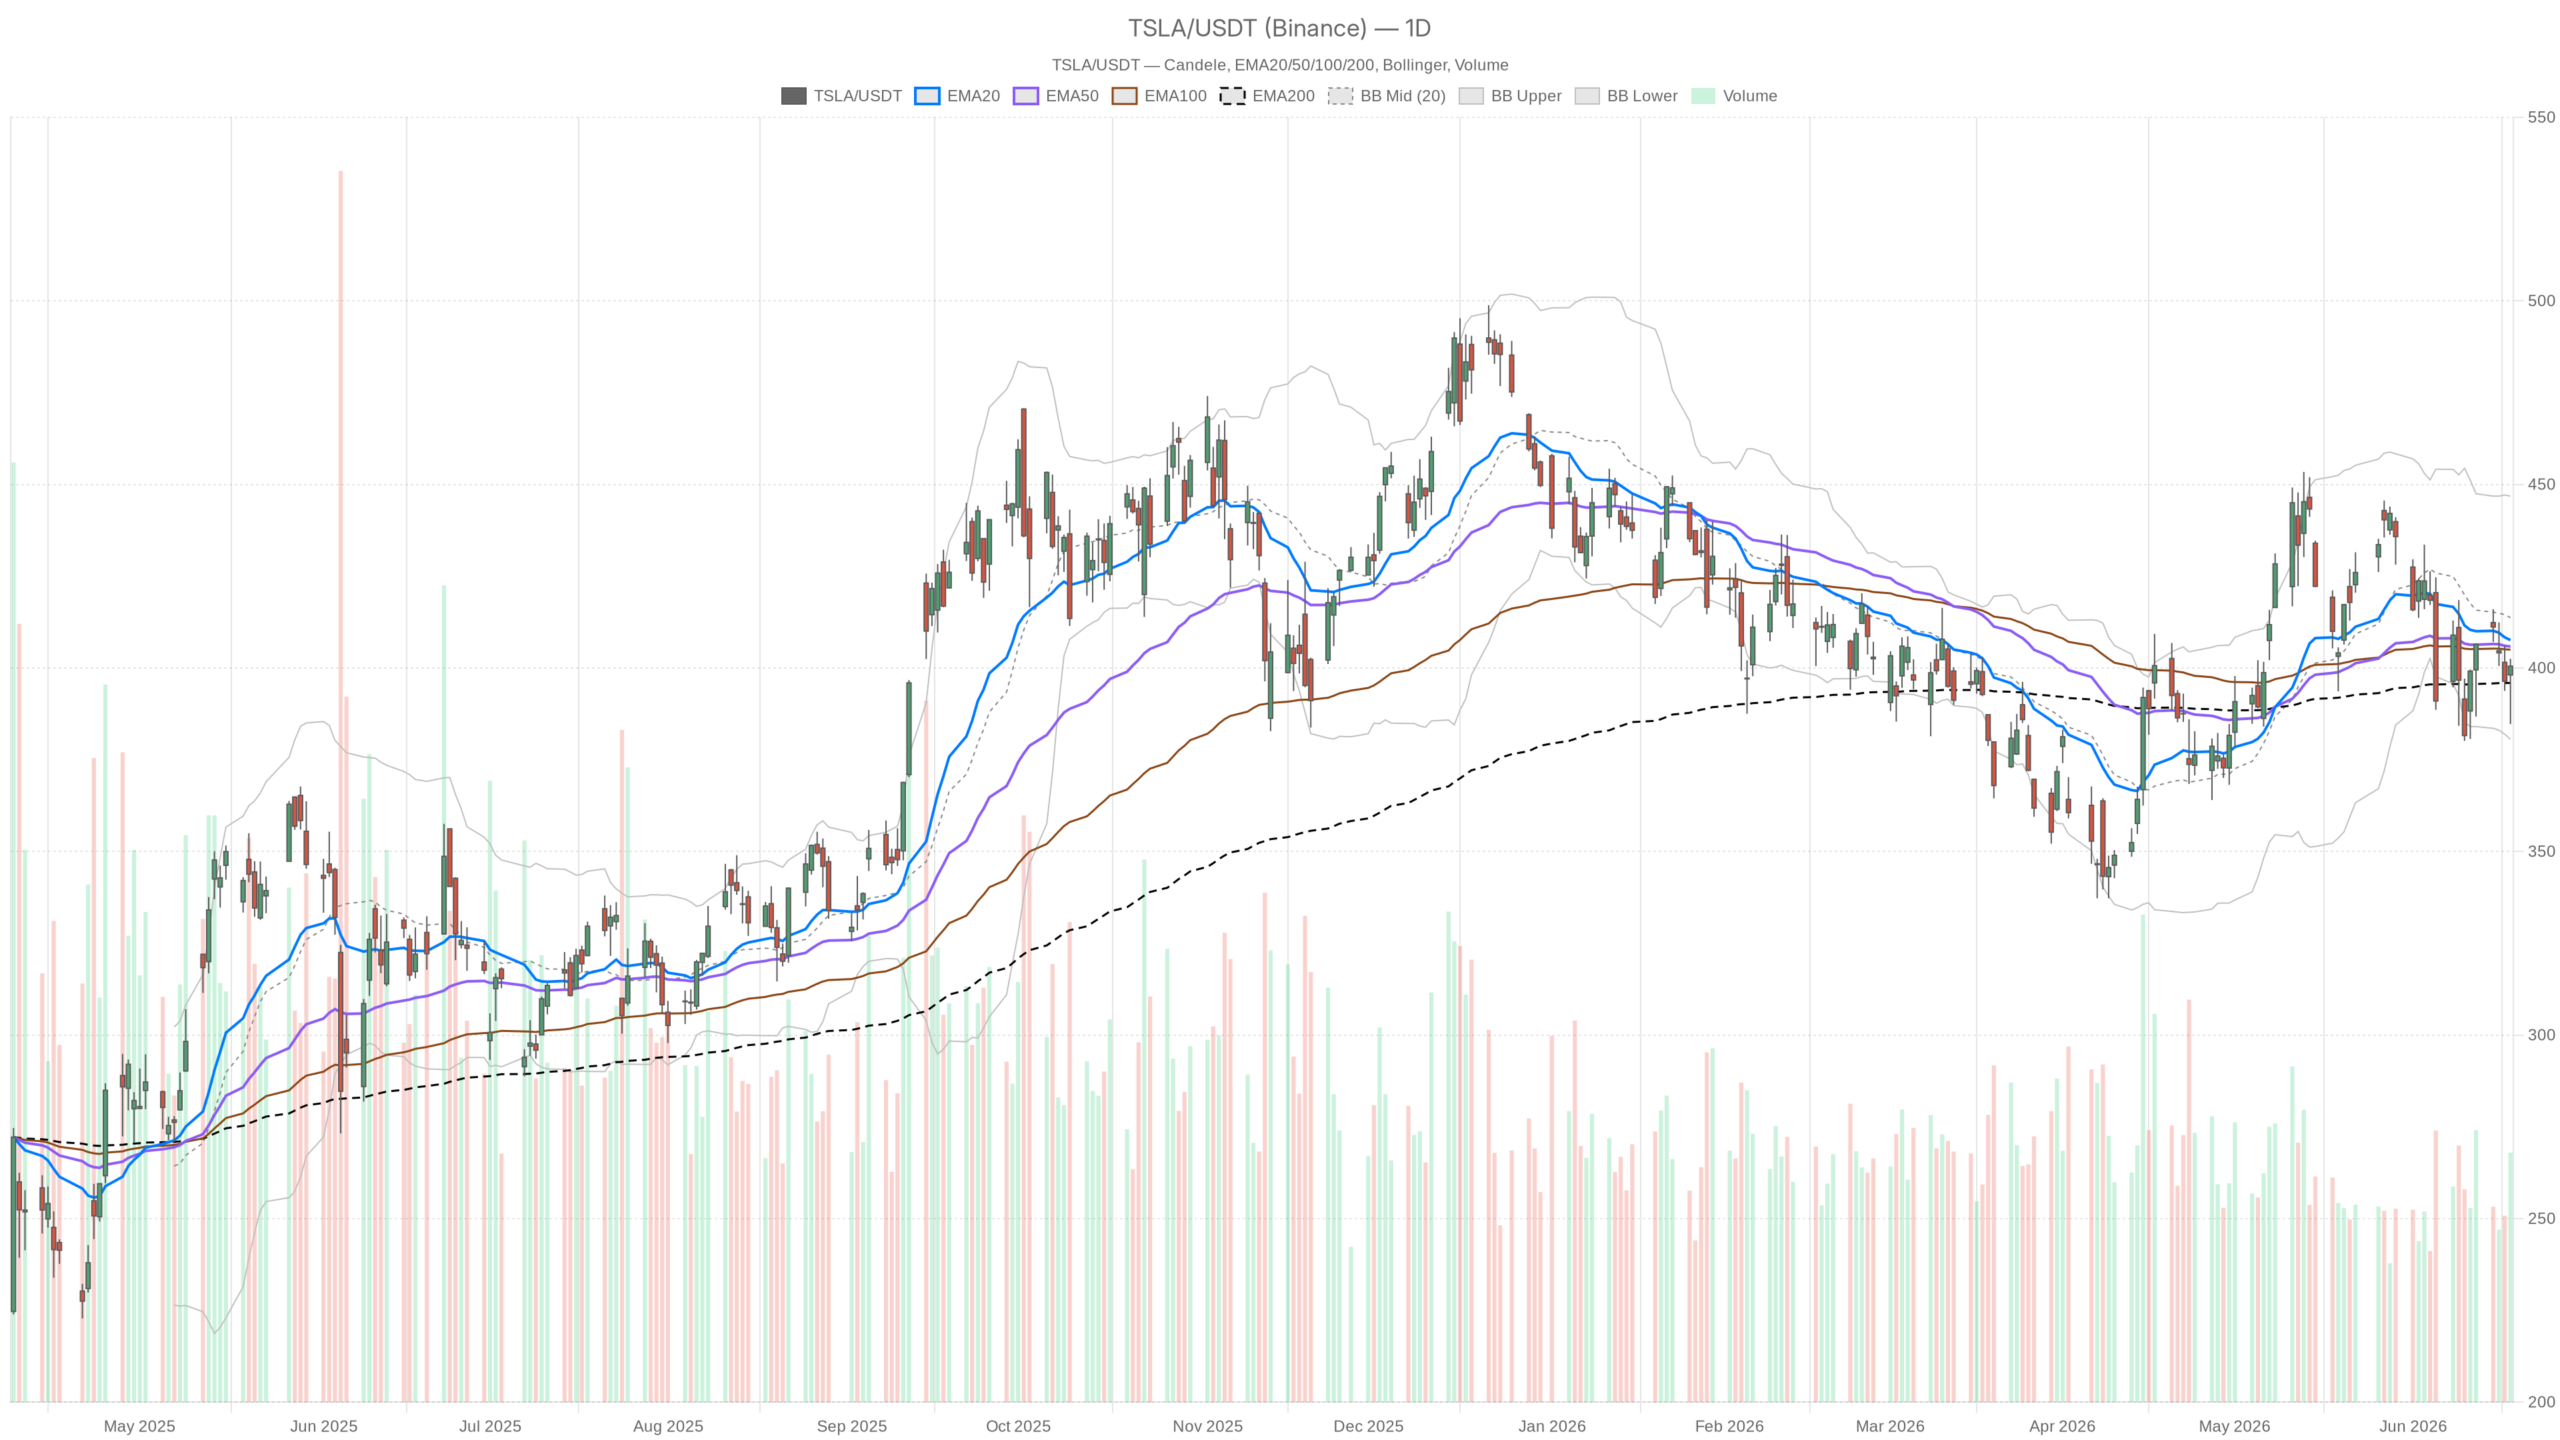
Tesla stock closed at $400.49 on June 18, holding above the $395–$396 support band but beneath declining daily moving averages. The regime across all three timeframes reads neutral — yet the technical structure leans modestly bearish, with fundamental headwinds adding pressure. This is a stock in a standoff.
Summary
Key takeaways
- TSLA closed at $400.49, sandwiched between daily EMA200 support at $395.93 and EMA20/EMA50 resistance near $407.
- Daily RSI at 47.03 and a widening negative MACD histogram confirm sellers retain the edge on the daily chart.
- The 15-minute chart shows a short-term bullish surge, but the daily trend structure remains firmly bearish.
- FSD regulatory headwinds in Europe and rising capex estimates add fundamental pressure to the stock.
- A daily close above $407–$408 is needed to flip the short-term structure bullish; a breakdown below $395.93 opens the door to $380.
Daily Technical Structure: Tesla Stock Remains Under Pressure
Tesla stock is trading beneath its short- and medium-term moving averages on the daily chart, with momentum indicators confirming a bearish bias. Price sits below both the EMA20 and EMA50 while clinging to long-term EMA200 support. This configuration leaves the stock vulnerable to further downside.
Moving average sandwich keeps TSLA in check
Specifically, the daily EMA20 sits at $407.60 and the EMA50 at $405.84 — both above the current price of $400.49. However, the EMA200 at $395.93 lies just below, offering dynamic support. TSLA is effectively sandwiched between long-term support and shorter-term resistance. That is not a position of strength.
Momentum indicators point to seller control
The daily RSI14 at 47.03 sits below the neutral 50 threshold — not oversold, but clearly lacking bullish energy. Meanwhile, the MACD tells a more concerning story. The MACD line is at -2.85, the signal at -0.50, and the histogram at -2.35. The widening negative histogram points to deteriorating momentum rather than stabilization.
Volatility and pivot levels define the range
In addition, Bollinger Bands place the mid-band at $413.70, with the upper band at $446.81 and the lower band at $380.58. Price at $400.49 is tracking below the mid-band — a configuration that favors continued downside pressure. The ATR14 of $18.39 reflects a wide daily range environment, meaning roughly $18 of average true range. Daily pivot analysis shows the pivot at $395.90, R1 at $407.11, and S1 at $389.29. TSLA currently trades between its pivot and R1, but the moving average structure above makes R1 a difficult ceiling to clear.
Intraday Signals: Short-Term Bounce Meets Medium-Term Resistance
The 15-minute chart shows the most bullish reading across all three timeframes. However, the 1-hour chart confirms that the medium-term downtrend remains intact. This timeframe conflict creates a classic short-term tactical bounce against a bearish daily backdrop.
1-hour chart: stabilization without reversal
Price closed the last hourly candle at $400.43, above the 1H EMA20 at $398.23 and near the EMA50 at $400.68. The 1H EMA200, however, sits at $407.70 — well above current price. The 1H RSI at 51.97 is marginally above neutral, providing a slight bullish lean in the very short term. Notably, the 1H MACD line at -1.92 with a histogram of -0.27 suggests downward momentum has slowed but not reversed. The signal is stabilizing, not recovering.
15-minute chart: tactical bounce, not a durable shift
The M15 MACD histogram is positive at 0.95, and the RSI stands at 66.05 — approaching overbought territory on that short timeframe. Price at $400.43 is trading above the M15 EMA20 at $395.27 and EMA50 at $396.74. This short-term momentum surge suggests buyers have been active during the most recent session. However, price is testing just above the upper Bollinger Band at $399.77 and sits at R1 of $402.54 — both potential resistance points. This intraday strength likely reflects a near-term tactical bounce rather than a durable directional shift.
Fundamental Landscape: FSD and Spending Concerns Cloud Tesla Stock’s Outlook
Regulatory friction around Full Self-Driving in Europe and rising capex estimates are adding fundamental uncertainty to Tesla stock’s already fragile technical position. These headwinds strike at the core of Tesla’s long-term valuation thesis.
Notably, Sweden’s opposition to EU-wide approval for Tesla’s FSD system is a significant regulatory hurdle. The Swedish Transport Administration reportedly urged rejection of FSD in its current form. This could delay Tesla’s autonomous driving ambitions in a key European market. FSD monetization sits at the heart of Tesla’s valuation narrative, and any regulatory friction in Europe chips away at that story.
At the same time, Seeking Alpha’s recent downgrade of TSLA to a hold highlights a cautious institutional tone. Oppenheimer reiterated its rating while raising capex estimates — a move that reflects confidence in investment activity but also signals higher spending ahead. That is a mixed message for near-term margins.
Bullish and Bearish Scenarios for TSLA
The bullish scenario requires a closing reclaim of the $407–$408 zone, while the bearish case targets a breakdown below the daily EMA200 at $395.93. Current positioning makes the bearish scenario more immediately credible.
For bulls, TSLA would need to reclaim the EMA20 and EMA50 on the daily chart on a closing basis. A sustained move above those averages would flip the short-term EMA structure bullish. It would also give the daily MACD a chance to roll upward. Positive FSD news from EU regulators or stronger-than-expected delivery data could reinforce a technical breakout. R1 at $407.11 on the daily pivot would serve as the first confirmation level.
On the bearish side, a daily close below the EMA200 at $395.93 — and particularly below daily S1 at $389.29 — would represent a meaningful breakdown. The lower Bollinger Band at $380.58 would then become the key downside target. Persistent FSD regulatory setbacks in Europe, combined with margin compression from rising capex, would accelerate any technical breakdown. The widening MACD histogram on the daily chart is already pointing in that direction.
FAQ
What is the current technical outlook for Tesla stock?
Tesla stock is in a neutral-to-bearish technical position. Price closed at $400.49, holding above the daily EMA200 at $395.93 but trading below the EMA20 at $407.60 and EMA50 at $405.84. The daily RSI at 47.03 and widening negative MACD histogram confirm sellers retain the edge.
What are the key support and resistance levels for TSLA?
Key support sits at the daily EMA200 of $395.93, followed by the daily S1 pivot at $389.29 and the lower Bollinger Band at $380.58. Resistance is concentrated in the $407–$408 zone, where the daily EMA20, EMA50, and R1 pivot converge.
What fundamental factors are weighing on Tesla stock right now?
Sweden’s opposition to EU-wide FSD approval creates regulatory uncertainty around Tesla’s autonomous driving monetization. Additionally, Seeking Alpha downgraded TSLA to a hold, and Oppenheimer raised capex estimates — signaling higher spending ahead that could pressure near-term margins.
What needs to happen for TSLA to turn bullish?
TSLA needs a sustained daily close above the $407–$408 zone to reclaim its short-term moving averages. Positive catalysts such as favorable FSD regulatory developments in Europe or stronger-than-expected delivery numbers could reinforce a technical breakout.
Disclaimer: This article is for informational purposes only and does not constitute financial advice, an investment recommendation, or a solicitation to buy or sell any financial instrument or cryptocurrency. The analysis provided is not indicative of future results. Investing in crypto assets and financial markets carries a high risk of capital loss. Always do your own research (DYOR) and consult a qualified financial advisor before making any decision.
Article produced with the assistance of artificial intelligence and reviewed by the editorial team.