




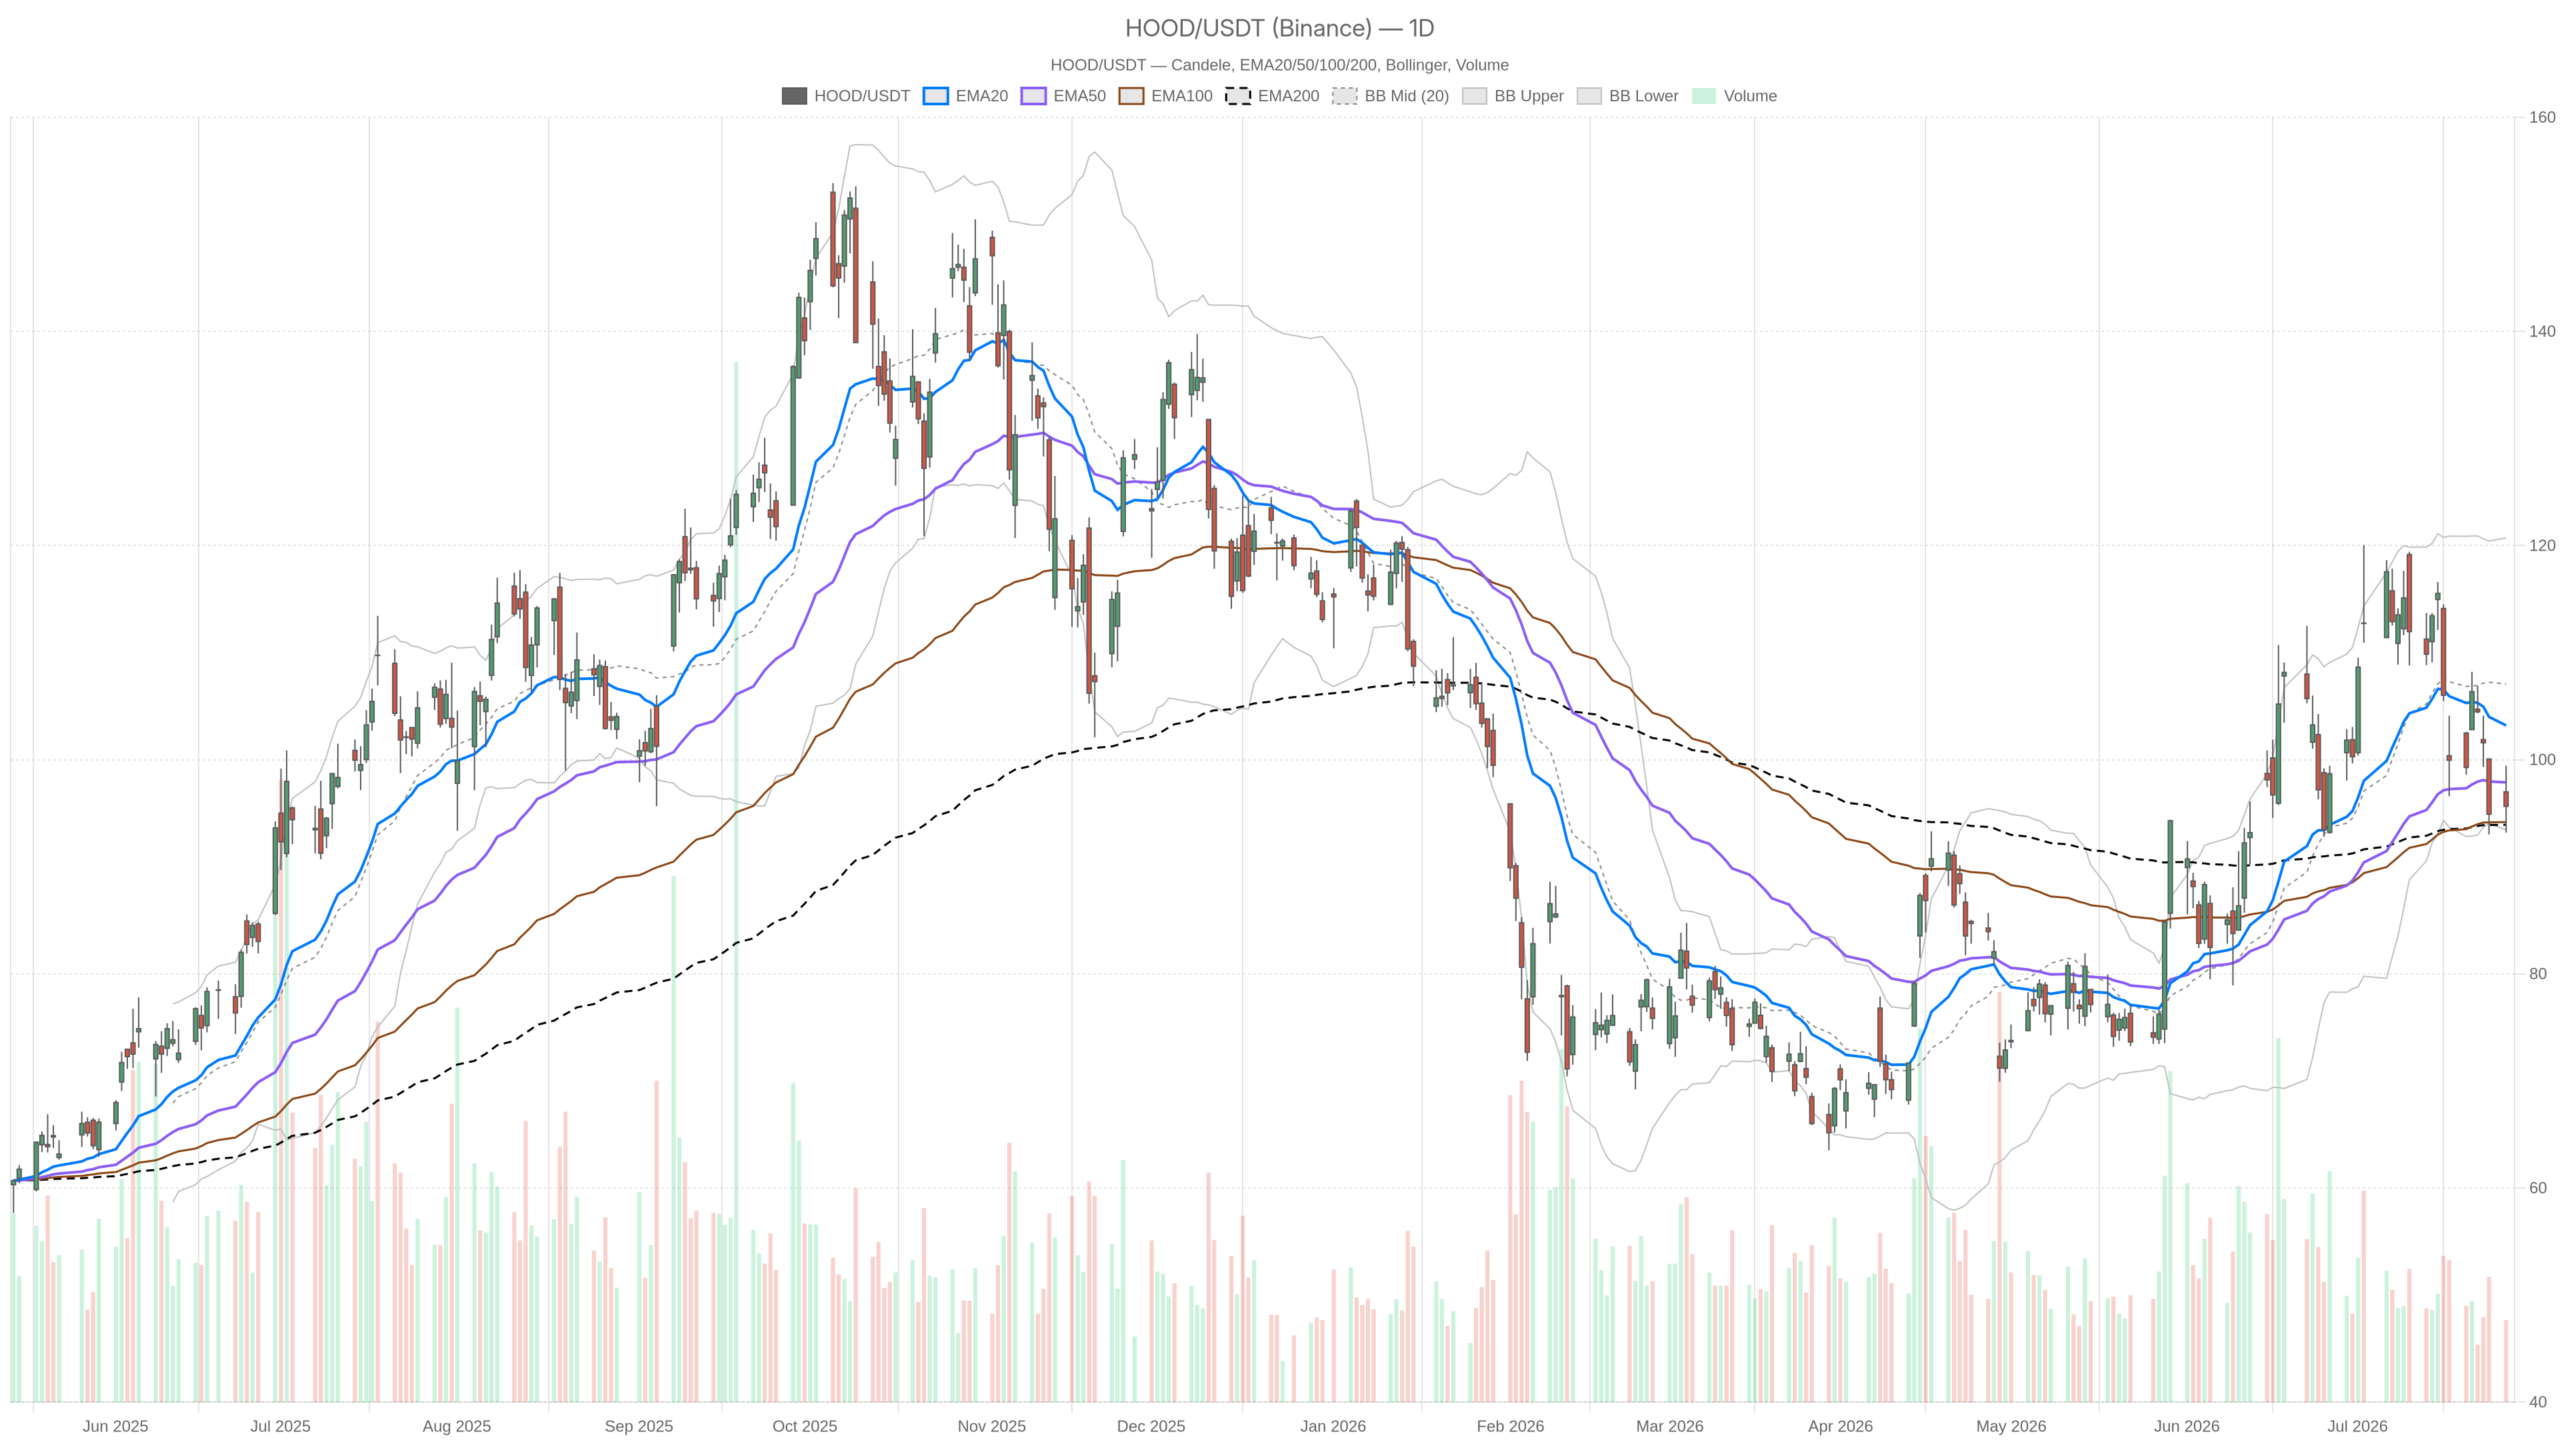
Robinhood stock enters Q2 earnings week in a technically vulnerable position. HOOD closed at $95.65 on July 27, below both the EMA20 at $103.20 and EMA50 at $97.88. Strong blockchain metrics — including $600M in chain deposits — compete against mounting selling pressure ahead of the July 29 report.
Summary
Key takeaways
- Robinhood stock closed at $95.65 on July 27, below its daily pivot of $96.10
- Daily RSI14 at 43.24 and MACD histogram at -2.49 confirm bearish momentum
- Robinhood Chain surpassed $600M in deposits, rising 50% in a single week
- The EMA200 at $93.92 serves as the critical support floor ahead of earnings
- A break below $92.75 would signal a structural breakdown for HOOD shares
Daily Timeframe: Robinhood Stock Structure Is Deteriorating
Robinhood stock’s daily structure is technically neutral, yet most internal signals point toward caution. The RSI14 reads 43.24 — below the midline and trending lower. The MACD histogram sits at -2.49, with the MACD line at 0.34 well below the signal line at 2.82. That separation signals genuine momentum behind the recent downtrend.
Meanwhile, HOOD is pressing near the lower Bollinger Band at $93.44. The midband rests at $107.08 and the upper band at $120.72. This places the stock in the lower quarter of its volatility envelope. Contrarian buyers may find that attractive. However, a break lower becomes likely if support fails. The ATR14 at $6.48 underscores meaningful daily volatility — especially around an earnings event.
Pivot analysis adds further precision. The daily pivot sits at $96.10, with R1 at $99.00 and S1 at $92.75. HOOD closed just below the pivot at $95.65. A close above $99 would shift short-term structure more constructively. Below $92.75, the next meaningful support becomes the EMA200 at $93.92. Notably, the EMA200 has held as a floor so far.
Hourly Timeframe Confirms the Bearish Lean
The hourly chart offers no relief for Robinhood stock, with an explicitly bearish regime in place. Price at $95.66 trades below all three key EMAs. The EMA20 sits at $97.05, the EMA50 at $100.92, and the EMA200 at $102.09. This full bearish EMA stack is a structurally weak configuration that reinforces the daily reading.
However, the hourly MACD provides one small offsetting detail. The histogram has turned slightly positive at 0.15. The MACD line at -2.30 is beginning to close toward the signal at -2.45. This is a minor developing cross, not a confirmed reversal. At best, it suggests the selling pace is slowing. It falls short of calling a trend change.
Meanwhile, the hourly RSI14 sits at 39.62 — near oversold territory but not quite there. That proximity could support a short-term bounce if earnings surprise positively. The 1H pivot rests at $95.59, with R1 at $95.92 and S1 at $95.34. HOOD hugged the pivot level at the 15:30 close, signaling consolidation before the next directional move.
15-Minute Timeframe Shows Tentative Stabilization
The 15-minute chart for Robinhood stock shifts to neutral, offering tentative signs of stabilization ahead of earnings. The RSI14 climbed to 56.85, holding above the midline. The MACD histogram is positive at 0.23, and the line is attempting to cross above the signal. Price at $95.66 has pushed above both the 15m EMA20 at $94.86 and the Bollinger midband at $94.52.
In contrast, the 15m EMA200 at $101.36 remains a distant overhead reference. The 15m ATR at $0.53 reflects tight intraday compression. Such a coil often precedes a sharper move. For short-term traders, the 15m context suggests HOOD may stabilize near $95.50–$95.84 before the Q2 catalyst arrives.
Fundamental Picture: Strong Metrics, Ambiguous Price Signal
Robinhood stock faces an unusual situation: fundamentals are improving while the chart deteriorates. Robinhood Chain has surpassed $600M in deposits, rising 50% in a single week. It ranks third by weekly app fees at $25M. Tokenized stocks on the chain have jumped fivefold. A potential partnership with Crypto.com to expand prediction markets adds further optionality to the business model.
Yet Seeking Alpha captures the tension precisely: strong chain metrics, but the stock is weak. Ahead of Q2 earnings, analysts point to strong trading growth offset by weak crypto activity. Rising costs and a premium valuation compound the uncertainty. This makes the July 29 print a high-stakes event, not a straightforward catalyst.
Bullish Scenario: Earnings Could Trigger Recovery for HOOD
A bullish case for Robinhood stock exists, but it requires fundamental follow-through from the Q2 report. If earnings confirm accelerating revenue from trading growth and blockchain fee momentum, HOOD has room to recover toward the $97–$99 range. Reclaiming the EMA50 at $97.88 and breaking above the daily R1 at $99 would mark the first structural improvement. A sustained hold above $99 would shift the daily bias toward constructive territory.
Notably, supporting factors are already in place. The EMA200 has held at $93.92 as a floor. The lower Bollinger Band provides a natural base near $93.44. The 1H MACD histogram has begun ticking positive. Chain metrics above $600M and the prediction markets expansion could reframe the narrative — if management guides for accelerating monetization.
Bearish Scenario for Robinhood Stock: Support at Risk
The bearish case for Robinhood stock is straightforward: disappointing earnings would leave limited technical protection. A close below $92.75 — the daily S1 — and through the EMA200 at $93.92 would mark a significant structural breakdown. The lower Bollinger Band at $93.44 would likely give way. The next downside reference sits much further below, given the daily ATR of $6.48.
Overall, the full bearish EMA stack on the 1H chart argues the path of least resistance is lower. The below-midline daily RSI and the significantly negative MACD histogram reinforce this read. Rising costs and a premium valuation, already flagged by analysts, could amplify any negative earnings reaction.
Positioning and Volatility: Earnings Dominate the HOOD Setup
Robinhood stock enters Q2 earnings in a technically compromised position across multiple timeframes. The daily structure has deteriorated meaningfully in recent sessions. The hourly view confirms the bearish lean. Only the 15-minute chart offers any immediate stabilization signal. Volatility is elevated — the daily ATR of $6.48 against a price of $95.65 represents roughly a 7% average daily range.
Therefore, positioning ahead of Tuesday’s earnings carries substantial risk in both directions. The fundamental news flow is genuinely mixed. Blockchain metrics are impressive. However, cost pressures and valuation concerns are equally real. HOOD is a stock where the charts and the headlines tell different parts of the same complicated story.
FAQ
What is the key technical level for Robinhood stock ahead of Q2 earnings?
The EMA200 at $93.92 and the daily S1 at $92.75 form the critical support zone. A close below both would signal a structural breakdown. The daily R1 at $99.00 is the key resistance to reclaim for any bullish shift.
When does Robinhood report Q2 earnings?
Robinhood reports Q2 earnings on July 29. The results are expected to clarify whether strong trading growth can offset weak crypto activity and rising costs.
What are the strongest fundamental catalysts for HOOD right now?
Robinhood Chain has surpassed $600M in deposits, rising 50% in a single week, and ranks third by weekly app fees at $25M. Tokenized stocks on the chain have jumped fivefold. A potential Crypto.com partnership adds further optionality to the business model.
Disclaimer: This article is for informational purposes only and does not constitute financial advice, an investment recommendation, or a solicitation to buy or sell any financial instrument or cryptocurrency. The analysis provided is not indicative of future results. Investing in crypto assets and financial markets carries a high risk of capital loss. Always do your own research (DYOR) and consult a qualified financial advisor before making any decision.
Article produced with the assistance of artificial intelligence and reviewed by the editorial team.
