



Micron stock fell 5% on Monday after CXMT’s blockbuster Shanghai IPO surpassed a $500 billion valuation. MU closed at $900.20, down from $932.45. After a near-700% rally, is this a correction or a deeper unwind?
Summary
Key takeaways
- MU dropped 5% to $900.20 after CXMT‘s Shanghai IPO surpassed a $500 billion valuation, rattling the memory sector.
- Daily MACD at -14.80 with a histogram of -7.29 signals accelerating bearish momentum, not a passive drift.
- RSI at 45.63 sits below the 50 midline, confirming a shift away from bullish control.
- The 200-day EMA at $584.73 remains structurally intact, but the near-term bias is neutral-to-bearish.
- A daily close above the 50-day EMA at $906.07 is the minimum requirement for bulls to regain control.
Micron Stock Pulls Back as CXMT’s Debut Rattles the Memory Sector
The 5% drop in Micron stock was triggered directly by CXMT’s blockbuster Shanghai IPO. The debut surpassed a $500 billion valuation and introduced fresh competitive uncertainty into the memory sector.
MU closed at $900.20, down sharply from its intraday open of $932.45. After a near-700% rally over the past year, the market is now asking whether this is a healthy correction or the start of a more meaningful unwind.
Daily Bias: Neutral Territory With Bearish Undertones
The daily bias for Micron stock is cautiously neutral with a growing bearish undertone. Price sits below the 20-day EMA. Accelerating MACD momentum confirms the deterioration is not a passive drift.
EMA Structure and Momentum Deterioration
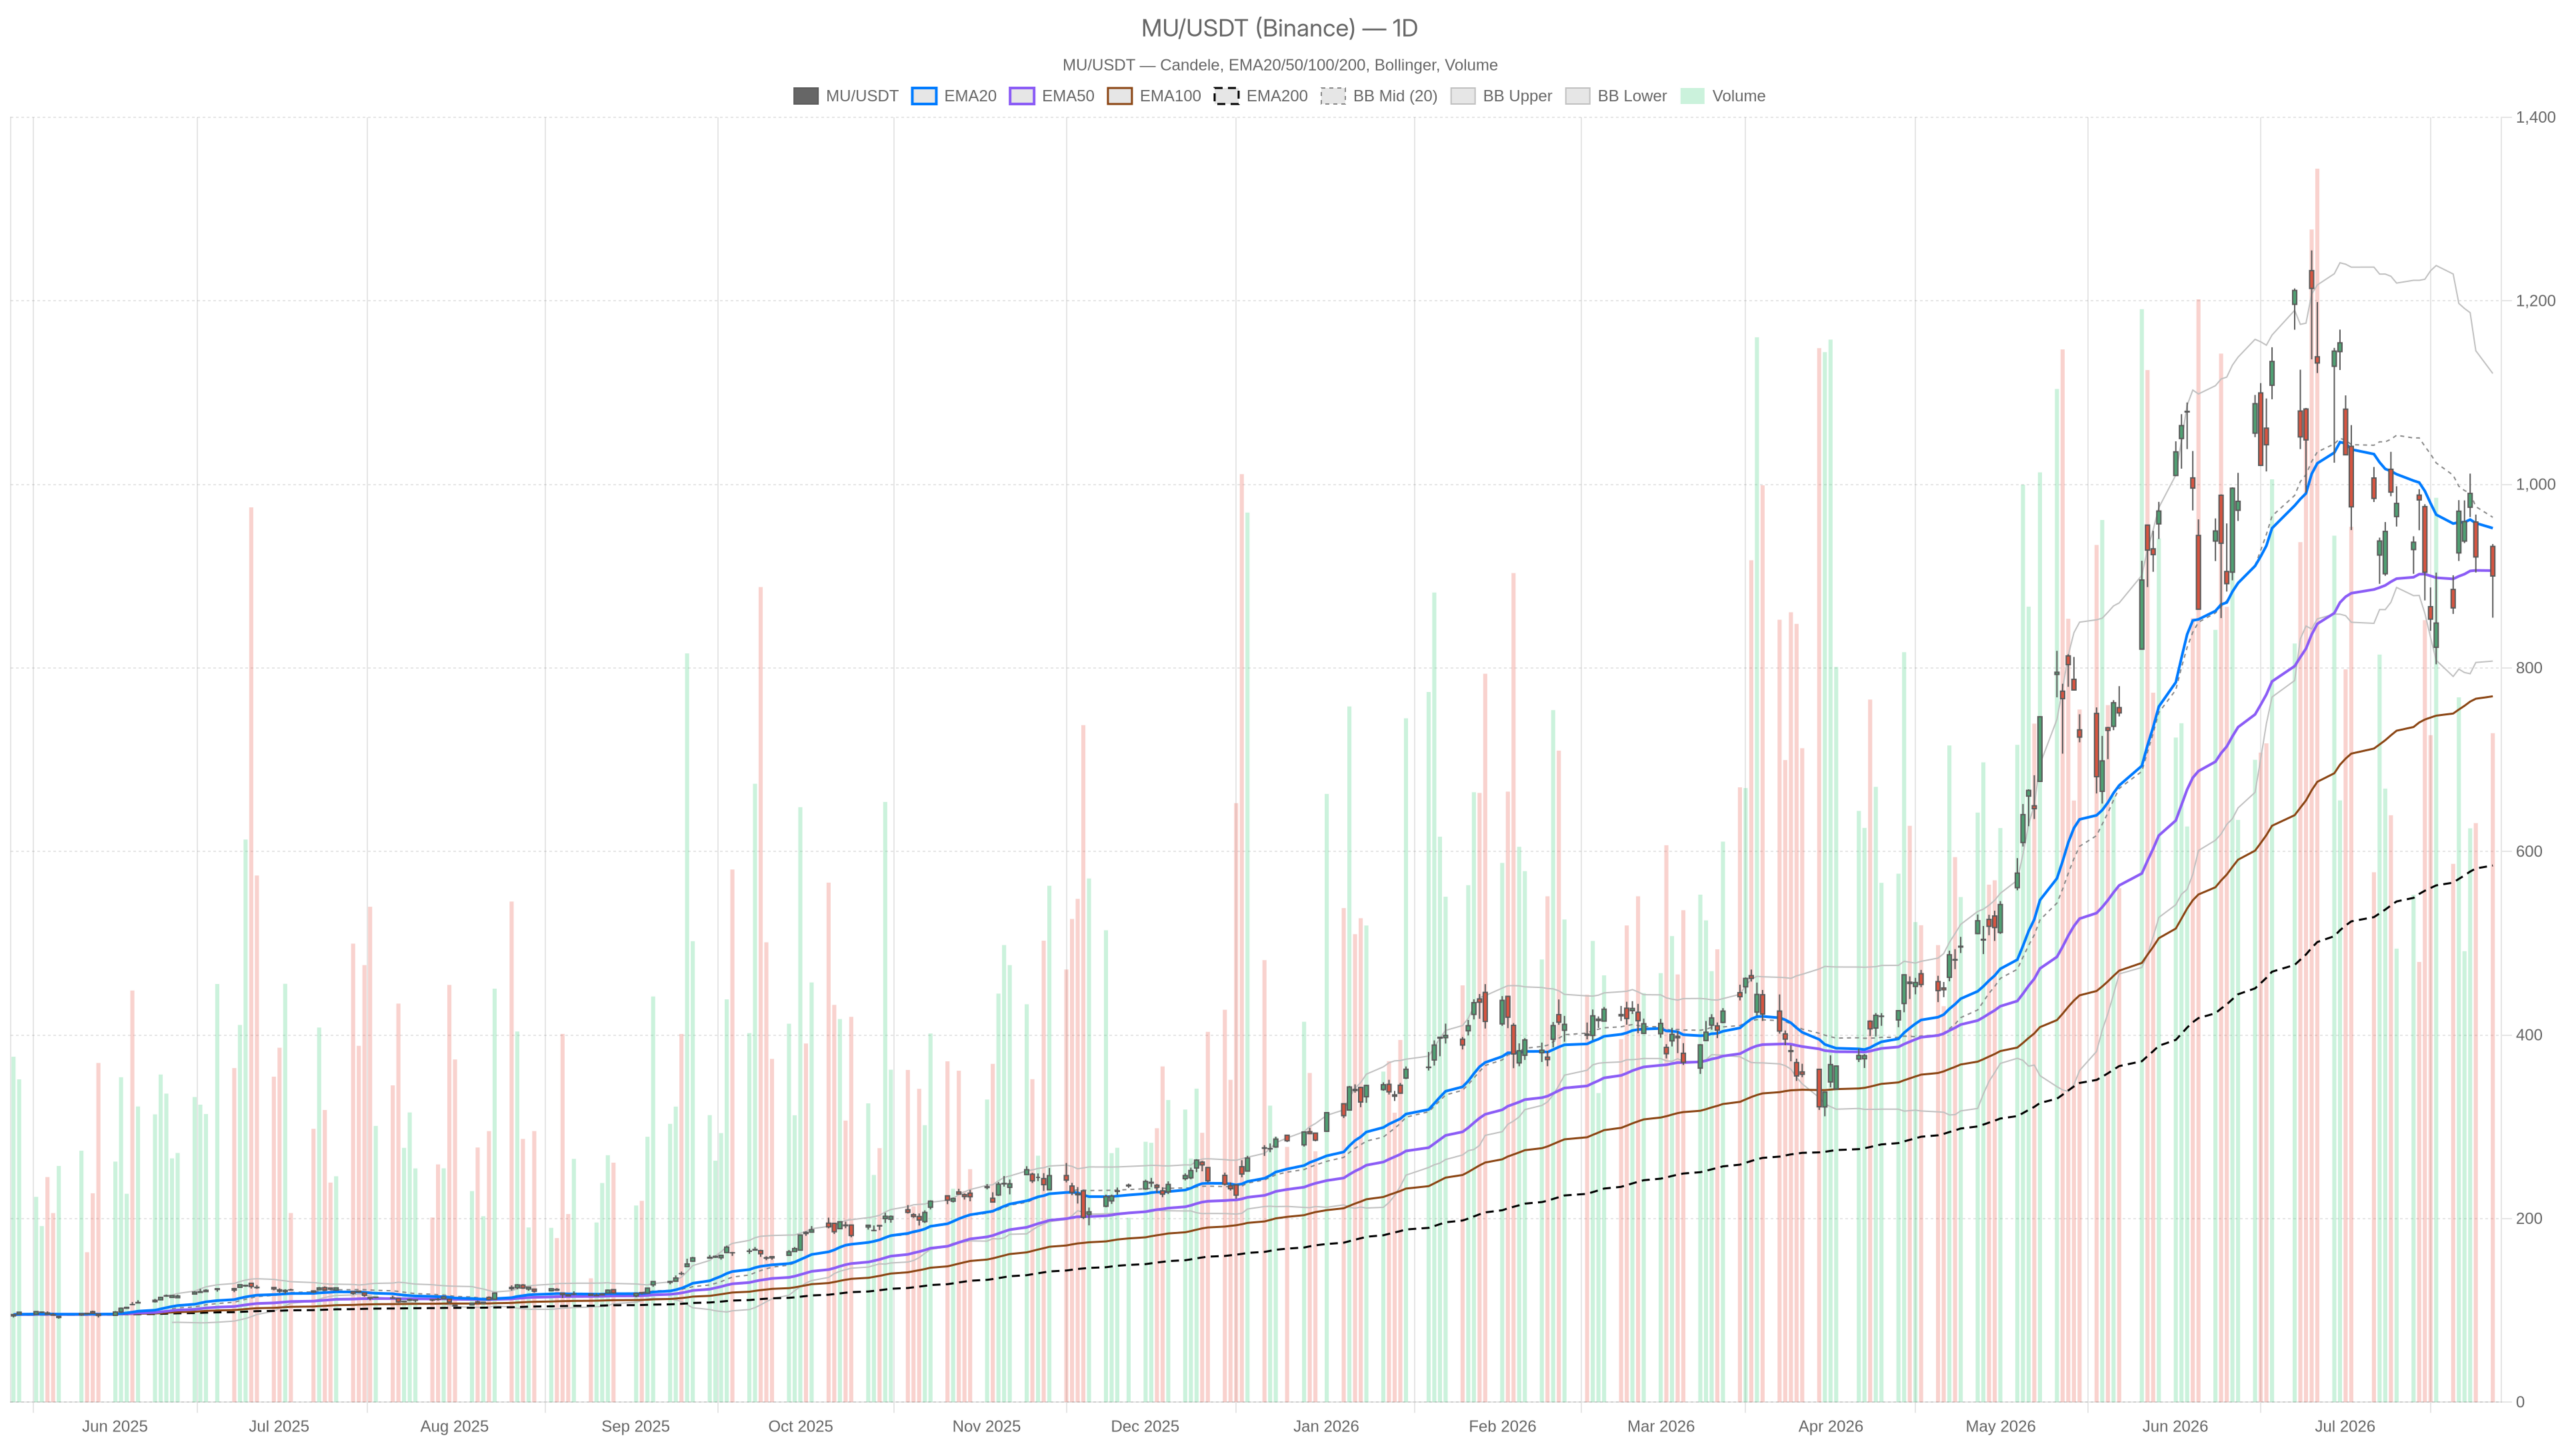
On the daily frame, MU closed at $900.20, below its 20-day EMA of $952.35. That level must be recaptured to reassert short-term bullish control. The 50-day EMA at $906.07 provided intraday resistance. The close barely beneath it keeps sellers in charge. Meanwhile, the 200-day EMA at $584.73 remains distant. It serves as a structural reminder of how extended this rally has been.
The MACD on the daily frame sits at -14.80 against a signal of -7.51, producing a histogram of -7.29. This configuration points to accelerating bearish momentum. It is not a neutral drift. It is a directional deterioration.
Meanwhile, RSI at 45.63 reinforces the picture. The reading has slipped below the 50 midline, signaling a shift from bullish control to contested ground. MU is not in oversold territory by any standard metric. There is room for further downside without a mechanical bounce being triggered.
Volatility Context and Pivot Levels
At the same time, Bollinger Bands show a midline at $964.20. The lower band sits at $807.52. The close at $900.20 places price well below the midline and drifting toward the lower half of the channel. The daily ATR of 73.69 confirms a high-volatility environment. Any move carries significant range potential. Pivot analysis sets the daily PP at $896.66, with R1 at $938.54 and S1 at $858.33. The close marginally above the pivot is the only constructive signal in an otherwise weakened daily setup.
Hourly Confirmation: Bearish Regime Validates the Selling Pressure
The hourly chart confirms bearish pressure without ambiguity. Price sits below all three key EMAs in a stacked bearish configuration, meaning every bounce faces layered resistance.
Notably, price at $900.96 sits below the 20-hour EMA at $915.98, the 50-hour at $929.22, and the 200-hour at $965.20. Buyers face an uphill battle at each successive level.
The hourly MACD mirrors the daily deterioration. The line at -17.51 versus a signal of -12.47 produces a histogram of -5.04. Still negative, but compressing slightly. That compression does not signal a reversal yet. It does suggest the momentum of selling may be moderating. RSI at 43.84 stays below 50, consistent with the bearish regime. Overall, the hourly picture corroborates the daily weakness.
The 15-Minute Frame: A Short-Term Bounce Emerging
The 15-minute chart shows an intraday relief bounce in motion. Price closed at $900.96, above the 20-period EMA at $888.49 and pushing above the Bollinger upper band at $900.32. The MACD histogram has turned positive at +4.68. The line at -2.39 has crossed above the signal at -7.07. RSI has recovered to 56.12, clearing the 50 midline.
However, this 15-minute recovery is execution context only. It is not a directional reversal. The broader daily and hourly regimes remain structurally weak. Short-term traders may find tactical long setups near current levels. Still, the structural weight of the daily and hourly regimes limits conviction for any sustained push higher.
The Fundamental Backdrop: Hyperscaler Tailwinds vs. China Competition Risk
The fundamental picture is mixed. Hyperscaler AI spending tailwinds remain intact, but CXMT’s debut introduces a competitive risk the market is now repricing. MU benefits from hyperscaler capital expenditure cycles. High-bandwidth memory — the chips powering Nvidia’s AI accelerators — remains dominated by established leaders such as Micron. That structural demand story has not disappeared.
However, analyst commentary has flagged that recent memory price gains have been driven more by pricing power than raw demand growth. That distinction matters for sustainability. The CXMT IPO introduces a new variable. China’s domestic memory ambitions are accelerating. While the immediate threat to Micron’s HBM crown appears limited, the market is right to reassess the long-term competitive landscape. At a valuation reached after a near-700% rally, investors have little margin for error if the narrative shifts.
Scenarios: What Bulls and Bears Need to See
Bulls need a daily close above the 50-day EMA at $906.07 to regain control. Bears hold the advantage as long as price stays below that level and MACD continues deteriorating.
For bulls, the key recovery trigger goes beyond the 50-day EMA. A sustained push through the $938.54 R1 pivot level would strengthen the case. Reclaiming the 20-day EMA at $952.35 would reestablish short-term trend control. On the fundamental side, confirmation that CXMT’s HBM threat is contained would provide fresh justification for the premium valuation. The structural uptrend anchored by the 200-day EMA at $584.73 remains intact. The AI-driven memory supercycle thesis has not been invalidated by one day of selling.
On the bearish side, failure to hold the daily pivot at $896.66 on a closing basis opens the door to S1 at $858.33. Given the daily ATR of 73.69, that level could be reached quickly in a risk-off session. Below $858, the lower Bollinger Band at $807.52 becomes the next meaningful support.
The bearish scenario strengthens if the hourly EMA stack continues repelling recovery attempts. A prolonged stay below $906 while the MACD diverges deeper into negative territory would confirm this is not a simple shakeout. It would signal a substantive trend reversal at the cycle highs.
Positioning and Volatility: Caution Commands the Moment
Micron stock sits in a high-volatility, technically compromised position. The daily ATR of nearly $74 and the hourly ATR of $27 mean stop placement requires a meaningful buffer. Position sizing should reflect that reality.
The 15-minute bounce offers short-term traders a potential entry window. However, the broader context demands discipline. The daily regime is neutral leaning bearish. The hourly regime is explicitly bearish. Until the daily MACD reverses and RSI reclaims the 50 level with conviction, risk-reward for aggressive long exposure is not favorable. The CXMT catalyst has introduced structural uncertainty. The market will take time to fully digest it. This is a moment for measured positioning — not a moment to chase.
FAQ
What caused Micron stock to drop 5% on Monday?
ChangXin Memory Technologies (CXMT), China’s leading domestic chipmaker, staged a blockbuster IPO on the Shanghai exchange that surpassed a $500 billion valuation. The debut sent shockwaves through the memory sector, triggering immediate competitive repricing and pushing MU down 5% to $900.20.
What are the key support levels for MU stock?
The immediate support is the daily pivot at $896.66. Below that, S1 sits at $858.33, and the lower Bollinger Band provides a deeper floor at $807.52. A failure to hold $896.66 on a closing basis would open the door to a rapid test of lower levels, given the elevated daily ATR of 73.69.
What would confirm a bullish reversal for Micron stock?
A daily close above the 50-day EMA at $906.07 is the minimum requirement. A sustained push through the R1 pivot at $938.54 would strengthen the bull case. Reclaiming the 20-day EMA at $952.35 would reestablish short-term trend control.
Is the long-term uptrend in Micron stock still intact?
Yes. The 200-day EMA at $584.73 remains structurally intact, and the broader AI-driven memory supercycle thesis has not been invalidated by a single day of selling. However, the near-700% rally means valuation risk is elevated, and investors have limited margin for error if the competitive narrative shifts.
Disclaimer: This article is for informational purposes only and does not constitute financial advice, an investment recommendation, or a solicitation to buy or sell any financial instrument or cryptocurrency. The analysis provided is not indicative of future results. Investing in crypto assets and financial markets carries a high risk of capital loss. Always do your own research (DYOR) and consult a qualified financial advisor before making any decision.
Article produced with the assistance of artificial intelligence and reviewed by the editorial team.
