

Tesla shares closed the session on 16 June 2026 at $404.66, down 1.58%. The stock is moving in a precarious balance. The daily MACD is negative and the price is struggling above the key exponential moving averages. Neither buyers nor sellers have yet taken control.
Summary
Key points
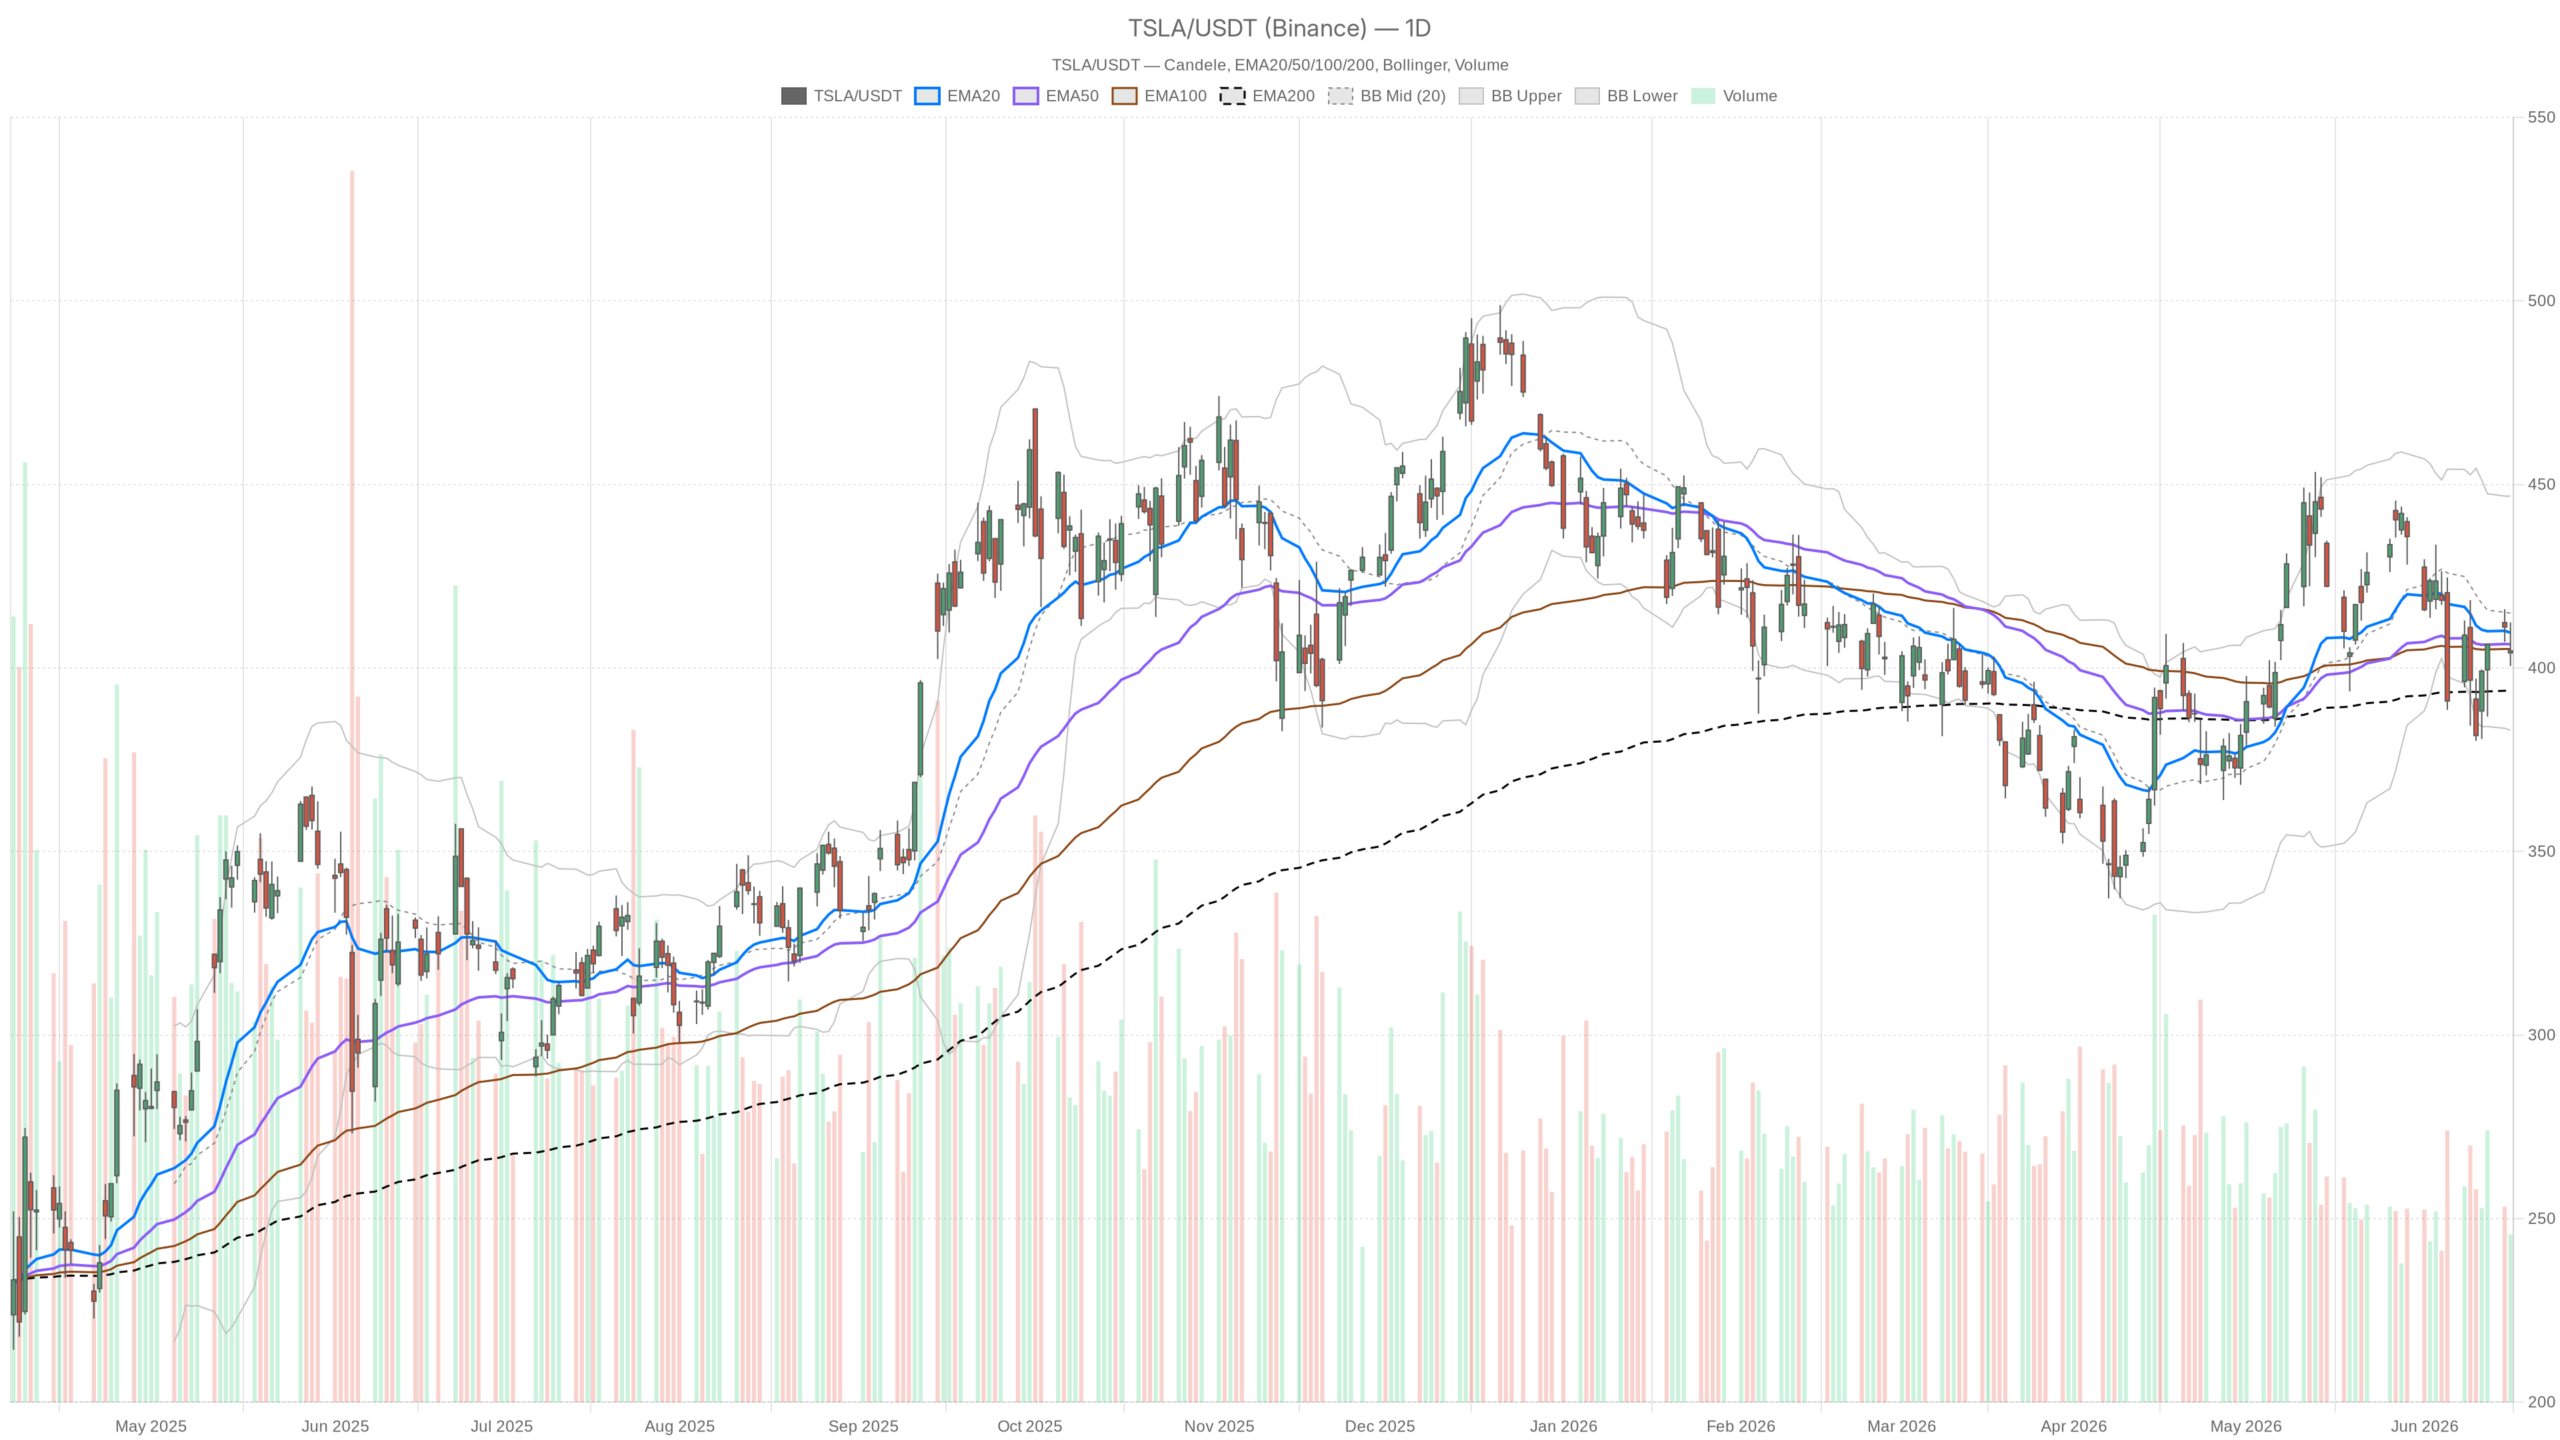
- TSLA closes at $404.66, below the daily EMA20 at 409.60 and close to the EMA50 at 406.45
- The daily MACD falls to -1.87 with histogram at -2.62: short-term momentum is deteriorating convincingly
- The pivot point at 405.87 is the first directional watershed; support S1 at 399.33 represents the critical level to defend
- On the 15-minute timeframe the RSI falls to 44.29, signaling the strongest bearish pressure in the entire multi-timeframe structure
- The daily EMA200 at $393.89 remains the long-term structural support: a break below it would radically change the picture
The daily picture: tension beneath the surface
The daily regime classified as “neutral” hides real tension. The price at $404.66 is already below the EMA20 at 409.60 and very close to the EMA50 at 406.45. It is not yet below the EMA50, but it is gravitating around it. This positioning indicates that the medium-term uptrend is losing energy. However, the stock remains solidly above the EMA200 at 393.89, excluding for now a structural reversal.
The most significant data point is the daily MACD. The MACD line falls to -1.87, already below zero, while the signal remains positive at 0.76. The histogram at -2.62 shows a growing divergence. In other words: momentum is deteriorating convincingly. It is not a signal of an immediate crash, but it indicates that selling pressure has become dominant in recent sessions.
The RSI at 48.22 reinforces this reading. Just below the neutrality threshold at 50, it is in slightly weak territory but far from oversold conditions. Tesla shares are not dropping violently: they are simply losing thrust.
Compressed volatility and pivot levels to monitor
The Bollinger Bands on the daily chart place the moving average at 414.92, well above the current price. TSLA is moving in the lower half of the channel, between the lower band at 383.04 and the average. This is not a panic selling signal, but it indicates that the stock has moved downward away from the equilibrium zone.
The ATR14 at $17.79 confirms still significant daily volatility. With a price around $404, an average range of almost 18 points per day makes the pivot levels fully operative. The pivot point at 405.87, resistance R1 at 411.21 and support S1 at 399.33 are all contained in a range that TSLA can cover in a few hours. The close at 404.66, slightly below the daily pivot, is a modestly bearish signal for the next session.
Hourly timeframe: momentum in transition
On the one-hour chart the picture changes shade. The short EMAs — EMA20 at 404.42 and EMA50 at 403.71 — are both below the hourly closing price of 404.67. The stock is trying to build a support base right in this area. However, the hourly EMA200 is at 409.08, much higher, and represents an important dynamic resistance. As long as TSLA does not reclaim that threshold, any rebound risks remaining a temporary technical move.
The hourly MACD shows active deterioration: line at 2.05, signal at 2.55 and negative histogram at -0.50. Compression is underway and the bullish momentum of the previous session is fading. The RSI at 51.83 remains just above neutrality. The market has not yet capitulated on the hourly timeframe, but it has not regained strength either.
The 15 minutes: short-term pressure and friction zone
The 15-minute timeframe provides the most immediate picture. The price at 404.67 is below the EMA20 at 405.82 and the EMA50 at 405.50, but above the EMA200 at 403.35. The latter has become the very short-term support: losing it would immediately open the way towards S1 at 403.31.
The RSI at 44.29 is the most bearish data point in the entire multi-timeframe structure. On this time horizon sellers clearly have more control. The MACD, although negative with line at -0.39, shows a slightly positive histogram at 0.13: an initial attempt at stabilization, not yet a reversal. The Bollinger Bands are very tight, with upper at 407.03 and lower at 403.96. The price is almost in the middle, in a compression that usually precedes a directional move.
Bullish scenario: levels to reclaim
For TSLA to reverse course in the short term, the first test is to reclaim the daily pivot at 405.87 with convincing volumes. Once that level is surpassed, the next resistance is the daily EMA50 at 406.45 and then the EMA20 at 409.60. The latter almost coincides with the hourly EMA200, creating a dense resistance zone between $409 and $411, which also includes the R1 of the daily pivot at 411.21.
On the indicator front, a bullish scenario would require the daily MACD to stop worsening, with the histogram rising back toward zero. A daily RSI stably above 50 would also be needed. On the fundamental side, the recent JPMorgan upgrade to “Neutral” with a revised target at $475 and the fair value estimate at $420.55 suggest that part of the market still sees potential. However, for these catalysts to translate into technical effects, chart stabilization is needed first.
Bearish scenario: levels to defend
The daily S1 support at $399.33 is the first critical downside level. A daily close below that threshold would significantly change the picture, opening room toward the daily EMA200 at 393.89, the stock’s major structural support. Below that average, the reading of the long-term trend would become genuinely worrying.
If the deterioration of the daily MACD were to accelerate, with the histogram moving toward -4 or -5, it would be a signal of institutional selling pressure that is hard to ignore. The daily Bollinger Bands still show room to the downside before touching the lower band at $383.04. Technically, TSLA could fall further without the bands signaling an oversold condition.
A stock on hold: descending center of gravity
The overall picture is that of a stock in a consolidation phase with a descending center of gravity. We are not in a structurally bearish trend: the daily EMA200 is holding and prices remain above the levels at the start of the year. But short-term momentum has clearly deteriorated and the multi-timeframe structure does not offer convincing signals of an immediate reversal.
The area between $403 and $406 is the short-term battleground. Traders are watching the holding of the daily pivot and the behavior of the hourly MACD: a rising positive histogram could signal a recovery. The fundamental context remains divided between those who fear excessive valuations and those betting on artificial intelligence and autonomous driving. On the chart, however, that match has not yet been decided. For now, TSLA is a stock on hold: neither crash nor breakout.
FAQ
What is the most important level to monitor for Tesla shares?
The daily pivot point at $405.87 is the first directional watershed. A reclaim with volumes would open the way toward $409–411, while a failure to hold it exposes the stock to S1 support at 399.33.
Is TSLA’s long-term trend at risk?
At the moment, no. The daily EMA200 at $393.89 is holding solidly and the price remains above the levels at the start of the year. Only a daily close below this average would call the structural trend into question.
What does the negative daily MACD indicate?
The daily MACD at -1.87 with histogram at -2.62 indicates that selling pressure has become dominant in the short term. It is not a signal of an immediate crash, but it suggests that momentum is deteriorating and that caution is needed.
{“@context”:”https://schema.org”,”@type”:”FAQPage”,”mainEntity”:[{“@type”:”Question”,”name”:”What is the most important level to monitor for Tesla shares?”,”acceptedAnswer”:{“@type”:”Answer”,”text”:”The daily pivot point at $405.87 is the first directional watershed. A reclaim with volumes would open the way toward $409–411, while a failure to hold it exposes the stock to S1 support at 399.33.”}},{“@type”:”Question”,”name”:”Is TSLA’s long-term trend at risk?”,”acceptedAnswer”:{“@type”:”Answer”,”text”:”At the moment, no. The daily EMA200 at $393.89 is holding solidly and the price remains above the levels at the start of the year. Only a daily close below this average would call the structural trend into question.”}},{“@type”:”Question”,”name”:”What does the negative daily MACD indicate?”,”acceptedAnswer”:{“@type”:”Answer”,”text”:”The daily MACD at -1.87 with histogram at -2.62 indicates that selling pressure has become dominant in the short term. It is not a signal of an immediate crash, but it suggests that momentum is deteriorating and that caution is needed.”}}]}
Disclaimer: This article is for informational purposes only and does not constitute financial advice, investment recommendation or a solicitation to buy or sell financial instruments or cryptocurrencies. The analyses do not guarantee future results. Investments in crypto-assets and financial markets involve a high risk of capital loss. Always do your own research (DYOR) and consult a qualified financial advisor before making any decision.
Content created with the assistance of artificial intelligence and with human editorial review.