

Roblox shares closed the June 16, 2026 session at $49.34, with a strong rebound from the intraday low at $45.90. The bounce was supported by solid volumes and positive news. The technical structure shows signs of strength, but the medium-term trend remains bearish. There is a recovery, but the road is still long.
Summary
Key points
- RBLX closed at $49.34 on June 16, recovering more than $3 from the session lows
- The volume of 13.9 million shares confirms real participation in the rebound
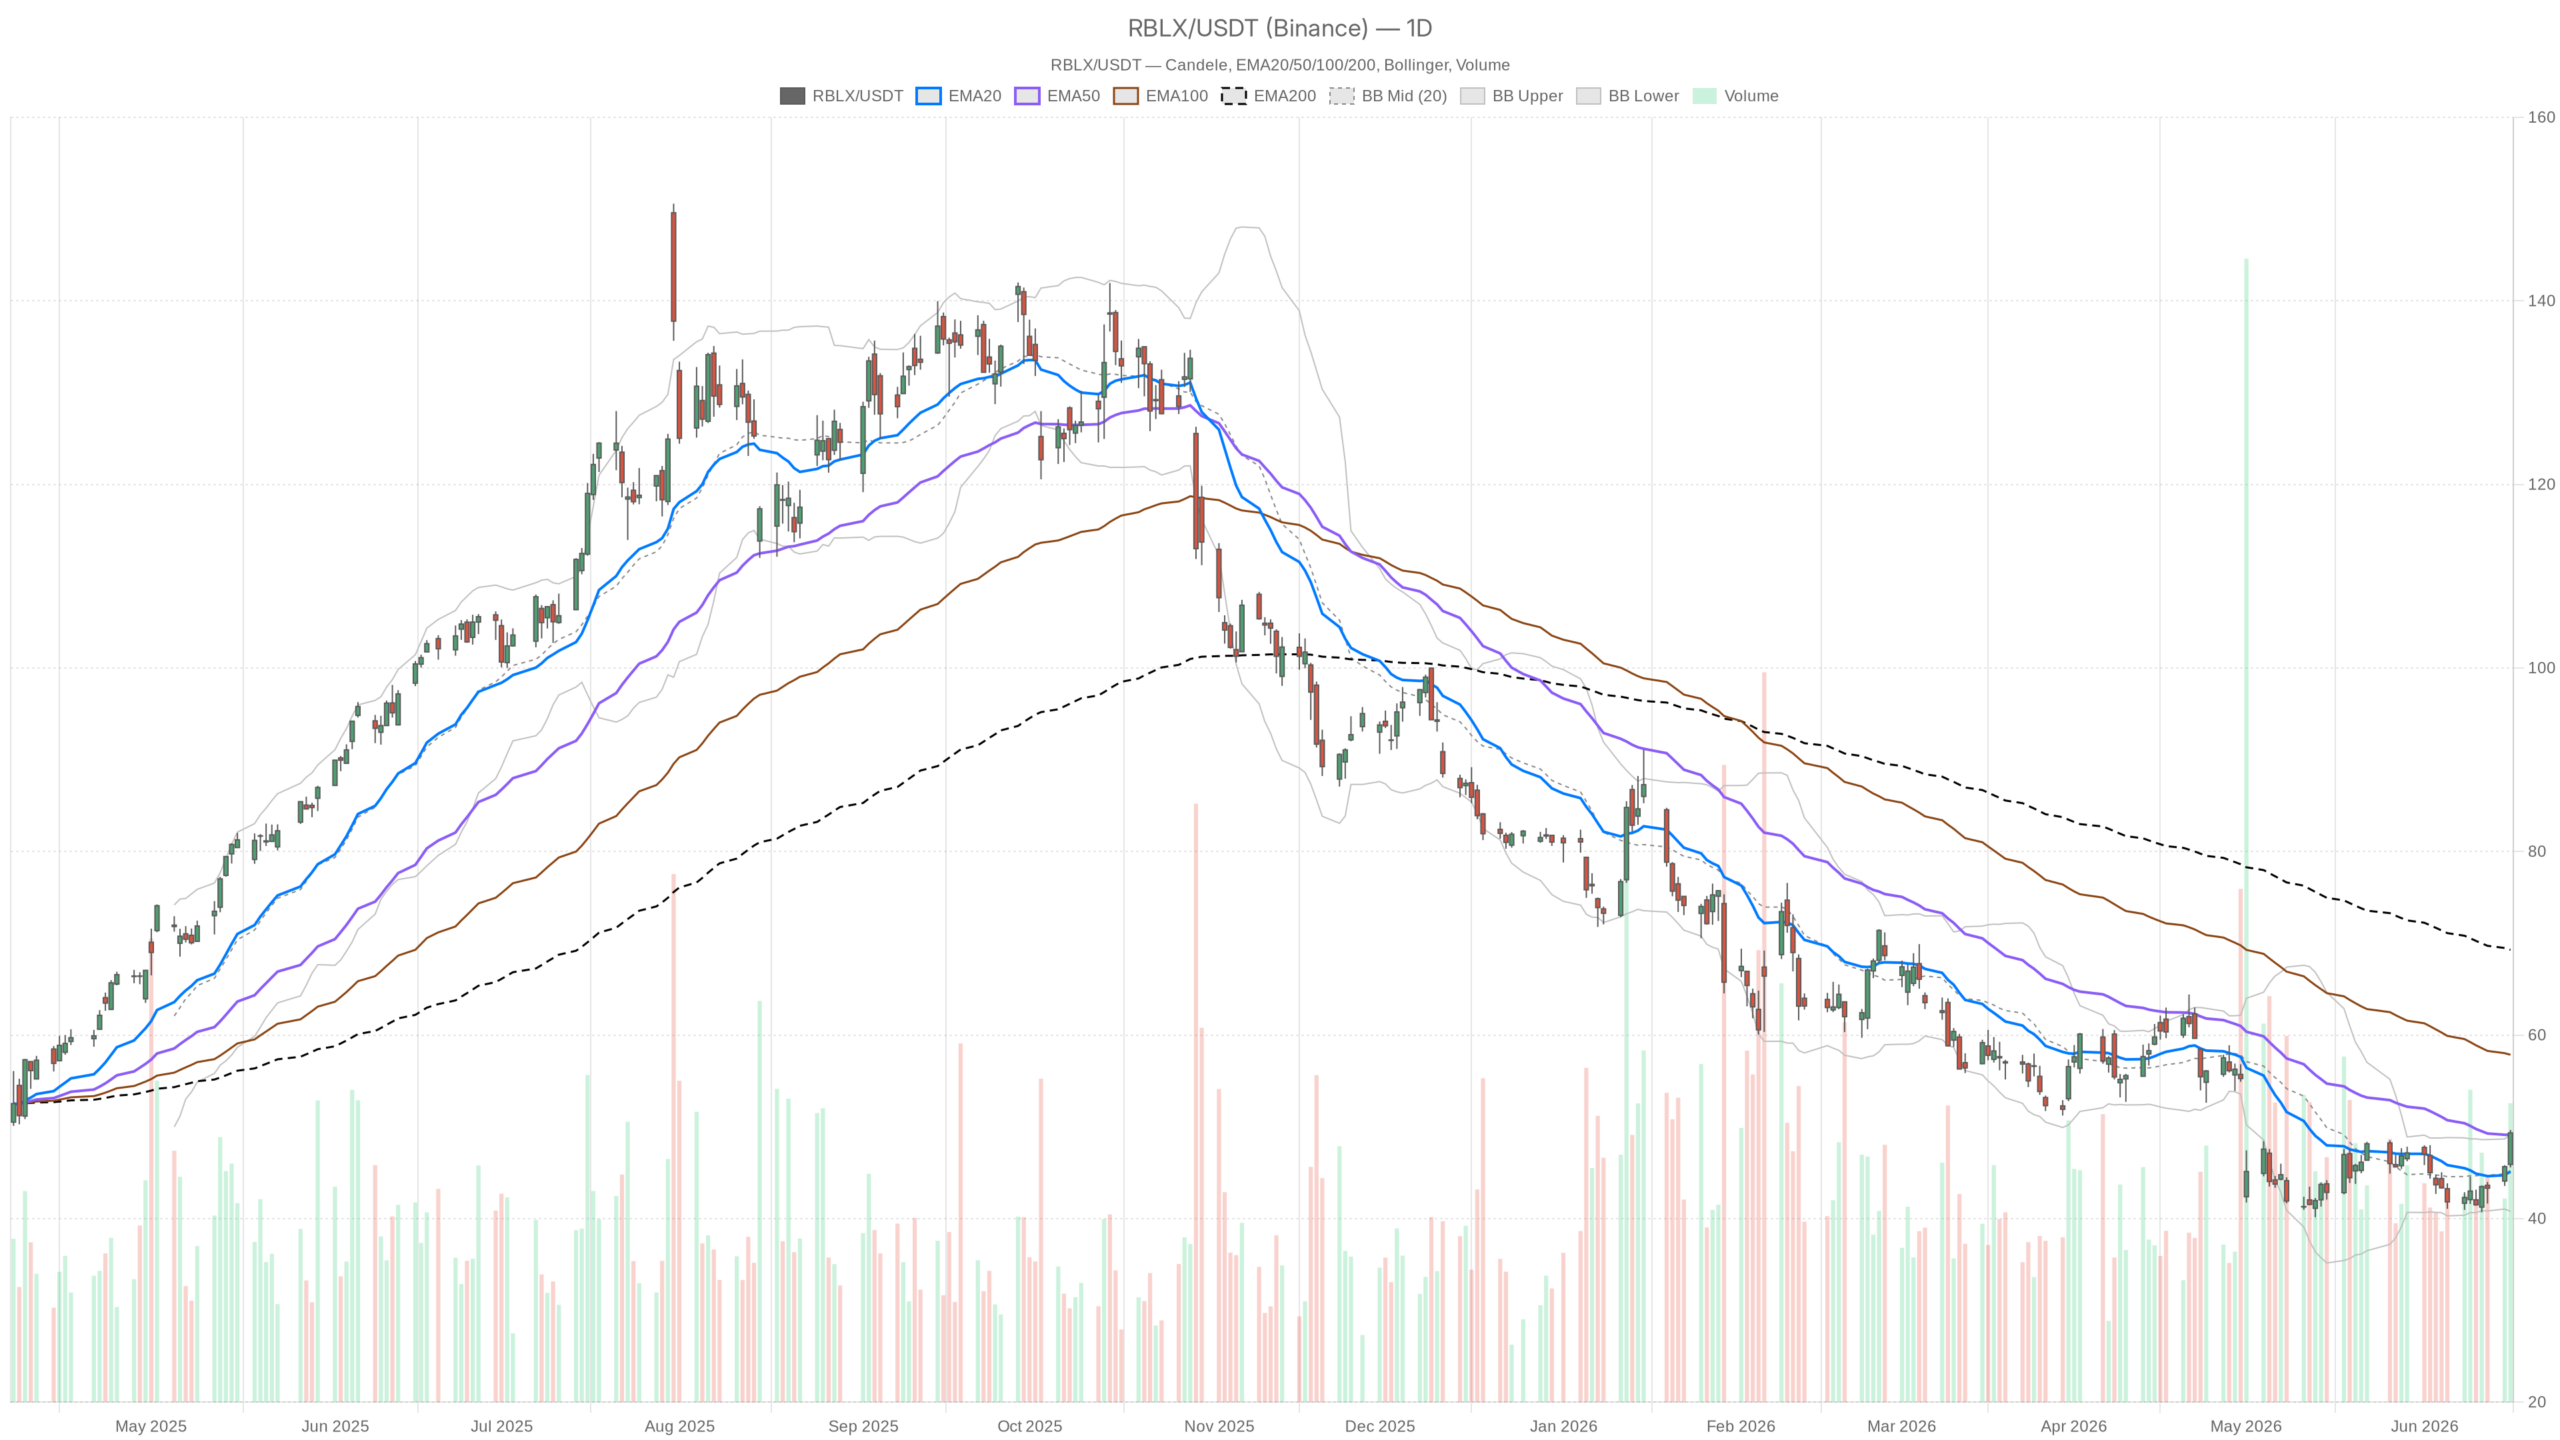
- The daily EMA50 at 49.14 has just been broken above; the EMA200 at 69.28 remains far away
- The hourly RSI at 82.44 signals short-term overbought and possible profit-taking
- The $50 threshold is the dividing line between consolidation and a new leg up
The June 16 candle marks a turning point
The June 16 session produced a daily candle of genuine strength. RBLX moved from $45.90 to $49.34, with volumes of 13.9 million shares. This is not just any rebound: the width of the range and the participation indicate a strong reaction from the market.
The technical thesis rests on a solid low and concrete catalysts. The return to Russia, the global launch of underage accounts and the growth in engagement reported by TD Cowen provide a rational basis for the move. However, the EMA200 at $69.28 remains very far away. The underlying trend has not changed.
On the daily chart the technical picture is improving but still incomplete
RBLX has broken above the daily EMA50 at $49.14 and slightly pierced the upper Bollinger Band at 49.18. These are two constructive signals, which however coexist with a daily MACD still in negative territory. The MACD line is at -0.94 versus a signal at -1.65.
The positive histogram at +0.71 indicates that bearish pressure is easing. If the current pace is maintained, the bullish MACD crossover could materialize in the coming sessions. The daily RSI at 58.83 is in positive territory but far from overbought. There is still technical room before momentum is exhausted on this timeframe.
Pivots place key resistance at $50.81
A break above $50 would open the way towards R1 resistance at $50.81, the first technical target in case the rally continues. The main pivot at 48.19 has already been broken with the June 16 close.
On the downside, S1 support at $46.72 is the level to watch in case of a pullback. Losing that threshold would bring the stock back into a zone of uncertainty. With a daily ATR14 at $2.50, intraday moves remain wide. Risk management levels must be calibrated to this volatility.
On the hourly chart momentum is strong but RSI warns
On the hourly timeframe, Roblox shares show an RSI at 82.44, deep in technical overbought territory. The short-term move has consumed a lot of energy. It may need a pause before any further leg up. This is not a reversal signal, but a warning not to be ignored.
The hourly MACD confirms the strength of the move: line at 1.60, signal at 1.19, positive histogram at +0.41. Price is trading above all hourly moving averages — EMA20 at 46.34, EMA50 at 44.80, EMA200 at 46.06 — with a significant spread. Hourly pivots show a compressed range between PP at 49.44 and R1 at 49.57. The market was stabilizing in the last hour analyzed.
On the 15-minute chart the push is running out
The MACD histogram on M15 is practically flat at +0.01 and the RSI stands at 74.86. The driving force of the latest move is running out in the very short term. This is not a break in structure, but a physiological breather after the run.
The 15-minute Bollinger Bands place price near the upper band at 49.86. The $49.57–$49.86 area represents the immediate resistance the stock is currently testing. Moving averages remain aligned in an upward sequence and the short-term regime is classified as bullish. The technical structure is holding.
Bullish scenario: above $50 the target is 52–53
A break above the psychological threshold of $50 would trigger an immediate target at $50.81 (R1), with a possible extension towards the 52–53 area in the following sessions. The catalyst is there: growing engagement, the return to Russia and safe accounts for minors could translate into upward revisions of estimates.
On the technical side, the scenario requires the daily MACD to complete the positive crossover and the hourly RSI to normalize without losing $48.50–$49.00. If these levels hold during pullbacks, the structure remains constructive. The daily EMA50, already reached at 49.14, will be the first test of support.
Bearish scenario: below $49 the recovery falters
Losing the daily EMA50 at 49.14 and S1 support at $46.72 would invalidate the recovery structure. At that point the daily EMA20 at 45.16 would come back into play as the last bulwark before a new test of the lows. The stock had already dropped more than 24% after the Q1 2026 results.
The long-term trend remains structurally negative. With the EMA200 at $69.28 so far away, any macro disappointment or negative revision in active users could reactivate the underlying bearish pressure. The current recovery deserves respect, but without forgetting the context in which it is taking place.
The market now: solid rebound, but the test has just begun
The June 16 move has the hallmarks of a quality technical rebound, built on volume and positive news. Intraday momentum is favorable, but the overbought hourly RSI and still-negative daily MACD are reminders that the path is not linear.
The $49–$50 area concentrates the uncertainty. The market must decide whether this is a new starting point or a temporary distribution phase. Traders are watching for a hold above $49.14 in the coming sessions and for the market’s ability to absorb profit-taking after the sharp move on June 16.
FAQ
Has RBLX reversed the trend?
No. The medium-to-long-term trend remains bearish. The EMA200 at $69.28 is still very far away. The current move is a quality technical rebound supported by volumes, not a structural reversal.
What is the most important level to monitor?
The $50 threshold. A break above it with volume would confirm the strength of the rebound towards R1 at 50.81 and the 52–53 area. Losing it would bring the stock back into a zone of uncertainty.
Is the overbought condition on the hourly chart a sell signal?
Not by itself. The RSI at 82.44 indicates that the move is extended, but does not rule out a further leg up after a consolidation phase. It is a signal of caution, not an automatic sell.
{“@context”:”https://schema.org”,”@type”:”FAQPage”,”mainEntity”:[{“@type”:”Question”,”name”:”Has RBLX reversed the trend?”,”acceptedAnswer”:{“@type”:”Answer”,”text”:”No. The medium-to-long-term trend remains bearish. The EMA200 at $69.28 is still very far away. The current move is a quality technical rebound supported by volumes, not a structural reversal.”}},{“@type”:”Question”,”name”:”What is the most important level to monitor?”,”acceptedAnswer”:{“@type”:”Answer”,”text”:”The $50 threshold. A break above it with volume would confirm the strength of the rebound towards R1 at 50.81 and the 52–53 area. Losing it would bring the stock back into a zone of uncertainty.”}},{“@type”:”Question”,”name”:”Is the overbought condition on the hourly chart a sell signal?”,”acceptedAnswer”:{“@type”:”Answer”,”text”:”Not by itself. The RSI at 82.44 indicates that the move is extended, but does not rule out a further leg up after a consolidation phase. It is a signal of caution, not an automatic sell.”}}]}
Disclaimer: This article is for informational purposes only and does not constitute financial advice, investment recommendation or a solicitation to buy or sell financial instruments or cryptocurrencies. The analyses do not guarantee future results. Investments in crypto-assets and financial markets involve a high risk of capital loss. Always do your own research (DYOR) and consult a qualified financial advisor before making any decision.
Content created with the assistance of artificial intelligence and human editorial review.