

HSBC shares are trading around 94.45 dollars and maintain a bullish structure on all main timeframes. However, very short-term momentum shows signs of hesitation. It is not an alarm, but an element being closely monitored. The partnership with Google Cloud on AI and the first interim dividend for 2026 confirm a clearly defined strategic trajectory.
Summary
Key points
- Price at 94.45 dollars, bullish daily trend with EMA20/50/200 perfectly aligned
- Daily RSI at 57.23 in a neutral-positive area, leaves technical room to the upside
- Daily pivot point at 94.72 separates short-term strength from weakness
- Key support S1 at 94.04; immediate resistance R1 at 95.14
- Hourly RSI at 67.02 close to overbought, reduces room for further extensions
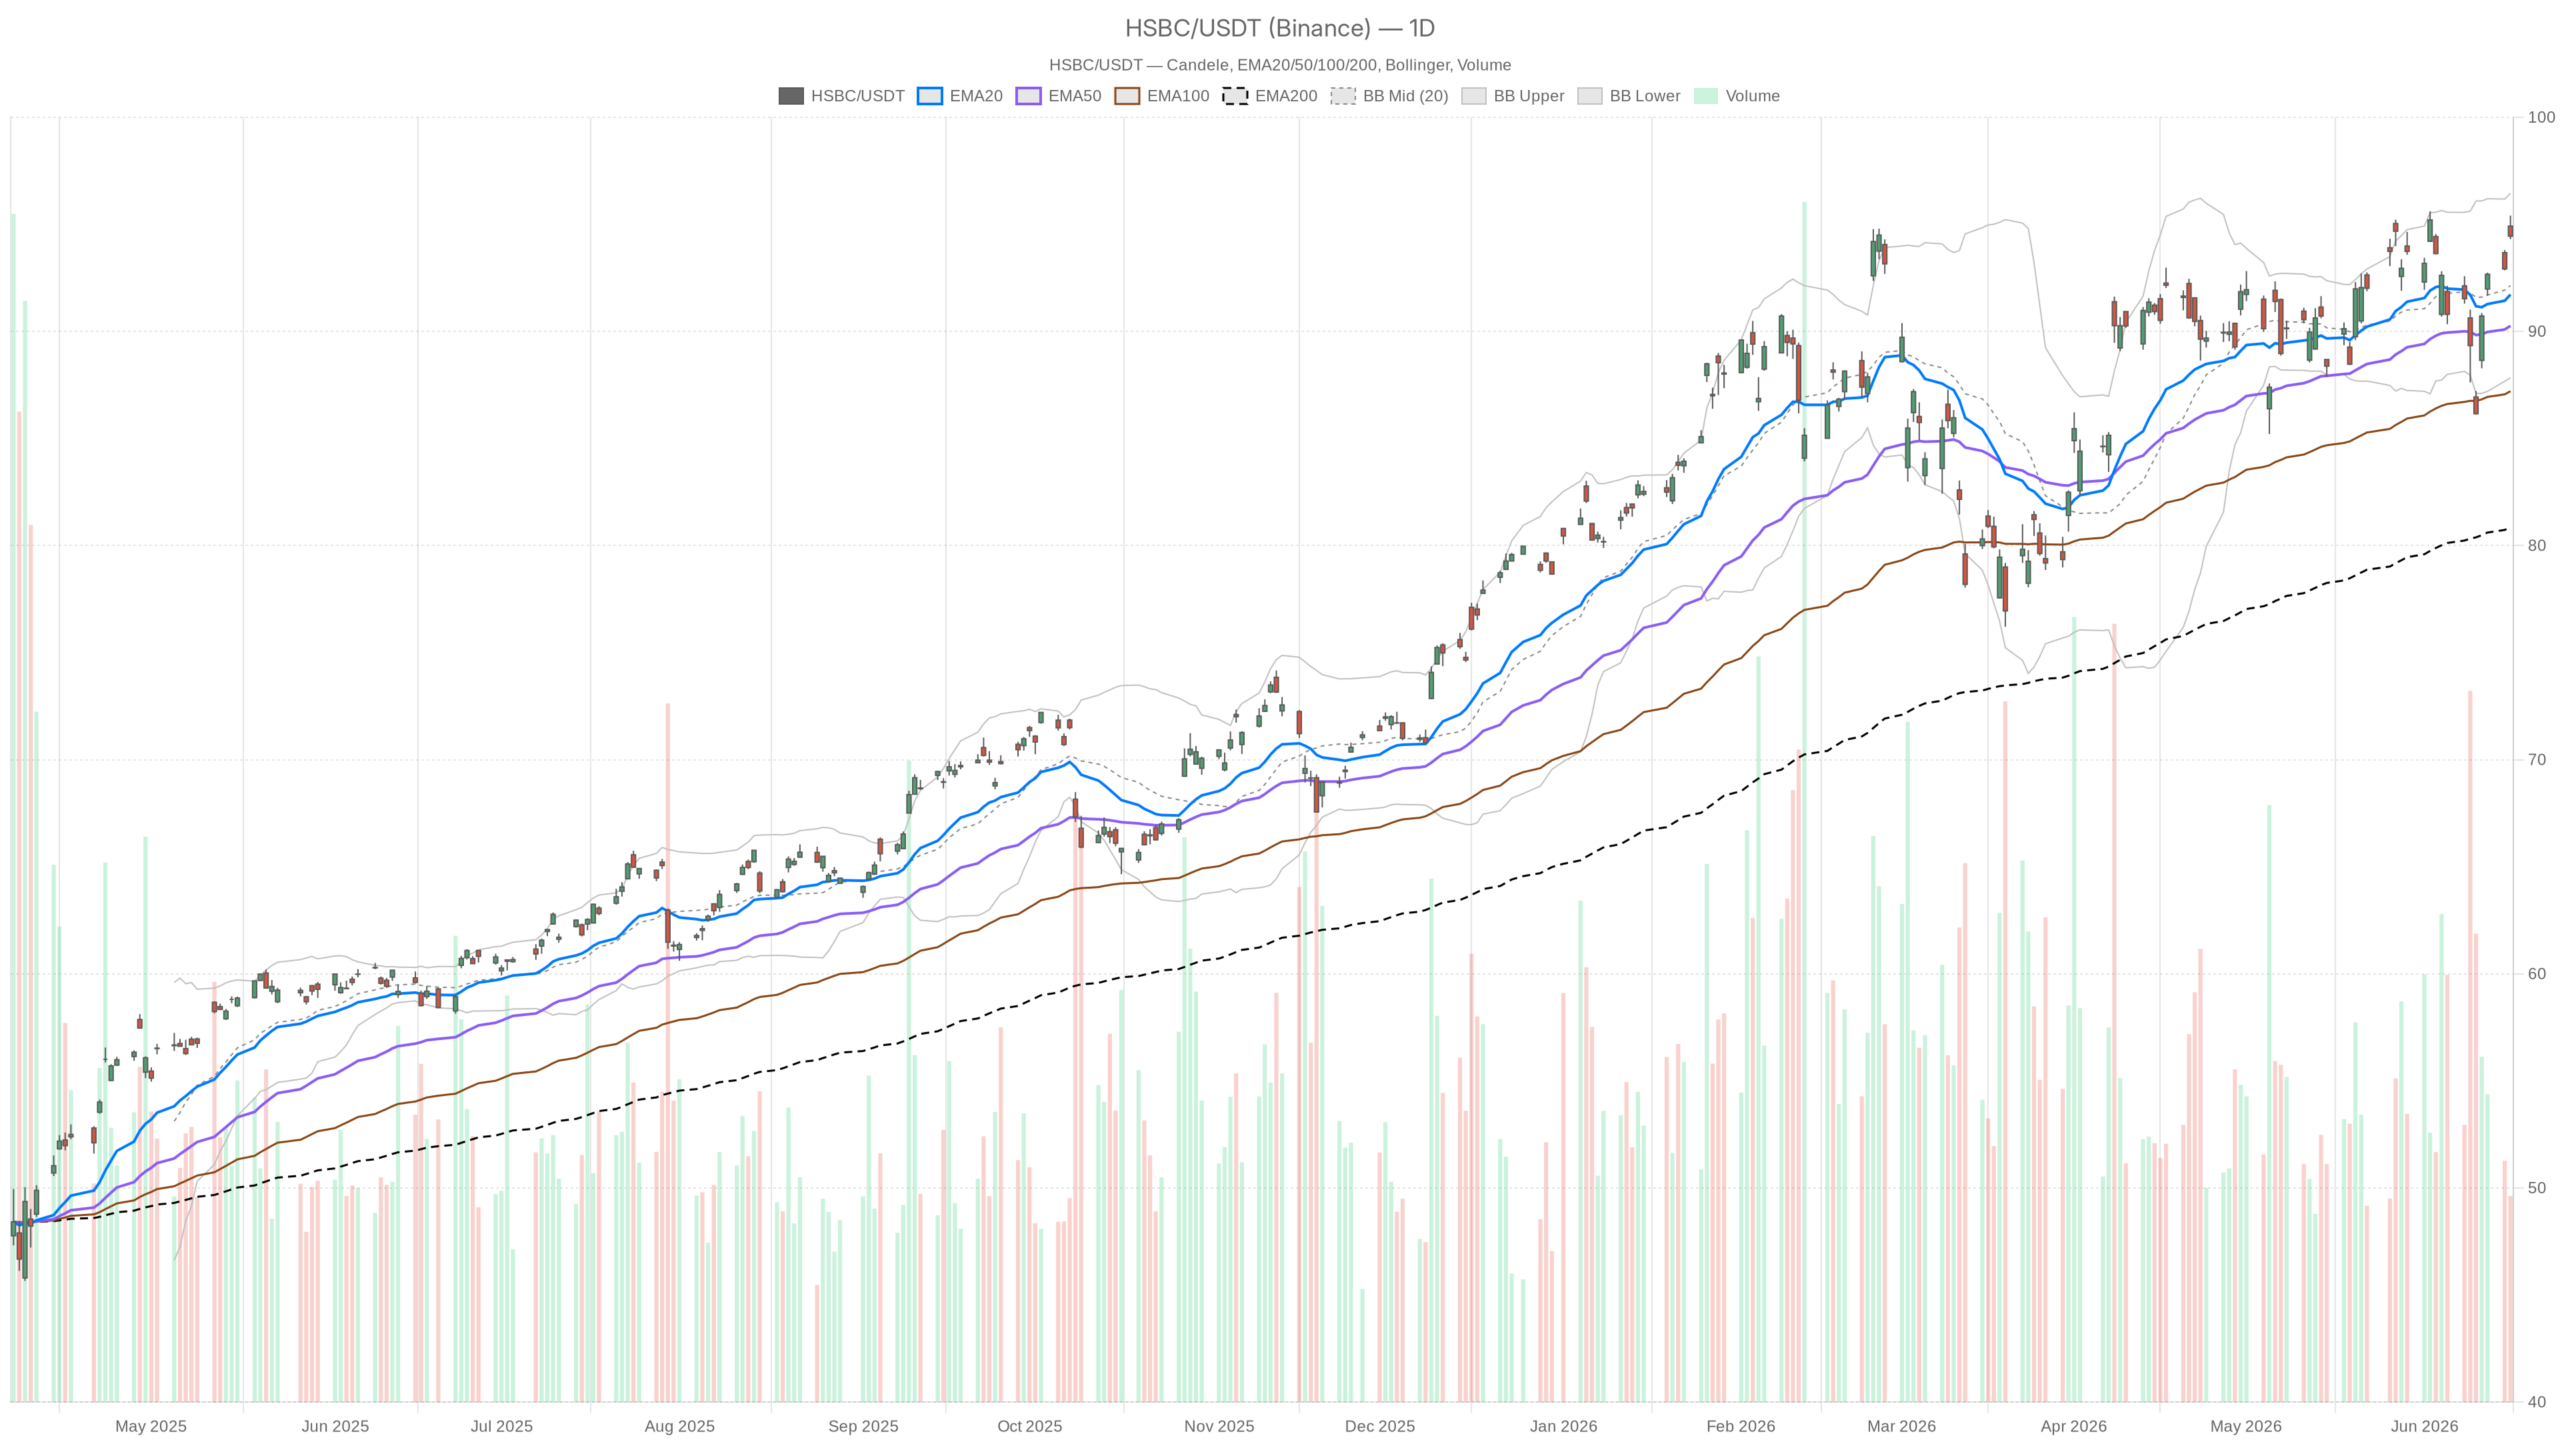
The daily chart sets the direction: bullish, but not aggressive
The daily trend remains firmly bullish. The price is above all three main exponential moving averages with a significant gap: EMA20 at 91.72, EMA50 at 90.26 and EMA200 at 80.87. This is not just a simple rebound, but an alignment that indicates a consolidated trend.
The daily RSI at 57.23 is in neutral-positive territory. It does not signal overbought or weakness. There is still technical room to the upside, even if a clear impulse is missing. On the daily MACD front, line and signal are practically coincident, with an almost flat histogram at 0.01. The bullish momentum exists, but is not accelerating.
The daily Bollinger Bands confirm this reading. The middle band is at 92.14 and the upper band at 96.45. The price is moving in the upper half of the channel, a sign of positive pressure. The daily ATR at 2.49 indicates moderate daily volatility. This is consistent with a stock consolidating at elevated levels.
Daily pivot: the price moves between support and the first resistance level
At the close of the session, HSBC is slightly below the daily pivot point at 94.72. Resistance R1 at 95.14 and support S1 at 94.04 define a narrow trading corridor. The price compressed between PP and S1 suggests slight short-term pressure. The overall technical structure, however, is not compromised.
The hourly chart shows strength, but momentum is approaching a critical level
On the hourly chart the bullish trend is strong. The price is above all three exponential moving averages: EMA20 at 93.37, EMA50 at 92.18 and EMA200 at 91.60. The wide gap from the slower averages confirms that the move in recent sessions has been significant.
However, the hourly RSI at 67.02 is approaching the 70 threshold. It is not yet a reversal signal, but it reduces the window available for further immediate extensions. The 1H MACD has a positive but almost flat histogram at 0.02. Line and signal are practically identical: the trend is alive, but the engine is not pushing decisively.
The hourly Bollinger Bands place the price in the upper part of the channel. The upper band is at 95.48 and the middle band at 93.53. The stock is well above the middle band, but still far from the upper band. There is no technical excess: there is a structure of strength waiting for a new push.
The 15-minute chart: small correction in a still constructive context
The 15-minute chart shows slight bearish pressure. The MACD has a negative histogram at -0.12, with the line below the signal. The RSI at 49.27 is practically neutral. The price is slightly below the 15-minute EMA20, positioned at 94.57.
In this context, the 94.31–94.36 area represents the immediate support zone to monitor. It corresponds both to the low of the last candle and to the S1 support of the 15-minute pivot. Above 94.52, on the other hand, lies the very short-term resistance, coinciding with R1 pivot.
The neutral regime on the 15-minute chart does not invalidate the daily bullish trend. It simply indicates that the market is catching its breath after the move of the previous hours. In many cases, it is precisely this type of consolidation that prepares the ground for trend continuation.
Bullish scenario: what is needed to bring the stock back towards the range highs
To resume the bullish push, HSBC must first regain the daily pivot point at 94.72. A stable return above this level would change the short-term reading and reopen the path towards R1 at 95.14. A break above 95.14 with adequate volumes would be a more significant technical signal. The upper daily Bollinger Band at 96.45 would represent the first extended target.
In terms of indicators, the daily MACD needs to start diverging again with an expanding histogram. The RSI can rise towards 65 without creating excesses. An increase in volumes compared to the recent average would also give credibility to the move. On the fundamental side, the AI partnership with Google and the already confirmed interim dividend provide a favorable narrative backdrop.
Bearish scenario: the levels that would change the picture
The negative scenario takes shape if the price decisively breaks the daily S1 support at 94.04. Below that level, the next target coincides with the daily EMA20 around 91.72. A drop towards that area would not necessarily be critical in the long term. It would, however, represent a visible deterioration of the short-term structure.
A further risk factor is the 400 million dollar exposure to the IFFCO group in the United Arab Emirates, reported by Bloomberg. If the situation were to worsen, it could generate pressure on sentiment around the stock, regardless of the technical picture. On the chart, a daily RSI below 50 with MACD in negative territory would call into question the currently dominant bullish regime.
Where uncertainty is concentrated: the operational reading of the moment
The technical structure of HSBC shares is solid on the daily and hourly charts. The problem is that short-term momentum is not confirming with the same conviction. The 15-minute chart is in slight retreat, the hourly RSI is close to 70 and the daily MACD is practically flat.
This is not a dangerous situation, but a localized area of uncertainty. The market is waiting: either for a catalyst that justifies a new bullish impulse, or for a correction that cleans up the short-term chart. This would reset the technical conditions for a new attempt.
There are three levels under observation. The first is 94.72, the daily pivot point that separates short-term strength from weakness. The second is 95.14, the immediate target in case of breakout. The third is 94.04, the support which, if broken, would change sentiment in the very short term. As long as HSBC remains within this range, the picture remains unchanged. A stock in a bullish trend taking a pause before the next move.
FAQ
Are HSBC shares still in a bullish trend?
Yes. The price remains steadily above the three main daily exponential moving averages (EMA20, EMA50, EMA200), all correctly aligned. The daily RSI at 57.23 is in a neutral-positive area and does not show signs of structural weakness.
What are the key levels to monitor in the short term?
The three critical levels are the daily pivot point at 94.72, resistance R1 at 95.14 and support S1 at 94.04. Above 94.72 the short-term picture turns favorable again; below 94.04 a corrective scenario opens towards the daily EMA20 at 91.72.
What could trigger a correction in HSBC stock?
In addition to the technical break of S1 at 94.04, a concrete risk factor is the 400 million dollar exposure to the IFFCO group in the United Arab Emirates. A worsening of this situation could weigh on sentiment, even regardless of the technical picture.
{“@context”:”https://schema.org”,”@type”:”FAQPage”,”mainEntity”:[{“@type”:”Question”,”name”:”Are HSBC shares still in a bullish trend?”,”acceptedAnswer”:{“@type”:”Answer”,”text”:”Yes. The price remains steadily above the three main daily exponential moving averages (EMA20, EMA50, EMA200), all correctly aligned. The daily RSI at 57.23 is in a neutral-positive area and does not show signs of structural weakness.”}},{“@type”:”Question”,”name”:”What are the key levels to monitor in the short term?”,”acceptedAnswer”:{“@type”:”Answer”,”text”:”The three critical levels are the daily pivot point at 94.72, resistance R1 at 95.14 and support S1 at 94.04. Above 94.72 the short-term picture turns favorable again; below 94.04 a corrective scenario opens towards the daily EMA20 at 91.72.”}},{“@type”:”Question”,”name”:”What could trigger a correction in HSBC stock?”,”acceptedAnswer”:{“@type”:”Answer”,”text”:”In addition to the technical break of S1 at 94.04, a concrete risk factor is the 400 million dollar exposure to the IFFCO group in the United Arab Emirates. A worsening of this situation could weigh on sentiment, even regardless of the technical picture.”}}]}
Disclaimer: This article is for informational purposes only and does not constitute financial advice, investment recommendation or a solicitation to buy or sell financial instruments or cryptocurrencies. The analyses do not guarantee future results. Investments in crypto-assets and financial markets involve a high risk of capital loss. Always do your own research (DYOR) and consult a qualified financial advisor before making any decision.
Content created with the assistance of artificial intelligence and human editorial review.