




As of July 31, 2026, Ethereum finds itself navigating a tense technical setup, with the Ethereum price today hovering at $1,889.70. The daily chart holds constructive, yet intraday sellers have quietly seized control, creating a market defined by genuine ambiguity.
Summary
Key takeaways
- ETH trades at $1,889.70, below all hourly EMAs despite a still-intact daily structure.
- The fear and greed index sits at 25, signaling Extreme Fear across the crypto market.
- The 200-day EMA at $2,222 remains the critical long-term level ETH has yet to reclaim.
- Daily RSI at 53.82 shows neutral momentum, while the hourly RSI at 35.09 approaches oversold territory.
- A daily close below $1,850 would structurally damage the near-term bullish case.
Daily chart: structure intact but momentum fading
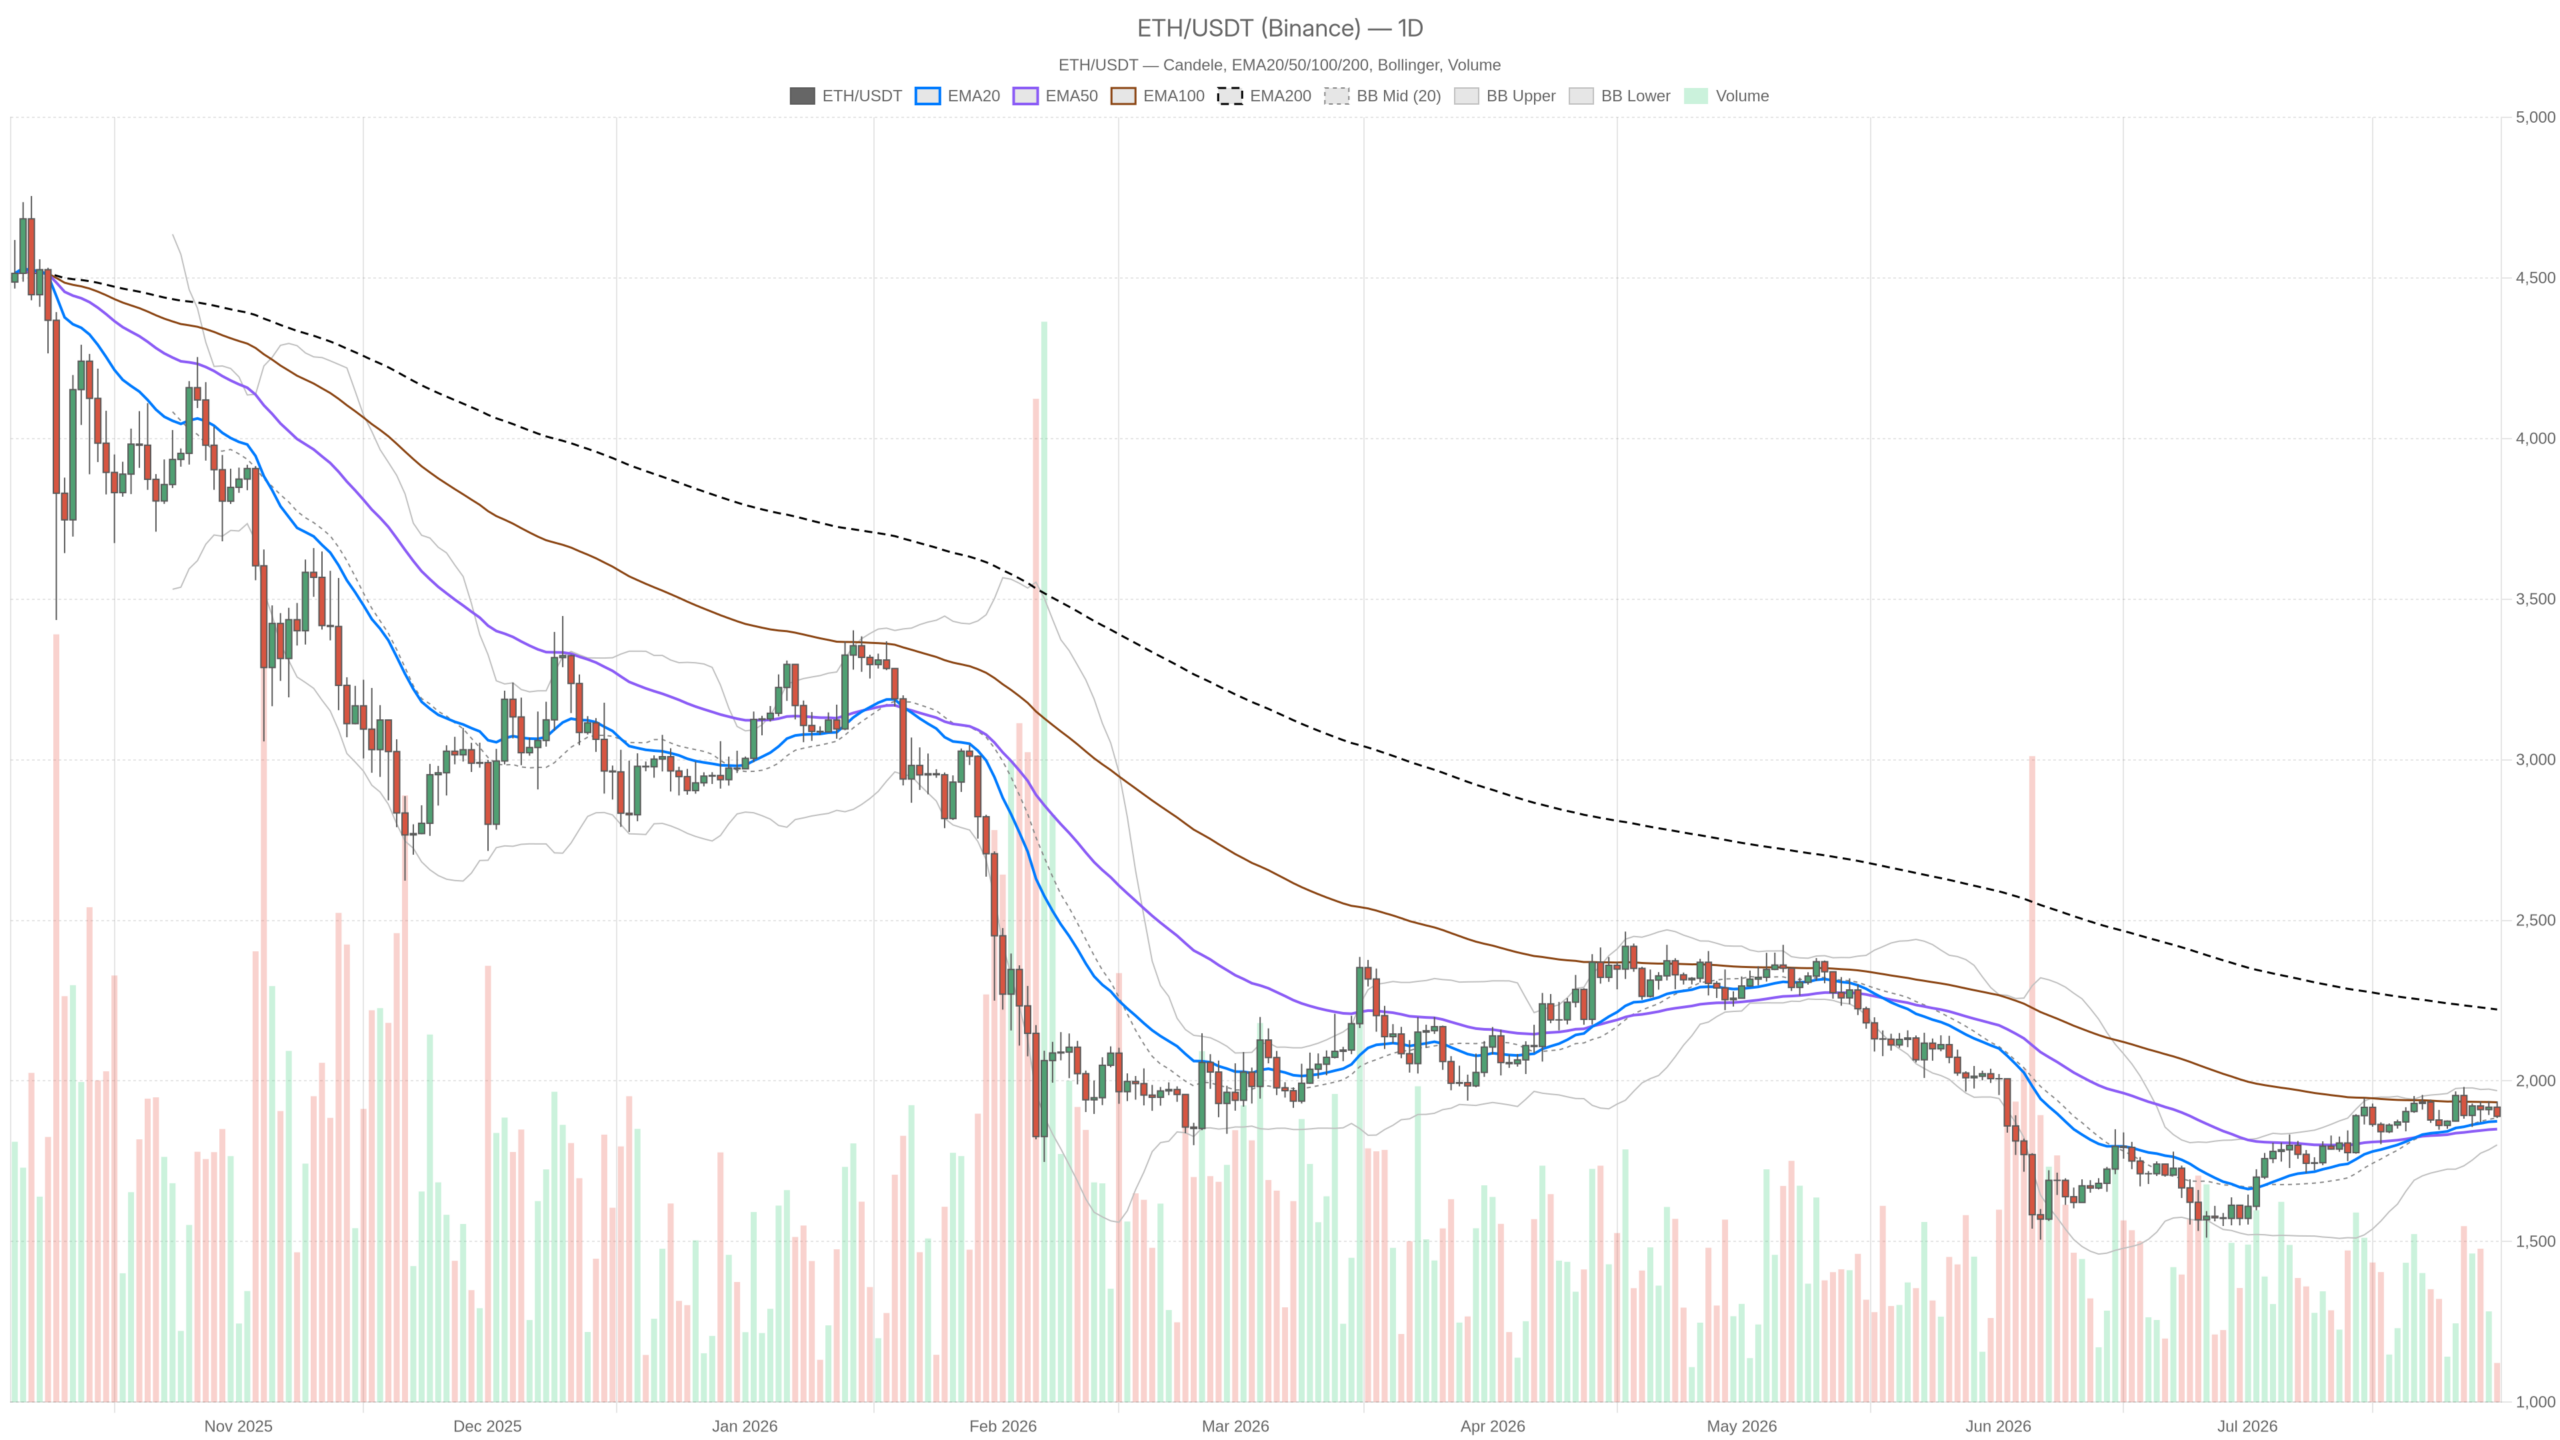
The daily chart retains a constructive structure, with ETH holding above both its 20-day and 50-day EMAs despite weakening momentum signals. On the daily timeframe, ETH trades above its 20-day EMA at $1,874 and its 50-day EMA at $1,850. That stacking signals intermediate-term health. The daily RSI at 53.82 sits in neutral territory, offering no strong directional bias.
However, the daily MACD tells a more nuanced story. The MACD line at 35.19 runs above zero, which is structurally bullish, but it has dipped below its signal line at 38.68, producing a histogram reading of -3.49. That negative crossover serves as a warning. It does not confirm a reversal on its own, but it shows the prior upward impulse is fading. If this divergence widens, the daily bias could flip decisively.
Meanwhile, Bollinger Bands place the midline at $1,885, with resistance at $1,969 and support at $1,801. ETH hugs the midline from above, consistent with a market digesting earlier gains. The daily ATR of 58.12 suggests any session can move roughly $58 — meaningful range without panic-level volatility. Broader sentiment remains cautious: Fortune covered Ethereum’s hesitant trajectory as recently as July 29, and Bitcoin dominance at 56.4% signals capital is gravitating toward perceived safety rather than rotating into altcoins.
200-day EMA: the structural anchor
The 200-day EMA at $2,222 represents the single most important level for Ethereum’s macro trend, and ETH remains roughly $333 below it. A market trading significantly below its 200-day EMA has not yet reclaimed its long-term bullish trend. Every other constructive signal on the daily chart exists within this broader context. $2,222 is the line that separates a genuine trend reversal from an extended bear market bounce. Until ETH closes above it, the macro recovery remains unproven.
Hourly deterioration: sellers in control
On the 1-hour chart, however, sellers are firmly in command, with ETH below all three key moving averages and momentum indicators still pointing downward. ETH at $1,890 sits below the 20H EMA at $1,908, the 50H at $1,910, and the 200H at $1,904. When price trades under every meaningful moving average on the hourly, sellers own the near-term narrative. The 1H RSI at 35.09 approaches oversold territory — in a trending market, that often signals a healthy downtrend rather than an imminent bounce.
Moreover, the 1H MACD confirms the downward pressure. The MACD line at -4.50 versus the signal line at -1.15 produces an accelerating negative histogram of -3.35. Momentum is still being added to the downside, not fading. The 1H Bollinger Bands show the lower boundary at $1,892. With ETH pressing against that level, a mean-reversion snap toward the midline at $1,913 is possible — but only if buyers step in with conviction.
15-minute chart: bearish but decelerating
The 15-minute chart carries the only official bearish regime label across all timeframes, though sell-side momentum is showing signs of exhaustion. Price at $1,890 sits below the 15M 20 EMA at $1,897, the 50 EMA at $1,906, and the 200 EMA at $1,909, mirroring the hourly structure. The RSI at 36.49 is similarly oversold-adjacent. Crucially, the MACD histogram on this timeframe has narrowed to just -0.54. The sell-side pressure remains but is losing acceleration. That alone will not trigger a reversal, but it indicates the current leg down is maturing. This is not an ideal entry for either direction.
DeFi flows: mixed signals from Uniswap
On the DeFi front, on-chain activity presents mixed signals, with Uniswap V4 surging while V3 fees dip, suggesting shifting liquidity preferences rather than a broad retreat. Uniswap V3 fees dropped 30.23% in the last 24 hours, while Uniswap V4 recorded a 32.25% daily increase and a 38.26% surge over seven days. The 30-day picture for V3 remains robust at +61.16%, indicating that overall DEX activity on Ethereum has expanded on a medium-term basis. Curve DEX, by contrast, is in sharp decline — down 71% in a day and 74% over 30 days. Sustained on-chain activity provides the fundamental underpinning that keeps the daily structure from unraveling.
Bullish scenario and what validates it
For the bullish case to gain traction, ETH must reclaim the $1,903 daily pivot and push through the cluster of hourly EMAs between $1,904 and $1,910. This requires a specific sequence, not just optimism. First, ETH needs to close above $1,903 to demonstrate the current weakness is a shakeout rather than a structural shift. A push through the hourly EMAs would then confirm intraday seller exhaustion. If the daily MACD histogram begins narrowing toward zero, the path to the upper Bollinger Band at $1,969 opens up, with R1 at $1,922 acting as a logical first resistance. The scenario is invalidated if ETH closes below $1,870 with volume.
Bearish scenario and what confirms it
The bear case hinges on continued failure to reclaim hourly EMAs, with a daily close below $1,850 marking a meaningful structural breakdown. If ETH cannot recover its hourly moving averages and the daily MACD histogram keeps deteriorating, a drift toward the 50-day EMA at $1,850 becomes the path of least resistance. A daily close below that level would remove the last near-term support before $1,801. The bear scenario is invalidated by a clean reclaim of all three hourly EMAs with follow-through. The 200-day EMA at $2,222 underscores the core bear argument: the macro recovery has not yet earned enough trust.
Positioning: patience over aggression
Taken together, the signals behind the Ethereum price today paint a market consolidating above key support but lacking the momentum to push decisively higher. Traders already long have a reasonable case to hold with a stop below $1,850. Those looking to add exposure should wait for the hourly structure to repair itself. Short sellers, meanwhile, should recognize they may be entering late into a move already decelerating on the 15-minute chart. The daily ATR of $58 means any directional resolution will be fast and impactful. Volatility at this juncture cuts both ways, and forcing a position into an unresolved structure is the fastest way to be right about direction and still lose money.
FAQ
Where does Ethereum currently trade?
As of July 31, 2026, ETH sits at $1,889.70, below its hourly moving averages but holding above its 20-day and 50-day daily EMAs.
What is the most important level for Ethereum’s long-term trend?
The 200-day EMA at $2,222 is the critical threshold. ETH trades roughly $333 below it, meaning the macro recovery remains unconfirmed and incomplete.
What would confirm a bullish reversal for ETH?
A daily close above the $1,903 pivot followed by a push through the hourly EMAs between $1,904 and $1,910, with the daily MACD histogram beginning to narrow toward zero.
What level would invalidate the near-term bullish structure?
A daily close below $1,850 with volume would break the higher-low structure and expose the lower Bollinger Band at $1,801 as the next major support zone.
Disclaimer: This article is for informational purposes only and does not constitute financial advice, an investment recommendation, or a solicitation to buy or sell any financial instrument or cryptocurrency. The analysis provided is not indicative of future results. Investing in crypto assets and financial markets carries a high risk of capital loss. Always do your own research (DYOR) and consult a qualified financial advisor before making any decision.
Article produced with the assistance of artificial intelligence and reviewed by the editorial team.
