



As of July 31, 2026, the Solana price today sits at $73.62, with SOL trading below all key moving averages. Extreme Fear grips the broader crypto market, capping every recovery attempt under overhead resistance and leaving bulls without a clear catalyst.
Summary
Key takeaways
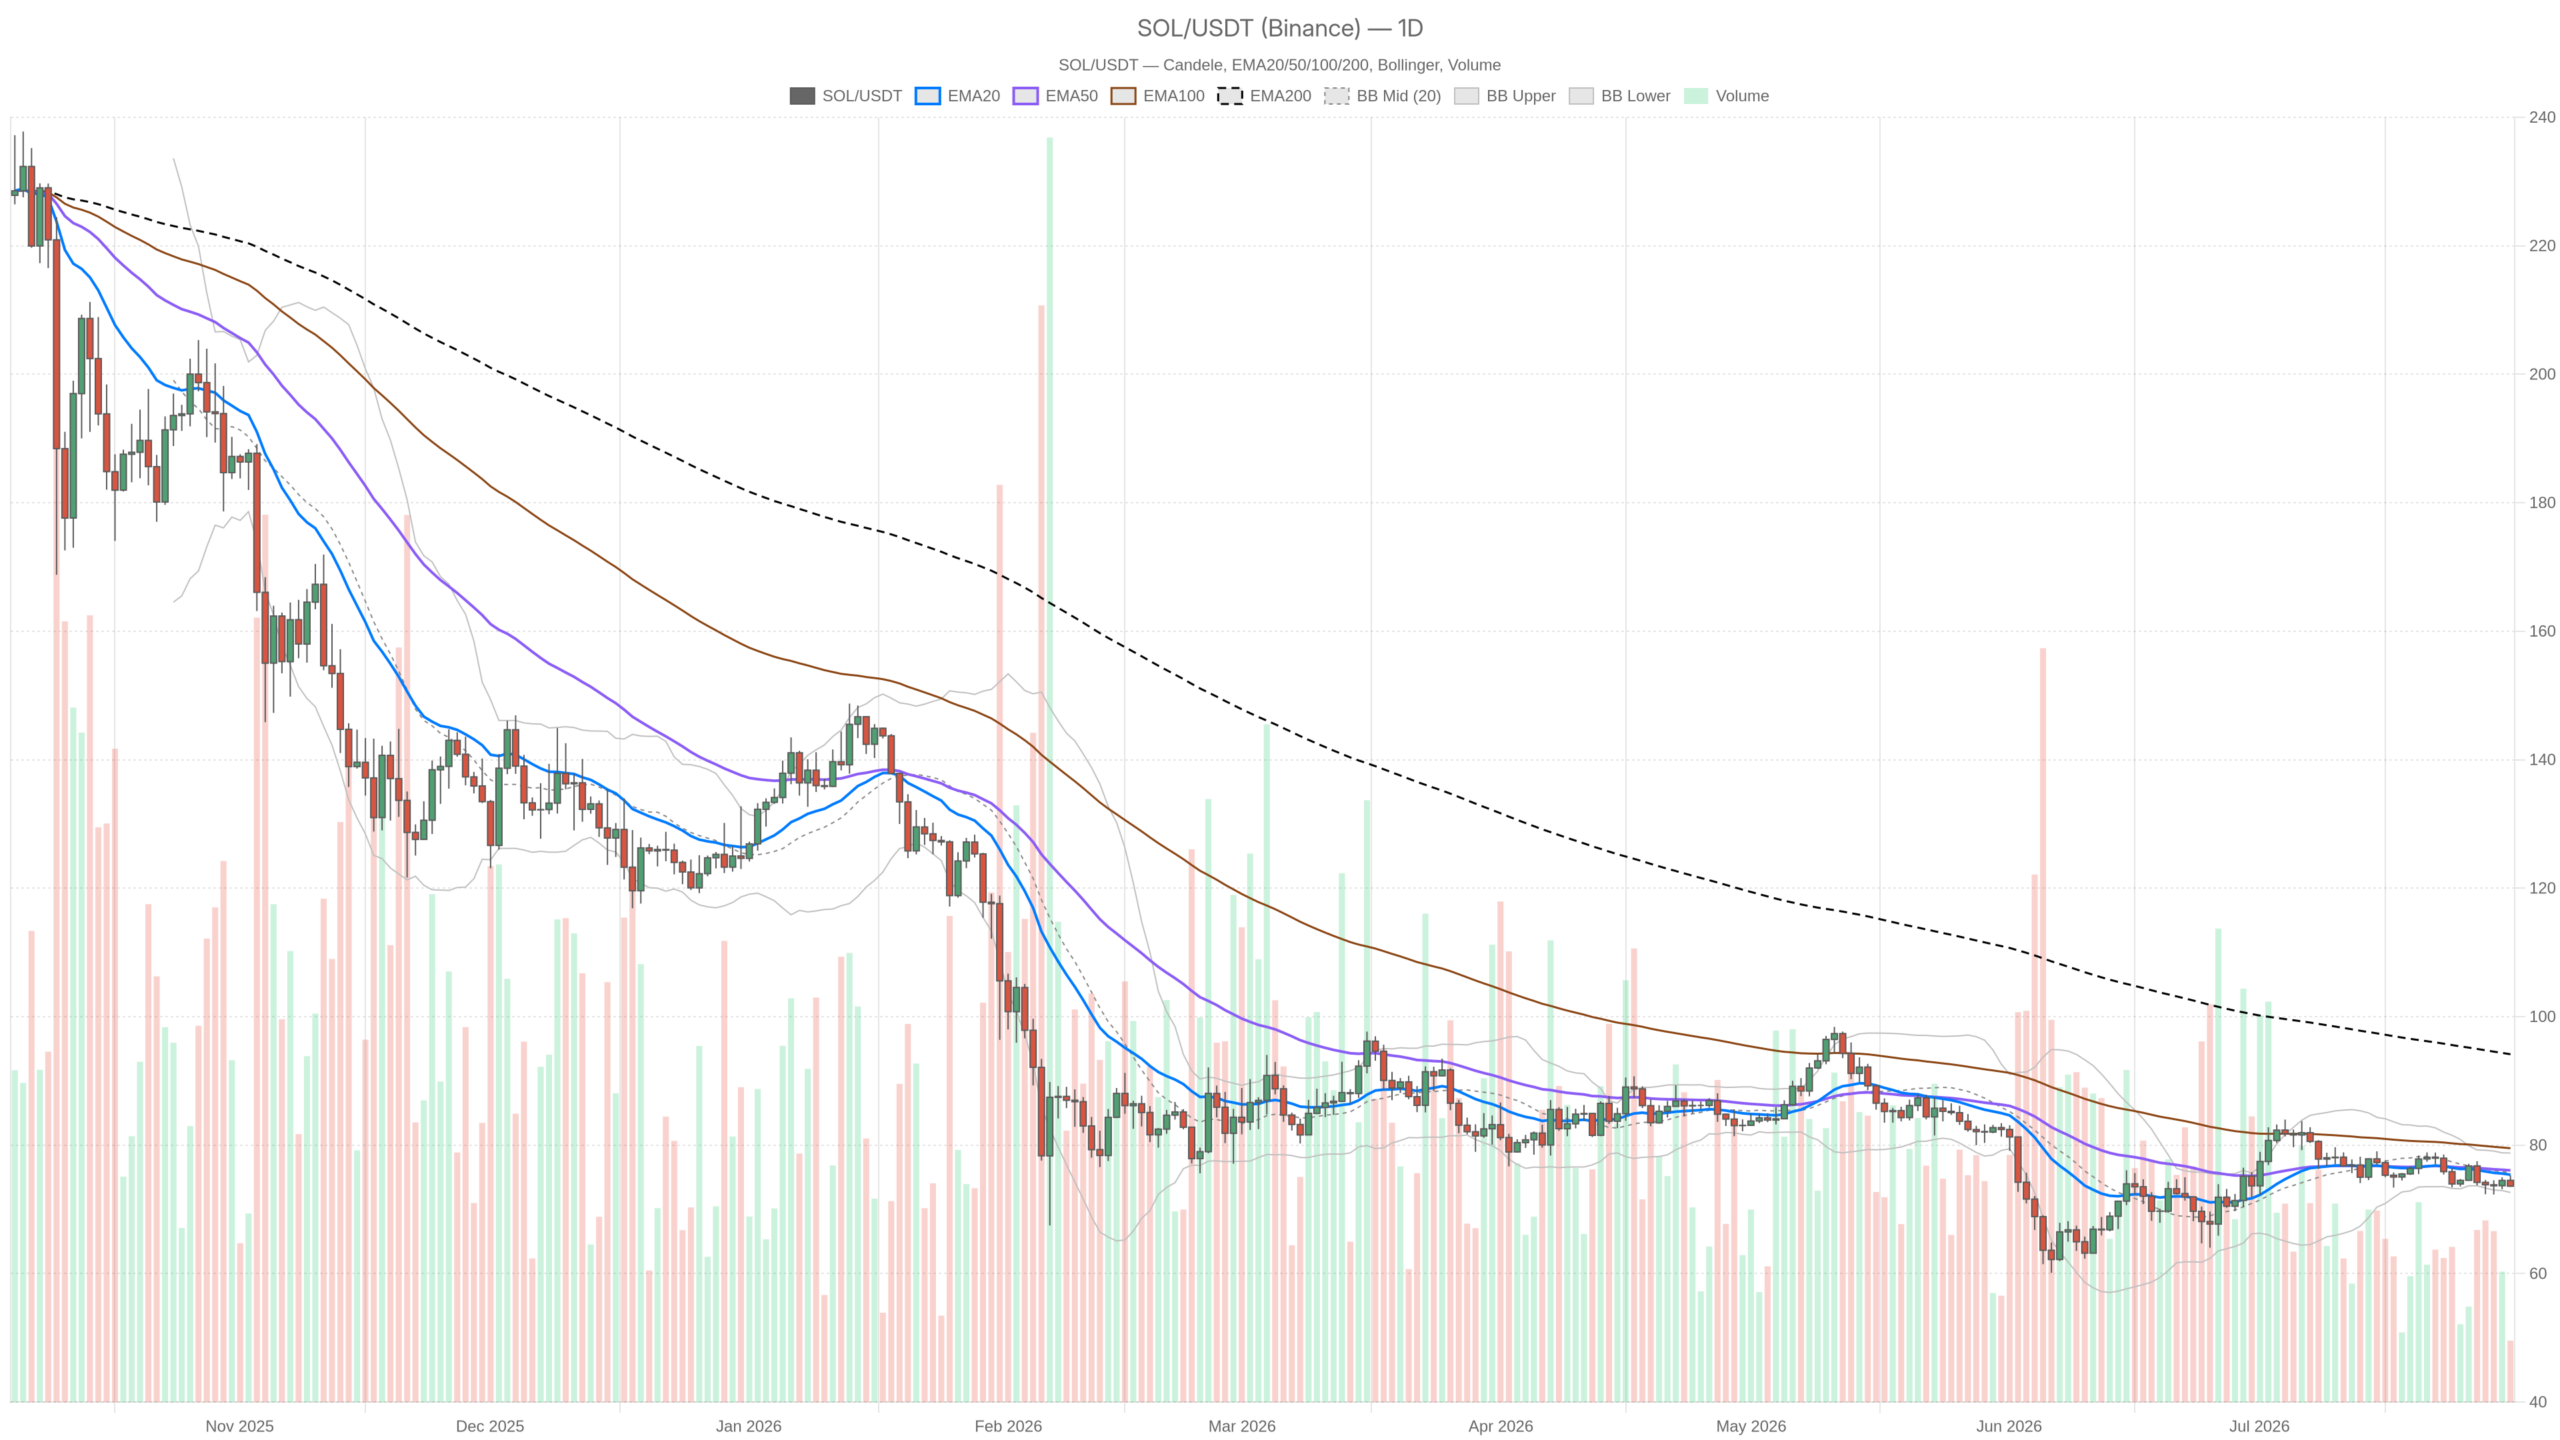
- SOL trades at $73.62, below its EMA20 ($75.40), EMA50 ($76.08), and EMA200 ($94.16) on the daily chart.
- The daily RSI at 43.8 and a negative MACD cross confirm bearish momentum with no divergence in sight.
- Major Solana DEXs posted significant fee declines, with Orca down 50.26% over 30 days and PumpSwap down 28.1% in 24 hours.
- A daily close below $72.99 would likely accelerate selling, while reclaiming $75.40 is the minimum requirement for any bullish recovery thesis.
The Daily Chart Confirms a Fully Bearish Regime
The daily chart confirms a fully bearish regime, with SOL closing at $73.62 while its EMA20 sits at $75.40 and EMA50 at $76.08. Price remains stranded below both short- and medium-term moving averages, which means every bounce should be treated as a selling opportunity until proven otherwise.
The EMA200 sits way up at $94.16 — a gap of over $20 from current price — underscoring how much ground Solana has lost from its longer-term mean. Mean-reversion to that level would require a sustained, high-conviction rally that simply is not visible in the current structure. Moreover, the daily RSI at 43.8 confirms the lack of buying pressure without screaming oversold. It is arguably the worst zone: not low enough to attract value buyers, yet not high enough to signal a healthy trend.
The daily MACD is equally unforgiving, with the line at -0.58 crossing below the signal at -0.21 and producing a histogram reading of -0.37. Momentum is negative and deteriorating. No divergence or hidden bullish setup lurks beneath the surface — the daily chart is simply weak.
Bollinger Bands and ATR Signal Continuation, Not Reversal
The daily Bollinger Bands indicate continuation rather than reversal, with SOL pressing toward the lower band at $72.64 in a bearish regime. When price hugs the lower band without RSI divergence on a bearish daily chart, it typically signals further downside rather than mean reversion.
The midline at $75.71 now acts as the first line of resistance — reclaiming it would be the minimum requirement for any credible short-term recovery thesis. Meanwhile, the ATR of 2.17 on the daily confirms that moves of $2 or more in either direction fall well within normal daily volatility.
That is relevant for sizing risk around the pivot levels: the daily pivot point sits at $74.14, with R1 at $74.77 and S1 at $72.99. Price remains caught between the pivot and S1 — effectively no man’s land. A break below $72.99 would confirm that sellers are in full control of this range.
The Hourly Chart Leans Neutral but Points Lower
Dropping to the 1-hour chart, the regime shifts to neutral but the bias tilts downward, with SOL at $73.65 sitting below a tight cluster of EMAs that form a ceiling just above price. The EMA20 at $74.15, EMA50 at $74.11, and EMA200 at $74.73 have all converged into resistance.
The 1H RSI at 41.17 mirrors the daily reading — not oversold, just weak. Furthermore, the MACD on the hourly has the line at -0.05 crossing below the signal at +0.07, with a negative histogram of -0.12. It is a fresh bearish cross that aligns directionally with the daily signal.
The 1H Bollinger Bands are tight: midline at $74.38, upper band $75.06, lower band $73.70. SOL sits barely inside the lower band at $73.65, and a close below $73.70 on the hourly would be a meaningful short-term signal. The hourly pivot structure — PP at $73.66, R1 at $73.79, S1 at $73.51 — tells the same story: the range is narrow and the bias points downward.
The 15-Minute Frame Offers Execution Context Only
On the 15-minute chart, price at $73.65 sits below all three EMAs: EMA20 at $73.92, EMA50 at $74.15, and EMA200 at $74.03. The RSI at 38.54 approaches the low end of neutral territory, and the MACD histogram at -0.02 is nearly flat after a negative cross. This suggests the short-term selling impulse may be losing momentum momentarily. However, this only offers a brief consolidation context — it does not override the bearish signal from higher timeframes.
Solana DeFi Activity Cools Across the Ecosystem
On-chain data from DefiLlama reveals a meaningful cooling in Solana’s DeFi ecosystem. PumpSwap saw fees drop 28.1% over the past day and 31.54% over 30 days. Raydium AMM posted a 17.81% daily fee decline and a more significant 35.24% drop over 30 days. Orca DEX was hit hardest on the monthly view, down 50.26% over 30 days.
The cooling on-chain activity aligns with where the Solana price today finds itself — trapped below resistance with no speculative tailwind to fuel a breakout. When users trade less actively on-chain, demand for SOL as a gas and staking asset weakens alongside it. That said, HumidiFi bucked the trend with 32.87% fee growth over 7 days, and BisonFi surged 145.05% week-over-week — but those remain isolated pockets of activity, not a systemic reversal.
Bullish Scenario: What Needs to Happen for a Reversal
For the bulls to build a credible case, SOL must first reclaim the daily pivot at $74.14, then push through the EMA20 cluster around $74.15–$75.40. A convincing daily close above $75.40 would be the first real sign that sellers are losing control. If that level flips to support, the next targets become the Bollinger Band midline at $75.71 and then R1 at $74.77 on the pivot table. Invalidation of this scenario is straightforward: failure to hold $72.99 on any attempted recovery would put the Bollinger Band floor at $72.64 in the crosshairs immediately.
Bearish Scenario: The Path of Least Resistance
The bearish case requires less imagination right now. Price sits below all major EMAs, the daily MACD cross is negative, RSI remains stuck below 50, the macro backdrop is in Extreme Fear, and on-chain activity is cooling. This is a convergence of weak signals that points downward. A daily close below $72.99 would likely accelerate selling toward the $72.64 Bollinger Band low and potentially deeper. The EMA200 at $94.16 is not a near-term target in either direction — it simply highlights how disconnected SOL is from its long-term equilibrium. Invalidation here would require a sharp, high-volume reclaim of $75.40 or above with improving RSI momentum.
How to Read This Market Setup
This is a market where the risk-reward for aggressive long positioning is genuinely poor. The daily is bearish, the hourly is neutral-to-weak, and macro sentiment sits in Extreme Fear according to the Fear & Greed Index at 25. The broader crypto market cap hovers around $2.27 trillion with BTC dominance at 56.4%, according to CoinGecko — an environment that does not favor altcoins.
That does not mean SOL cannot bounce — it can and will at some point — but chasing a recovery without clear confirmation is the kind of trade that tends to look smart for an hour and painful by end of day. With an ATR of $2.17 daily, volatility is real and stop placement matters. For anyone already holding a position, the levels to watch are tight: $74.14 on the upside as the first recovery gate, and $72.99 on the downside as the line between weak and genuinely broken. Neither side has made its move definitively yet, but the weight of evidence tilts toward the bears until proven otherwise.
FAQ
Why is Solana struggling despite no major sell-off?
SOL is trapped below its EMA20 ($75.40), EMA50 ($76.08), and EMA200 ($94.16) on the daily chart, with RSI at 43.8 and a negative MACD cross. The broader market is in Extreme Fear, with the Fear & Greed Index at 25 and BTC dominance at 56.4%, leaving altcoins with no macro tailwind to fuel a recovery.
What are the key support and resistance levels to watch?
The immediate support sits at $72.99 (daily S1), with the Bollinger Band floor at $72.64 acting as the next downside target. On the upside, $74.14 (daily pivot) is the first resistance, followed by the EMA20 cluster at $74.15–$75.40. A daily close above $75.40 would be the first credible sign of a bullish reversal.
Is on-chain activity on Solana declining?
Yes. PumpSwap fees dropped 28.1% in 24 hours and 31.54% over 30 days, Raydium AMM declined 17.81% daily and 35.24% monthly, and Orca DEX fell 50.26% over 30 days. HumidiFi (+32.87% over 7 days) and BisonFi (+145.05% week-over-week) are notable exceptions but do not represent a systemic trend reversal.
Nothing in this analysis constitutes financial advice; it is a technical reading of the current market structure based on publicly available data.
Disclaimer: This article is for informational purposes only and does not constitute financial advice, an investment recommendation, or a solicitation to buy or sell any financial instrument or cryptocurrency. The analysis provided is not indicative of future results. Investing in crypto assets and financial markets carries a high risk of capital loss. Always do your own research (DYOR) and consult a qualified financial advisor before making any decision.
Article produced with the assistance of artificial intelligence and reviewed by the editorial team.
