



The crypto market finds Bitcoin at a Crossroads: BTCUSDT Holds $64K as the Daily Chart Signals a Fragile Recovery. With the Fear & Greed Index at 26 and the price sandwiched between key moving averages, the next sessions could prove decisive for short-term direction.
Summary
Key takeaways
- Bitcoin trades at $64,198 as of July 12, 2026, caught between the 20-day EMA at $63,029 and the 50-day EMA at $65,305.
- The Fear & Greed Index registers 26, reflecting defensive market positioning rather than broad risk appetite.
- Hourly and 15-minute timeframes display bullish EMA stacks, though Bollinger Band compression signals an imminent breakout in either direction.
- A daily close above $65,457 would shift the regime toward bullish, while a drop below $63,029 would invalidate the recovery thesis.
- Bitcoin dominance at 56.24% and a total crypto market cap of $2.29 trillion confirm capital is sheltering in BTC rather than rotating into altcoins.
A Market Holding Its Breath at $64,000
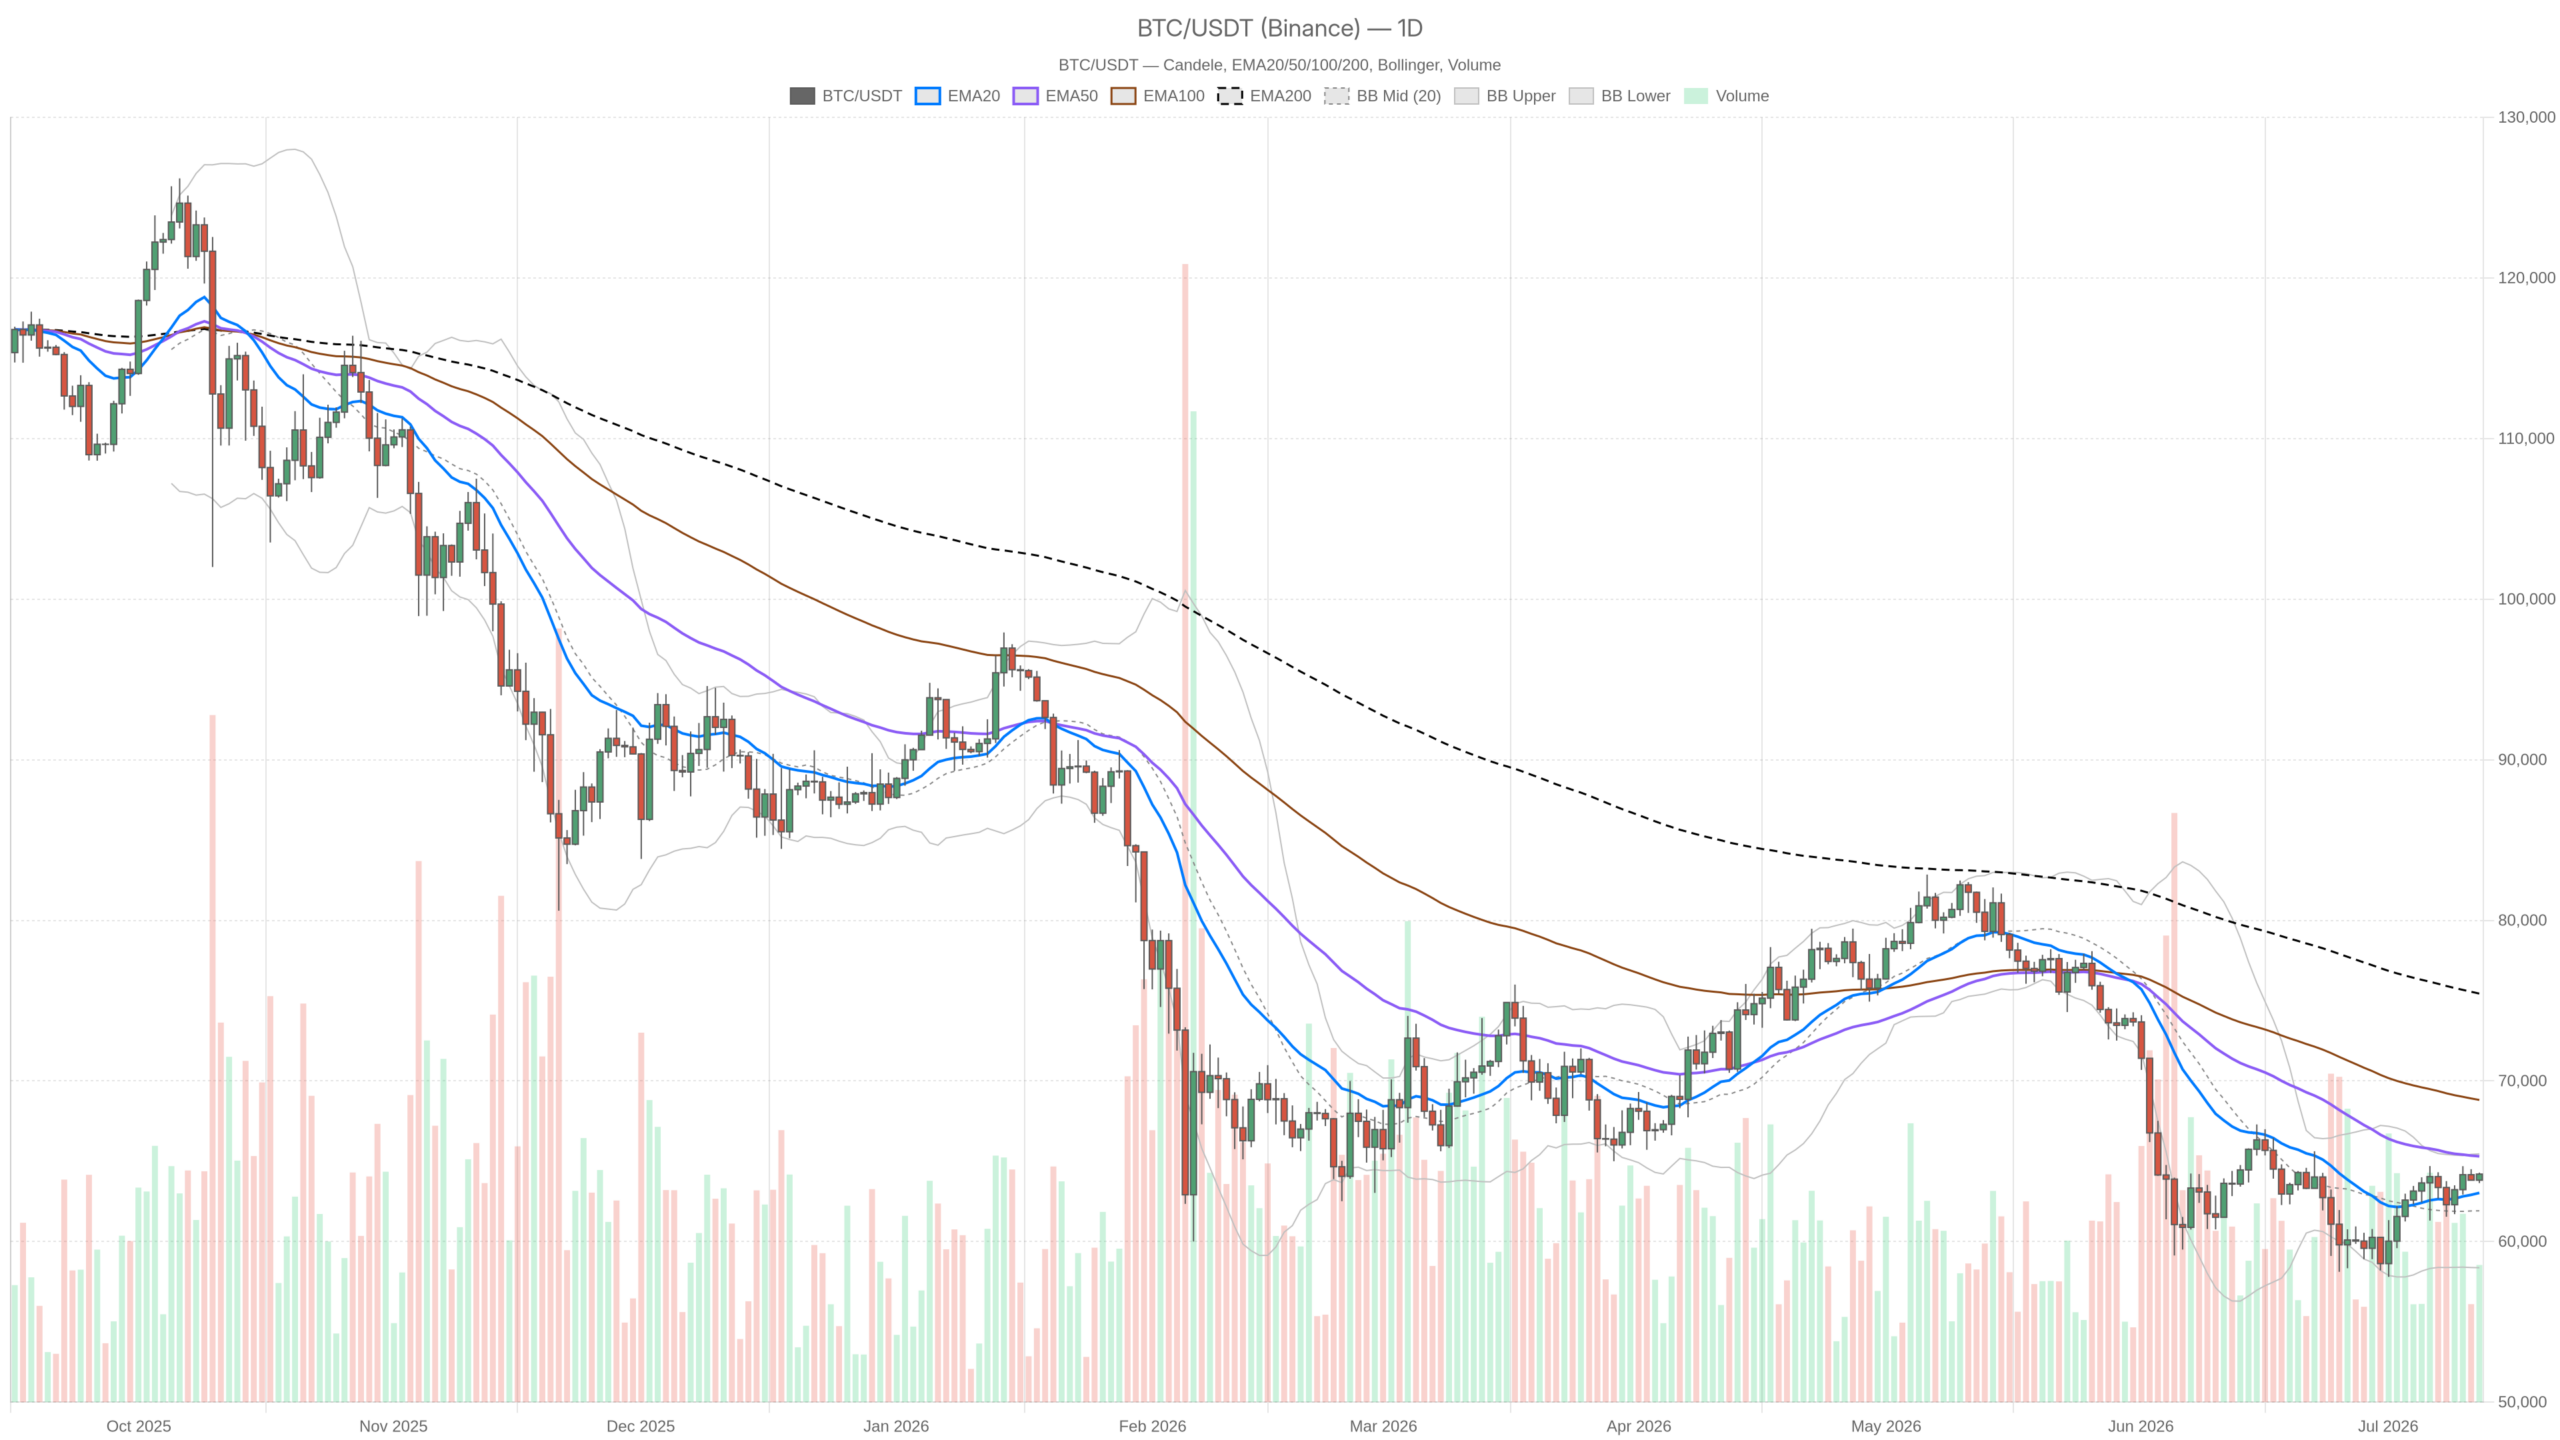
BTCUSDT sits at $64,198 — above its 20-day EMA, below its 50-day, and far beneath the 200-day at $75,438. That combination tells a story: a market that has bounced off its lows but has not yet convinced anyone the worst is over. The Fear & Greed Index at 26 confirms what the charts are already whispering. And yet, underneath that headline anxiety, the intraday structure is quietly building. The question is whether this recovery has the legs to become something more meaningful, or whether it exhausts itself against the resistance overhead.
Meanwhile, a Fortune report from July 9 was already tracking Bitcoin’s price closely, underscoring how much attention this level is getting from mainstream financial media. That kind of spotlight tends to amplify reactions to any breakout or breakdown. The total crypto market cap sits at approximately $2.29 trillion according to CoinGecko data, with Bitcoin dominance at 56.24%. When dominance is elevated alongside a Fear reading, it typically means money is sheltering in BTC rather than rotating into altcoins — defensive positioning dressed up as relative strength.
Daily Timeframe: Cautiously Constructive, Not Bullish
For now, the D1 chart carries a neutral designation, and that is the right call. Price is sandwiched between the 20-day EMA at $63,029 and the 50-day EMA at $65,305. The 200-day EMA at $75,438 is so distant it functions more as a long-term reference than an actionable level. Bulls have reclaimed the short-term moving average but have not cleared the medium-term one. That is not a trend resumption. That is a recovery attempt still waiting for confirmation.
The MACD presents one of the more encouraging signals. The line sits at -196.61, still negative, but the histogram has swung to +567.66 with the signal line at -764.26 — the gap between line and signal is closing rapidly. Momentum is shifting, even if it has not crossed into positive territory yet. Combined with an RSI of 53.71 — above the midpoint, not overbought — the setup has room to run higher without immediately triggering mean-reversion selling. However, RSI at 53 is also uninspiring. It is more consistent with a market grinding through overhead supply than one preparing for an explosive move.
However, Bollinger Bands place the midline at $61,913, the upper band at $65,457, and the lower band at $58,368. Price is pressing the upper band without quite touching it. A clean break and close above $65,457 would be genuinely significant. A rejection here and a slide back toward the midline would be equally telling. The ATR of $1,905 gives a sense of how much the market breathes daily — a wide enough range to punish imprecise entries. Pivot analysis shows PP at $64,043, R1 at $64,445, and S1 at $63,796, placing price in a no-man’s land that requires directional resolution.
Hourly Structure: Where the Bullish Argument Lives
The H1 chart tells a more optimistic story. The regime here is classified as bullish, and the structure supports it. Price at $64,199 is above all three key EMAs — the 20 at $64,102, the 50 at $64,020, and the 200 at $63,177. All three are stacked in bullish order beneath price. That is the kind of alignment short-term traders look for as confirmation that near-term momentum is intact. The MACD is positive — line at 26.21 versus signal at 1.48, with a histogram of 24.73 — showing the hourly move has real momentum behind it.
Moreover, RSI on H1 at 54.77 mirrors the daily reading — above 50, not stretched. The Bollinger Bands on this timeframe are notably compressed: upper at $64,311, lower at $63,800, with a midline at $64,056. That compression is a coiled spring dynamic. Price is trading near the upper band of a tight range, which can resolve either with a breakout or with a sharp snap back to the mean. Hourly pivots reinforce how tight this range is: PP at $64,210, R1 at $64,243, S1 at $64,167 — all within roughly $80 of each other. This is a market waiting for a trigger.
15-Minute Context: Execution-Level Precision
The 15-minute chart is also flagged as bullish and shows a clean EMA stack — 20 at $64,144, 50 at $64,093, 200 at $64,026 — all beneath price. That said, the MACD histogram at 3.29 is fading slightly from recent highs, with the line at 35.70 versus signal at 32.41. That is a subtle early warning that very short-term momentum is losing urgency. Not a reversal signal, but a sign the move may need to consolidate before its next leg. RSI at 56.38 is clean and neutral-bullish. The Bollinger Bands here are extremely tight — a range of just $200 — which means whichever way it resolves in the next few hours will likely dictate the hourly direction.
Bullish and Bearish Scenarios
If Bitcoin is going to make a meaningful move higher, the roadmap is relatively clear. Price needs to clear and hold above the daily R1 at $64,445, then take out the 50-day EMA at $65,305. The upper Bollinger Band at $65,457 sits almost exactly at the 50-day EMA — that confluence makes it the single most important resistance level in the near term. A daily close above $65,457 would change the conversation materially. Uniswap V3 fees are up 18.14% over the past day and 36.91% over the past week, according to DefiLlama data, suggesting on-chain activity is picking up alongside the recovery attempt.
What invalidates the bullish case? A daily close below the 20-day EMA at $63,029 would be a clear warning. That level also sits close to the hourly 200 EMA at $63,177 — a cluster of support that, if broken on a closing basis, would flip the short-term narrative. Below that, the daily Bollinger Band lower level at $58,368 becomes the next real structural reference, and nobody long at $64,000 wants to be having that conversation.
The bear case, however, does not require a dramatic catalyst. It only requires the current recovery to run out of fuel at the 50-day EMA and upper Bollinger Band confluence near $65,300–$65,457. A rejection there, particularly if accompanied by rising volume on the down-move, would suggest the daily structure remains in a lower-high pattern. The Fear & Greed reading of 26 is a reminder that market participants are not positioned aggressively long — meaning selling pressure from those who bought cheaper and want to exit is likely present near current levels.
Positioning, Risk, and the Honest Assessment
The honest read right now is that Bitcoin is in the most ambiguous part of a potential recovery — past the initial bounce, not yet through the overhead resistance that would confirm it. The daily is neutral, the hourly is bullish, and the 15-minute is coiling. Timeframe disagreement at this level is not a contradiction; it is a warning that resolution is imminent. The ATR of $1,905 on the daily means any position taken here has to account for nearly $2,000 of potential intraday noise in either direction.
The Fear & Greed reading of 26 cuts both ways. Yes, fearful markets can keep falling. Historically, however, sustained fear readings at these levels have often preceded durable rallies — not because sentiment is a reliable timing tool, but because it reflects how lightly the market is positioned. A positive catalyst, or simply the absence of further negative news, can create outsized upside moves when the crowd is already leaning defensive. The setup confirms why analysts describe Bitcoin at a Crossroads: BTCUSDT Holds $64K as the Daily Chart Signals a Fragile Recovery — the technical evidence is split cleanly between bullish and bearish narratives. Patient confirmation, specifically a daily close above $65,305, is worth more than anticipatory positioning.
FAQ
What are the key resistance levels for Bitcoin right now?
The most important resistance sits at the confluence of the 50-day EMA at $65,305 and the daily upper Bollinger Band at $65,457. A daily close above this zone would materially shift the market regime from neutral toward bullish. Before that, the daily R1 pivot at $64,445 represents the first hurdle price must clear.
What does the Fear & Greed Index at 26 signal for traders?
A reading of 26 places the market firmly in Fear territory, indicating defensive positioning rather than aggressive risk-taking. Historically, sustained fear at these levels has often preceded durable rallies, though it can also accompany further downside if negative catalysts emerge. Combined with Bitcoin dominance at 56.24%, it suggests capital is sheltering in BTC rather than rotating into altcoins.
What confirmation should traders wait for before considering long entries?
A daily close above the 50-day EMA at $65,305 would provide the most meaningful bullish confirmation. Until that level is cleared, the daily timeframe remains neutral and the recovery unconfirmed. Conversely, a daily close below the 20-day EMA at $63,029 would serve as a clear warning signal that the bounce is failing.
Disclaimer: This article is for informational purposes only and does not constitute financial advice, an investment recommendation, or a solicitation to buy or sell any financial instrument or cryptocurrency. The analysis provided is not indicative of future results. Investing in crypto assets and financial markets carries a high risk of capital loss. Always do your own research (DYOR) and consult a qualified financial advisor before making any decision.
Article produced with the assistance of artificial intelligence and reviewed by the editorial team.
