




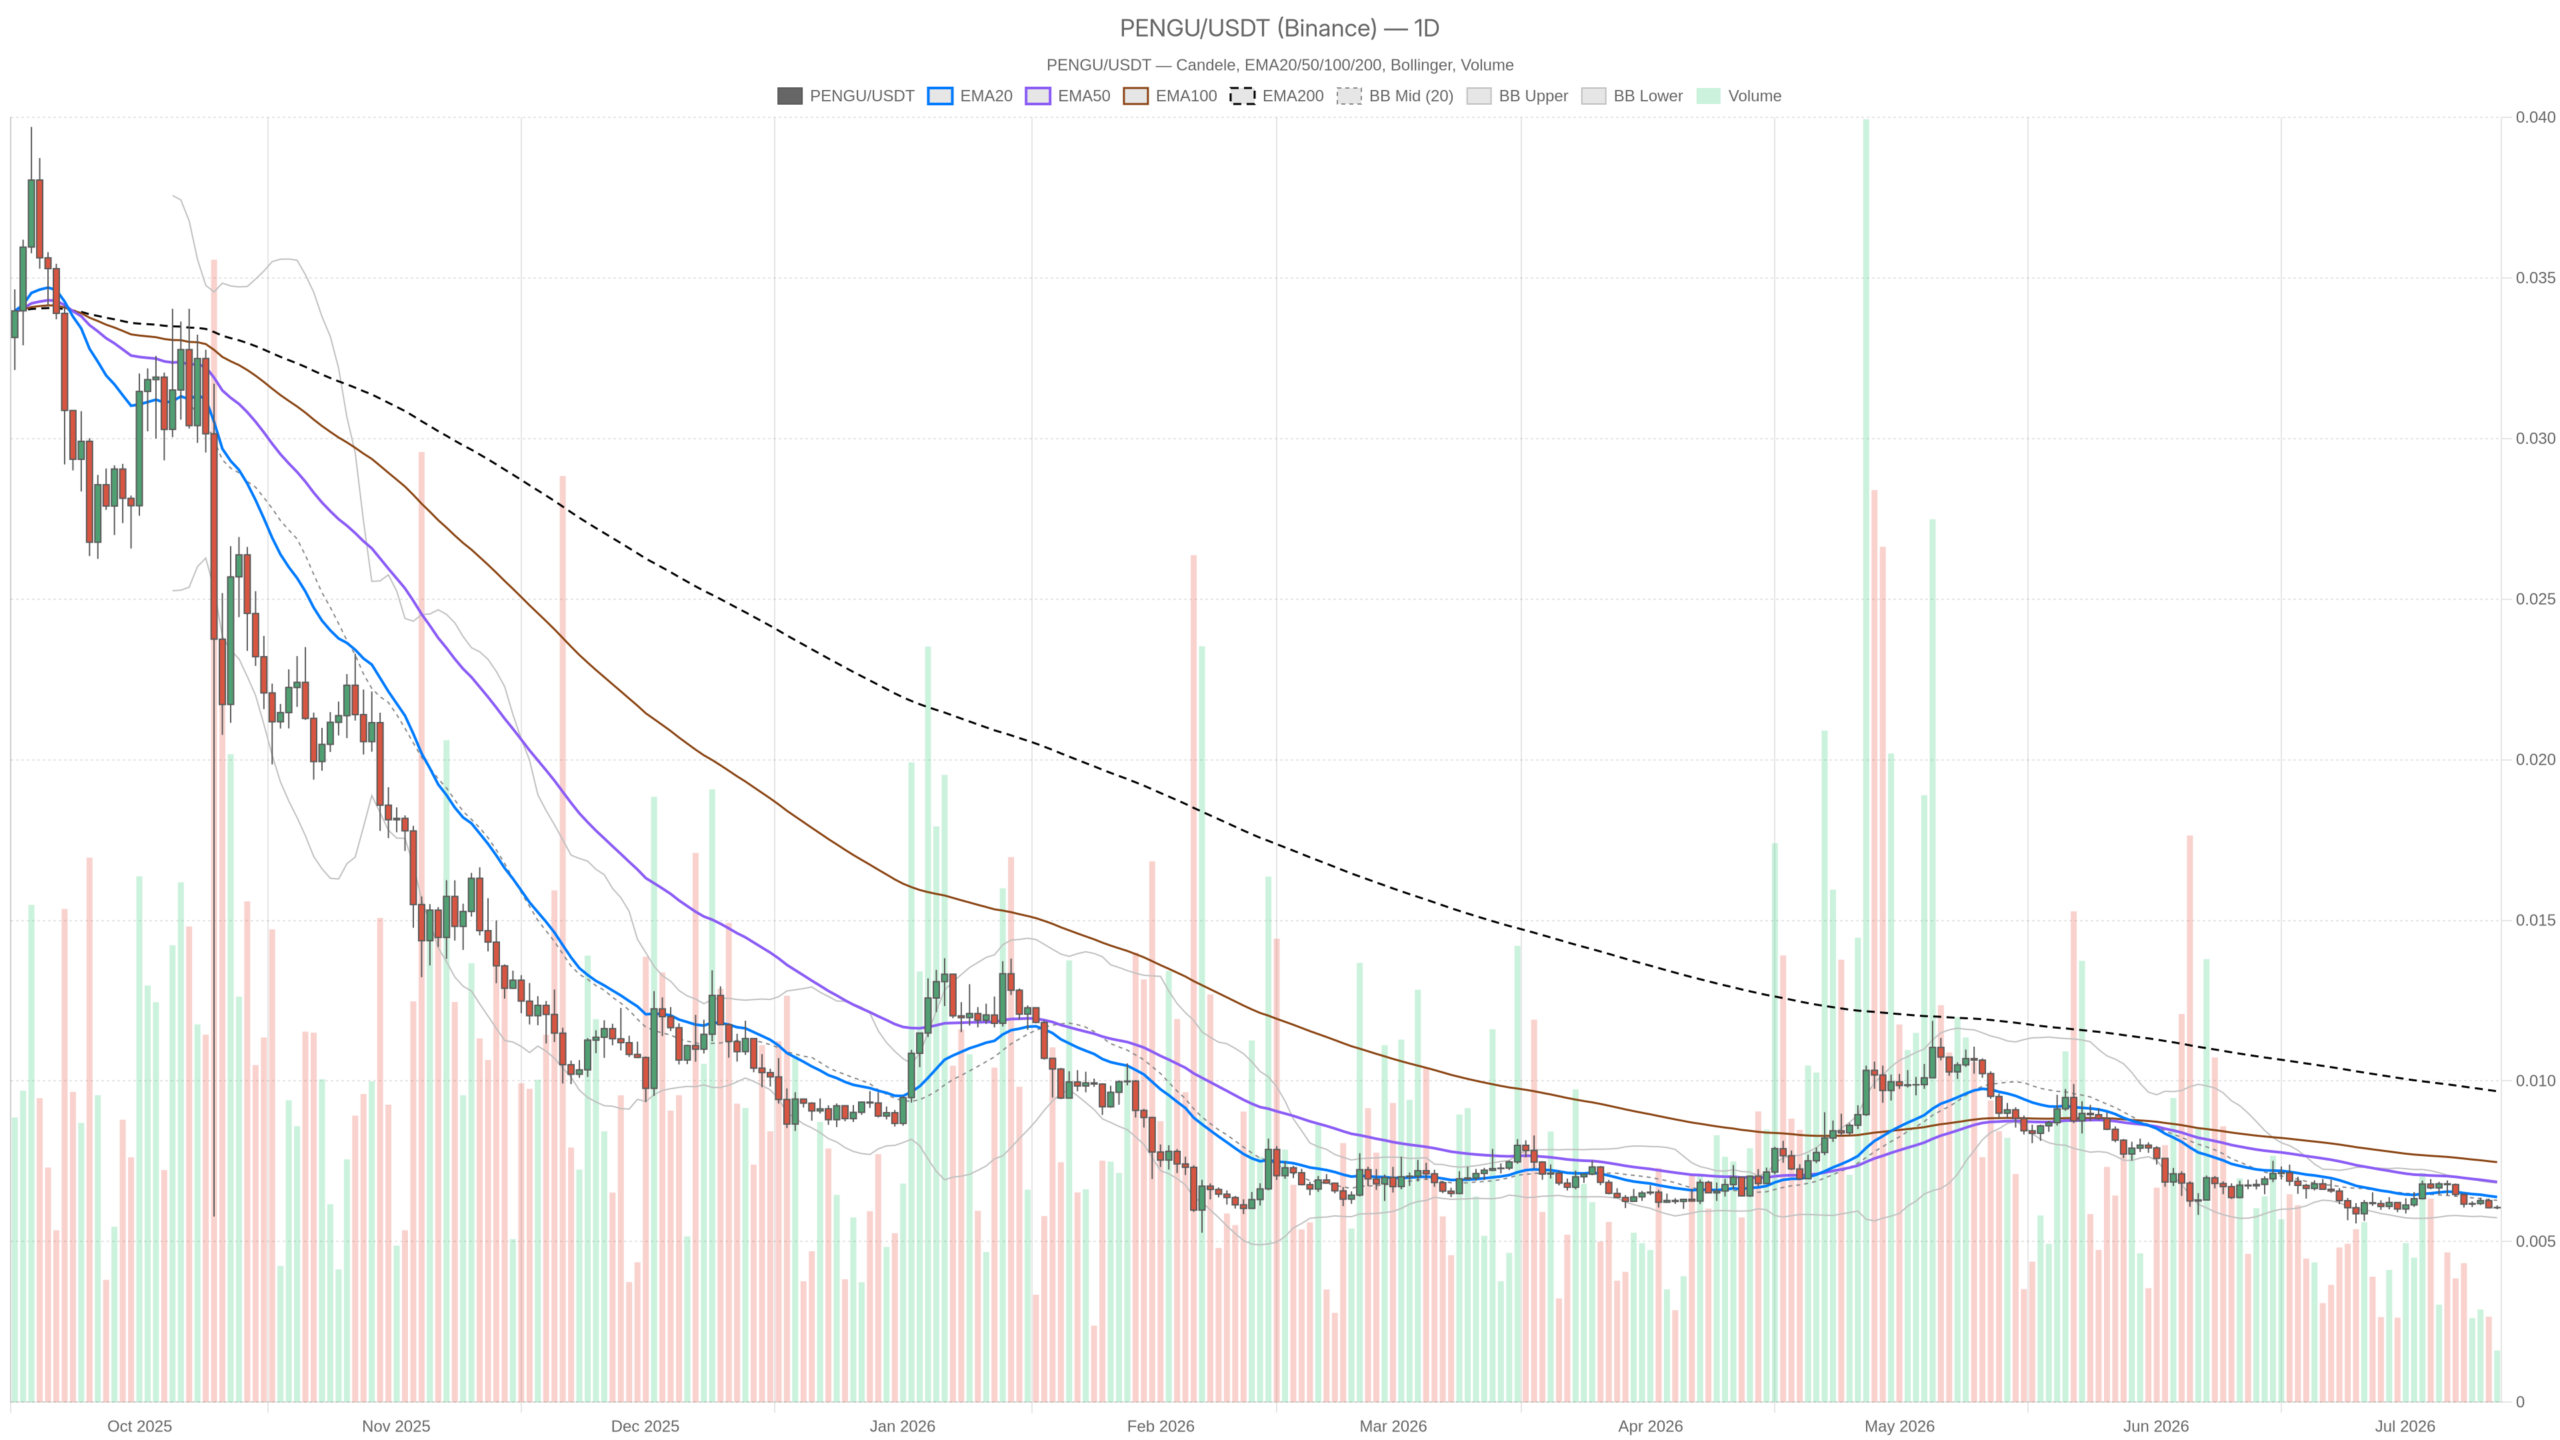
As of July 12, 2026, the situation described by PENGUUSDT at the Edge of Zero: Why This Compression Could Be a Trap demands attention before the next move unfolds, with the market frozen at $0.01.
Summary
Key takeaways
- PENGUUSDT trades at $0.01 with daily RSI at 40.42 and hourly RSI at 40.12, both below the 50 midline.
- Bollinger Bands across all timeframes are fully compressed at $0.01, signaling an imminent breakout in either direction.
- MACD and ATR both register zero, confirming a complete absence of measurable momentum and volatility.
- Bitcoin dominance at 56.24% and the Fear & Greed Index at 26 create a hostile macro backdrop for small-cap tokens.
- Bearish alignment across daily, hourly, and 15-minute charts favors a downside resolution of the current compression.
PENGUUSDT Structure: A Market Frozen in Bearish Amber
The structure across all three timeframes — daily, hourly, and 15-minute — is unambiguously bearish, offering no divergence to suggest that a recovery base is quietly forming beneath the surface. Every layer of the chart tells the same story.
The daily RSI sits at 40.42 and the 1H RSI at 40.12, both meaningfully below the 50 midline that separates expansionary from contractionary momentum. Neither reading has reached oversold territory, which is precisely what makes the situation uncomfortable: there is no capitulation signal to suggest that sellers have exhausted themselves. The 15-minute RSI at 45.41 inches closer to neutral but still fails to indicate any real buying conviction at the intraday level.
What the RSI picture describes across all frames is a market drifting downward with low energy — not crashing, not recovering, just quietly eroding. This alignment removes one of the most common escape hatches analysts rely on: the idea that a shorter timeframe might be building a base while the macro trend stays weak. Here, there is no such divergence anywhere.
When Every Indicator Converges to the Same Price
The EMA stack — the 20, 50, and 200-period lines — has converged entirely at $0.01, signaling a market where no buyers are willing to push price away from this level with any conviction. The asset has essentially collapsed into its moving averages rather than bouncing off them.
In normal conditions, a price trading below its 200 EMA is a textbook bearish signal. Trading below all three confirms that no trend layer offers dynamic support. Moreover, the convergence is so complete that the EMAs provide no meaningful gradient at all, leaving no structural framework for a recovery to build upon.
The Bollinger Bands reinforce this reading dramatically. All three bands — upper, middle, and lower — are pinned at $0.01. That level of compression is extreme and serves as a well-known precursor to sharp directional moves. However, the direction is decided by the prevailing structure at the time of the breakout. Given the bearish regime flagged on all three timeframes, a squeeze resolving to the downside carries considerably more probability weight.
The MACD across all timeframes reads as zero across line, signal, and histogram. Combined with an ATR of zero, this confirms that measured volatility and momentum have been completely drained from the asset. Pivot levels — support, resistance, and pivot point — are all anchored identically at $0.01, leaving no technical architecture above or below to frame a structured trade. The complete convergence raises the question at the heart of PENGUUSDT at the Edge of Zero: Why This Compression Could Be a Trap rather than a foundation for recovery.
The DEX Landscape and What It Tells You About Risk Appetite
DEX activity across major venues is fragmented and inconsistent, offering no evidence of a broad liquidity tide that would lift micro-cap tokens like PENGU. The data suggests sporadic engagement rather than a structural shift in risk appetite.
According to DefiLlama data, Uniswap V3 has seen a 30-day fee increase of 330.09%, with a 1-day change of +18.14% and a 7-day change of +36.91%. That kind of fee surge in the dominant DEX venue suggests elevated trading activity at the decentralized layer. However, it does not automatically translate into altcoin demand. Uniswap V4, Fluid DEX, and Curve DEX are all showing sharp 1-day fee drops of -54.86%, -55.54%, and -22.67% respectively, suggesting the spike is concentrated in V3 rather than representing a broad DeFi liquidity boom.
Ekubo stands out with a 7-day fee jump of +70.75%, though its 1-day figure is also deeply negative at -54.62%. Meanwhile, the broader picture painted by DEX activity is one of venue-specific surges — not the kind of rising tide that lifts all boats in the micro-cap space.
Bullish Scenario and What Would Make It Real
A credible bullish reversal requires a Bollinger Band expansion with price pushing above $0.01 on increasing volume, accompanied by RSI reclaiming the 50 level on the daily chart. Without these signals, any bounce remains speculative.
A MACD histogram that begins registering positive values — even marginally — would confirm that momentum is returning rather than merely pausing. In that scenario, the 20 EMA becoming dynamic support, with price bouncing off a rising short-term moving average, would provide the key structural confirmation. This scenario is invalidated immediately if any attempted breakout fails to hold $0.01 and price begins printing consistent closes below it.
Bearish Scenario and Its Natural Extension
The bearish scenario is straightforward: a continuation of the compression period followed by a breakdown below $0.01 would confirm that the apparent floor was structural resistance masquerading as support. The setup requires little imagination given the current data.
Moreover, in a Fear-dominated market with Bitcoin dominance elevated above 56%, the flow conditions for such a breakdown are already in place. This scenario is invalidated if daily RSI crosses and holds above 50 alongside a measurable expansion of the Bollinger upper band, suggesting that capital has actually returned to the asset rather than just paused its exit.
Positioning Context: Reading the Room on PENGU
PENGUUSDT presents an asset in a state of suspended animation — bearish by every structural measure, yet technically capable of a violent move in either direction the moment the compression resolves. The macro environment is not supportive: fear is dominant, BTC is absorbing capital, and DEX activity is uneven at best.
Meanwhile, the complete absence of measurable volatility, with ATR at zero, means there is currently no reward being offered for holding through the uncertainty — just the risk that the spring uncoils to the downside. The Bollinger squeeze is real and will resolve; the question is when and in which direction.
Consequently, traders watching this setup should understand that the bearish structural alignment across D1, H1, and M15 means any long positioning requires an explicit catalyst or clear evidence of momentum returning. Volatility in micro-cap assets can shift rapidly, and the compressed state of this market means that when movement does return, it will likely be sharp. Sizing, patience, and defined invalidation levels matter more here than conviction.
FAQ
Is PENGUUSDT bearish or bullish right now?
The structure is unambiguously bearish across daily, hourly, and 15-minute timeframes. RSI readings sit below 40 on both the daily and hourly charts, and all EMAs, Bollinger Bands, and pivot levels are converged at $0.01 with no dynamic support visible anywhere in the structure.
What does the Bollinger Band compression at $0.01 signal?
A Bollinger Band squeeze of this magnitude — with all three bands pinned at the same price — is an extreme compression that typically precedes a sharp directional move. The direction is determined by the prevailing structure, which in this case is bearish across all timeframes, giving a downside breakout higher probability.
Can PENGU reverse from the $0.01 level?
A reversal is possible but requires specific conditions: a Bollinger Band expansion above $0.01 with rising volume, RSI reclaiming the 50 level on the daily chart, and the MACD histogram registering positive values. Without these signals, assuming $0.01 is a floor remains speculative rather than evidence-based.
The data leaves little room for ambiguity: PENGUUSDT is compressed, bearish, and awaiting a catalyst. When the Bollinger squeeze finally resolves, the structural weight of the evidence suggests the path of least resistance points downward — though the speed of the move, in either direction, is likely to catch traders off guard.
Disclaimer: This article is for informational purposes only and does not constitute financial advice, an investment recommendation, or a solicitation to buy or sell any financial instrument or cryptocurrency. The analysis provided is not indicative of future results. Investing in crypto assets and financial markets carries a high risk of capital loss. Always do your own research (DYOR) and consult a qualified financial advisor before making any decision.
Article produced with the assistance of artificial intelligence and reviewed by the editorial team.
