




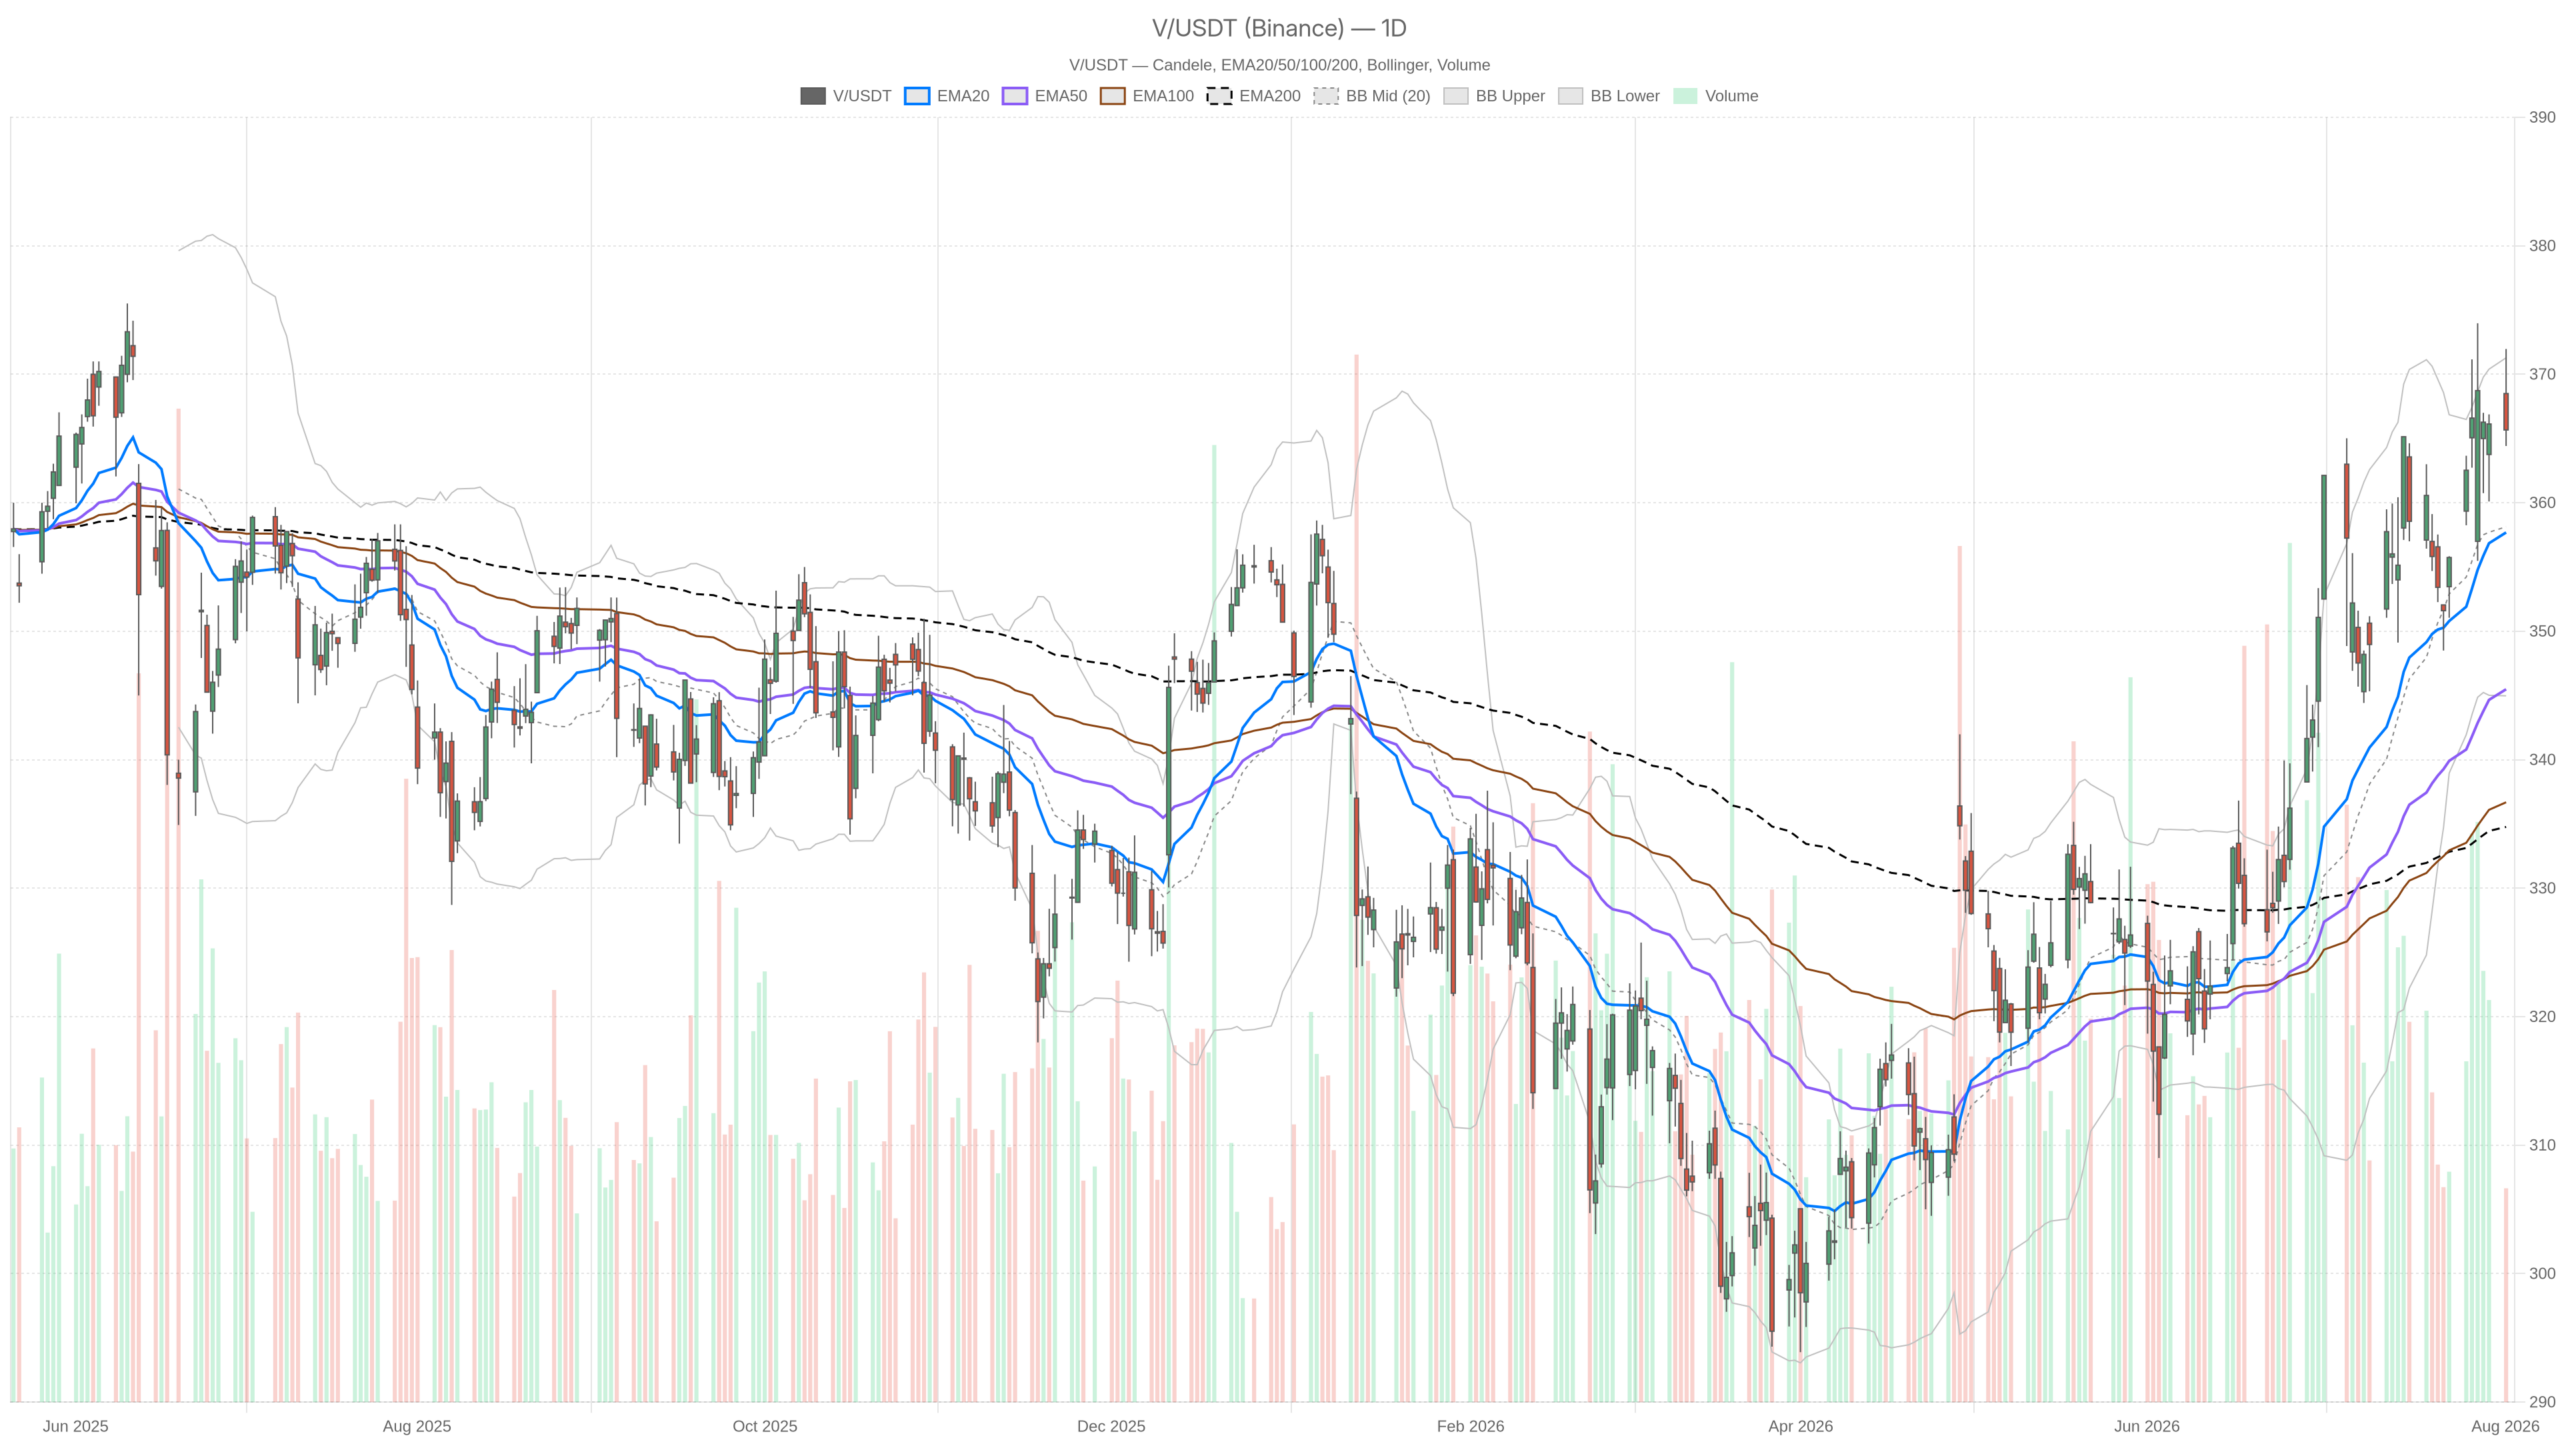
Visa stock closed at 365.67, pulling back from an intraday high of 371.97 after an initial rally on the $2.4 billion BioCatch acquisition. The daily trend remains structurally bullish, though short-term momentum shows signs of pausing.
Summary
Key takeaways
- Visa stock closed at 365.67, retreating from a daily high of 371.97 on volume of 4,160,393 shares.
- The 20, 50, and 200-period EMAs are stacked bullishly at 357.69, 345.48, and 334.77, confirming an intact uptrend.
- RSI14 at 62.73 signals bullish momentum without being overbought, leaving room for further upside.
- Visa announced the $2.4 billion acquisition of BioCatch to strengthen AI-powered fraud detection and its value-added services segment.
- The daily MACD histogram turned slightly negative at -0.04, hinting at flattening upward momentum.
Daily Trend: Visa Stock Structure Still Points Higher
The daily trend for Visa stock remains structurally bullish. The 20, 50, and 200-period EMAs stack bullishly at 357.69, 345.48, and 334.77 respectively. This alignment confirms an uptrend that has been building for months. Price trades above all three moving averages, signaling buyer control across multiple time horizons.
RSI14 sits at 62.73, comfortably bullish but not yet stretched into overbought territory. That leaves room for further upside without an immediate momentum warning. However, the MACD tells a slightly different story at the margin. The MACD line at 6.98 sits just below its signal line at 7.02, producing a negative histogram reading of -0.04. This is a subtle but real signal that upward momentum is flattening.
Bollinger Bands add more context. The mid-band rests at 358.13 and the upper band at 371.28. Thursday’s high of 371.97 pushed price right against the upper boundary before pulling back to 365.67. That rejection near the upper band points to a volatile market still testing its recent range. The daily ATR14 of 8.16 reinforces this reading.
The daily pivot structure underscores the tension. The pivot point sits at 367.35, with resistance at 370.29 (R1) and support at 362.74 (S1). Price closed below the pivot but above S1. This suggests the daily session ended in a mildly defensive posture, even within an overall bullish regime.
1H Timeframe: Momentum Cools, Confirming a Pause
On the 1H chart, Visa stock shows consolidation rather than a reversal. Price closed at 365.70, essentially flat against the hour’s open of 366.41. The 1H EMA20 at 365.87 and EMA50 at 364.08 sit close together. Price hovers right between them, a classic sign of consolidation without directional conviction. Meanwhile, the 1H EMA200 at 353.25 remains far below current price. The longer-term hourly trend stays tilted higher even as short-term momentum stalls.
RSI14 on the hourly chart reads 50.42, a neutral level that offers no strong signal either way. The MACD histogram is negative at -0.15. The MACD line at 0.38 sits below its signal at 0.52, echoing the loss of upside thrust seen on the daily chart. Bollinger Bands on the 1H show the mid-band at 365.36, upper at 368.40, and lower at 362.31. Price sits almost exactly on the mid-band, reinforcing the sense of equilibrium.
Therefore, the hourly regime is explicitly neutral. This aligns with what the indicators show: a pause, not a breakdown. Still, it weakens the immediate conviction behind the daily bullish regime.
15-Minute View: Execution Context Only
The 15-minute chart offers execution context only, with no directional bias. Visa stock closed at 365.70 with EMA20 at 366.07 and EMA50 at 366.04 sitting just above. RSI14 at 46.82 and a nearly flat MACD histogram of 0.01 confirm the short-term chart is also neutral. No clear intraday trigger exists in either direction.
The 15m pivot at 365.71 frames a tight range. Resistance sits at 366.06 and support at 365.36. This range helps time entries but should not be read as a directional signal. This timeframe is best treated as execution context rather than a source of bias.
Bullish Scenario
The bullish case for Visa stock depends on the daily trend reasserting itself. A reclaim of the daily pivot at 367.35, followed by a push through R1 at 370.29, would suggest buyers are absorbing the recent pullback. Confirmation would come from the hourly chart flipping from neutral to bullish. Ideally, RSI14 would move back above 55 and the MACD histogram would turn positive again.
In this scenario, the BioCatch acquisition narrative would likely continue to support sentiment. The deal strengthens Visa’s value-added services and fraud detection capabilities. This gives fundamental backing to any technical breakout attempt.
Bearish Scenario and Invalidation
The bearish risk is that the daily rejection near the upper Bollinger Band marks the start of a deeper consolidation. A break below the daily S1 at 362.74 would be the first warning sign. This would be especially concerning if the hourly EMA20 and EMA50 roll over together. Should RSI14 on the daily chart slip below 50, the bullish regime label itself would come under question.
In contrast to the bullish path, this scenario would see the daily MACD histogram deepen further into negative territory. That would confirm the recent momentum stall has evolved into an actual trend shift, not a temporary pause.
Closing Take
Overall, Visa stock remains structurally bullish on the daily timeframe. Yet the hourly and 15-minute charts both flash neutral, and that conflict matters. The daily ATR14 of 8.16 versus the tighter hourly ATR14 of 2.34 shows volatility compressing intraday. At the same time, the broader range stays wide. The BioCatch deal adds a fundamental layer that could support longer-term positioning.
Therefore, positioning here should account for continued short-term consolidation. The daily trend may either reassert itself or give way to a more meaningful pullback. Near-term uncertainty is elevated. Traders should weigh both the strength of the underlying trend and the clear loss of short-term momentum.
FAQ
What did Visa announce about BioCatch?
Visa agreed to acquire BioCatch for $2.4 billion. BioCatch uses machine-learning models to detect coercion and manipulation in digital transactions in real time. The deal strengthens Visa’s fraud-prevention capabilities and extends its value-added services segment, one of the company’s fastest-growing divisions.
Is Visa stock still in a bullish trend?
Yes, the daily trend remains structurally bullish. The 20, 50, and 200-period EMAs are stacked bullishly at 357.69, 345.48, and 334.77. RSI14 at 62.73 signals bullish momentum without being overbought. However, the MACD histogram has turned slightly negative, suggesting flattening momentum at the margin.
What price levels should traders watch for Visa stock?
On the upside, the daily pivot at 367.35 and R1 at 370.29 are key resistance levels. On the downside, S1 at 362.74 serves as the first support zone. A break below S1 would be an early warning of deeper consolidation rather than a simple intraday pullback.
How does short-term momentum look for Visa stock?
Short-term momentum has cooled considerably. The hourly RSI14 reads 50.42, a neutral level with no directional signal. The hourly MACD histogram is negative at -0.15. Both the 1H and 15-minute charts show neutral regimes, suggesting a pause rather than a breakdown is underway.
Disclaimer: This article is for informational purposes only and does not constitute financial advice, an investment recommendation, or a solicitation to buy or sell any financial instrument or cryptocurrency. The analysis provided is not indicative of future results. Investing in crypto assets and financial markets carries a high risk of capital loss. Always do your own research (DYOR) and consult a qualified financial advisor before making any decision.
Article produced with the assistance of artificial intelligence and reviewed by the editorial team.
