



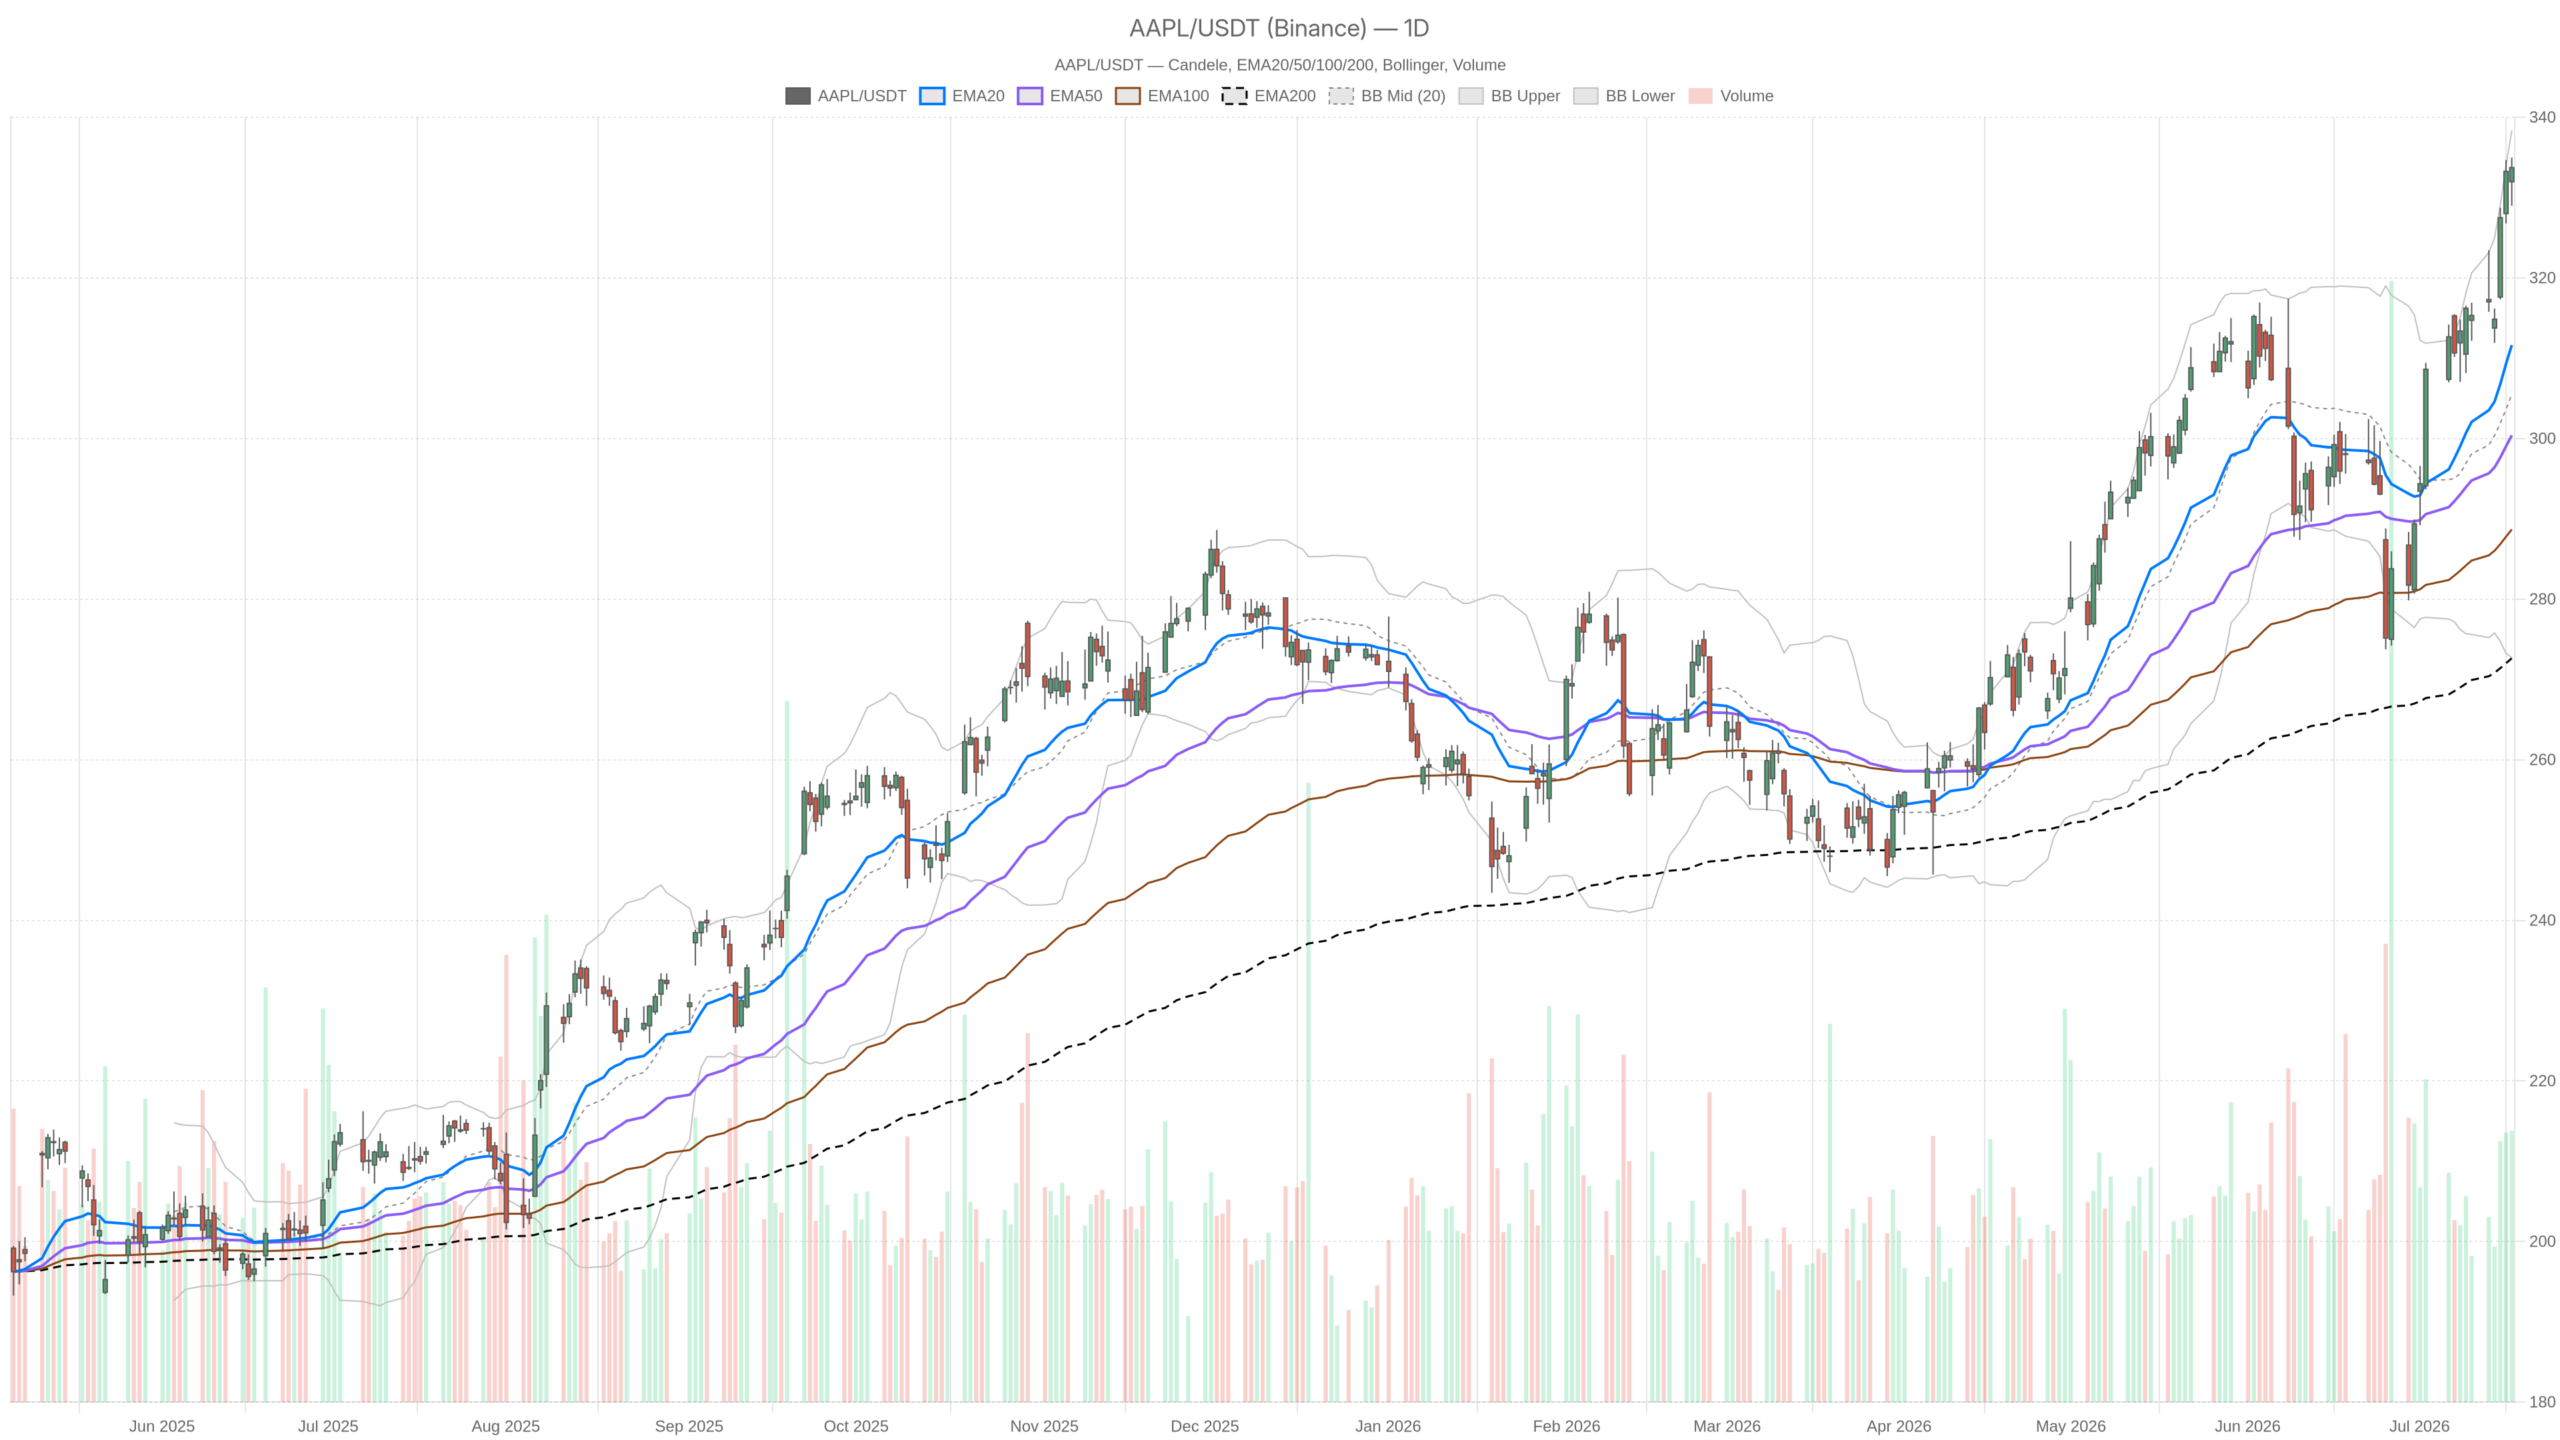
Apple stock closed at $333.74 on July 17, sitting above every major moving average. The daily regime is firmly bullish, and momentum has outlasted a broad AI-driven chip selloff. The central question now is whether this run can carry the stock meaningfully higher.
Summary
Key takeaways
- AAPL closed at $333.74 on July 17, trading above all major daily moving averages in a clean stacked configuration.
- Daily RSI at 71.65 signals overbought conditions, compressing the probability of immediate upside continuation without a pause first.
- Daily MACD remains bullish with expanding momentum, while the hourly MACD shows a minor bearish crossover hinting at short-term consolidation.
- HSBC upgraded Apple stock citing an “operational turning point,” while Berkshire Hathaway holds it as a top position in its $348 billion portfolio.
- The upcoming earnings report is the decisive catalyst; key resistance sits at $336.15 and $338.35, with support at $330.16.
Apple Stock Daily Structure: Bullish Trend With Overbought Warnings
Apple stock’s daily trend is unambiguously bullish. Price sits well above the EMA20, EMA50, and EMA200 in a clean stacked configuration that reflects sustained accumulation rather than a fleeting spike.
The EMA20 sits at $311.64, the EMA50 at $300.40, and the EMA200 at $272.63. That kind of separation between price and the long-term average signals persistent institutional buying, not speculative momentum. However, the daily RSI has climbed to 71.65 — comfortably overbought. This alone doesn’t terminate a trend. Still, extended readings at this level tend to compress the probability of immediate upside continuation without a pause or consolidation first.
The MACD reinforces the bullish thesis. The line reads 8.82 against a signal of 5.48, with a histogram of 3.34. Momentum is still expanding, not contracting. A divergence or histogram rollover would be a warning shot — for now, neither is present.
Volatility Context and Key Price Levels
Bollinger Bands place Apple stock very close to the upper band at $338.35, with the midline at $305.52. A close near the upper band in a trending market isn’t inherently bearish — it can simply reflect momentum. But it does flag a zone where resistance and mean-reversion pressure tend to intensify.
The daily ATR of 8.26 points to a moderately volatile environment. Intraday swings of that magnitude are typical for a large-cap running at elevated prices. Pivot analysis places support at $330.16 (S1) with resistance at $336.15 (R1). Current price sits between the pivot at $332.58 and R1 — favoring continuation but leaving little room before the next overhead test.
Hourly Confirmation: Bullish Bias With a Subtle Caution Flag
The 1H chart broadly confirms the daily bullish bias. Apple stock is trading above all three hourly moving averages, though a minor MACD crossover introduces a short-term caution flag worth noting.
Price is above the H1 EMA20 at $329.61, the EMA50 at $322.68, and the EMA200 at $308.68. The regime is flagged as bullish at this timeframe, and structure remains intact. Nevertheless, the hourly MACD introduces a subtle complication. The line at 3.54 has slipped below the signal at 3.88, producing a small negative histogram of -0.33. This is not a trend reversal signal. Rather, it reflects short-term momentum softening — the kind that typically precedes brief consolidations within an ongoing uptrend.
The hourly RSI at 65.57 is elevated but not overextended. This supports the view that AAPL still has residual intraday energy, even if the immediate pace of gains may be moderating. Bollinger Bands on the 1H frame place price between the midpoint at $330.67 and the upper band at $335.76. The H1 pivot resistance sits at $334.66, just above current price.
15-Minute Context: Near-Term Stability, No Immediate Urgency
The 15-minute chart shows Apple stock consolidating calmly within a healthy structure. No immediate breakout or breakdown signal is forming ahead of a potentially decisive catalyst.
The RSI reads 56.38 — neutral, with room to move in either direction. The MACD histogram is a modest positive 0.17, showing micro-momentum is holding. Price hugs the 15m pivot at $333.86, with a very tight ATR of 1.42. Volatility at this granularity is compressed. Overall, the 15m frame confirms an orderly consolidation rather than an imminent directional thrust.
The Fundamental Backdrop: HSBC, Berkshire, and a Looming Earnings Test
Apple stock’s technical strength is reinforced by significant institutional conviction. However, an upcoming earnings report and unresolved legal headwinds introduce genuine uncertainty into the outlook.
HSBC flagged what it called an “operational turning point” for Apple, upgrading the stock as AI momentum builds. Meanwhile, Berkshire Hathaway — now under Greg Abel — holds Apple and Alphabet as nearly 30% of its $348 billion stock portfolio. That is a high-conviction institutional signal.
At the same time, a broader AI-driven chip index has entered bear market territory. Apple stock has remained near all-time highs throughout that selloff. This relative strength suggests the market is differentiating Apple from pure semiconductor exposure and viewing its AI positioning as more defensible. In contrast, the stock faces real headwinds: an upcoming earnings report that could reset expectations in either direction, ongoing legal battles, and reported insider selling. These are legitimate uncertainty factors that the market hasn’t fully priced out.
Bullish Scenario: Earnings Confirm the Narrative
The bull case for Apple stock hinges on an earnings report that validates strong sales momentum and demonstrates commercial traction for the company’s AI approach.
If that validation arrives, the stock has a credible path toward and beyond the Bollinger upper band at $338.35. A sustained close above daily R1 at $336.15 would open room for the next leg higher. The daily MACD trend, combined with institutional conviction from HSBC and Berkshire, provides a meaningful tailwind for this scenario.
Bearish Scenario: Overbought Conditions Meet a Catalyst Disappointment
The bearish case centers on overbought daily RSI colliding with a negative earnings surprise — a combination that could trigger a swift correction in Apple stock.
At 71.65, RSI leaves little buffer for disappointment. A softer-than-expected report — or any escalation in legal uncertainty — could trigger a correction back toward the daily pivot at $332.58. Deeper support sits at S1 $330.16. A breach of that level would likely invite a test of the EMA20 at $311.64. That would represent a meaningful technical reset while still preserving the broader uptrend. Therefore, the bull case isn’t invalidated by a minor pullback. It would require a structural break below the rising EMA stack to change the dominant daily narrative.
Positioning Into Uncertainty
Apple stock enters this juncture with an unusually clean technical setup. Yet compressed upside distance to key resistance and an RSI that demands a positive catalyst make this a genuine decision zone.
The setup is bullish across daily, hourly, and 15-minute timeframes. Still, the hourly MACD softening adds modest short-term caution to what is otherwise a convincing trend. Volatility is measured but not dormant, with daily ATR of 8.26 capable of producing meaningful swings around a binary event like earnings. For traders, the area between $333 and $336 is where the next directional commitment will likely emerge. For longer-term participants, the trend remains intact until proven otherwise — but patience here is a position in itself.
FAQ
What is Apple stock’s current trend?
Apple stock is in a firmly bullish daily trend. AAPL closed at $333.74 on July 17, trading above the EMA20 ($311.64), EMA50 ($300.40), and EMA200 ($272.63) in a clean stacked configuration. The daily MACD shows expanding momentum with a line of 8.82 against a signal of 5.48 and a positive histogram of 3.34.
Is Apple stock overbought right now?
Yes, the daily RSI has reached 71.65, which is comfortably in overbought territory. While this does not terminate a trend, it signals that the probability of immediate upside continuation without a pause or consolidation has been compressed.
What are the key support and resistance levels for AAPL?
Key resistance sits at the daily R1 level of $336.15 and the Bollinger upper band at $338.35. Support levels include the daily pivot at $332.58, S1 at $330.16, and the EMA20 at $311.64, which would serve as a deeper technical reset point in the event of a disappointment.
What could move Apple stock next?
The upcoming earnings report is the decisive near-term catalyst. A strong report validating AI-driven sales momentum could propel Apple stock above $338.35. A disappointment, combined with already overbought RSI, could trigger a correction toward the $330–$332 range or deeper toward the EMA20 at $311.64.
Disclaimer: This article is for informational purposes only and does not constitute financial advice, an investment recommendation, or a solicitation to buy or sell any financial instrument or cryptocurrency. The analysis provided is not indicative of future results. Investing in crypto assets and financial markets carries a high risk of capital loss. Always do your own research (DYOR) and consult a qualified financial advisor before making any decision.
Article produced with the assistance of artificial intelligence and reviewed by the editorial team.
