



Ryanair stock faces mounting headwinds after a 34% drop in first-quarter profit collided with a deteriorating technical picture. The earnings miss and bearish chart structure make the near-term outlook difficult to defend, even if longer-term support has not yet broken.
Summary
Key takeaways
- Ryanair’s Q1 profit dropped 34% as consumers delayed bookings amid the Middle East crisis, with higher fuel costs compounding the damage.
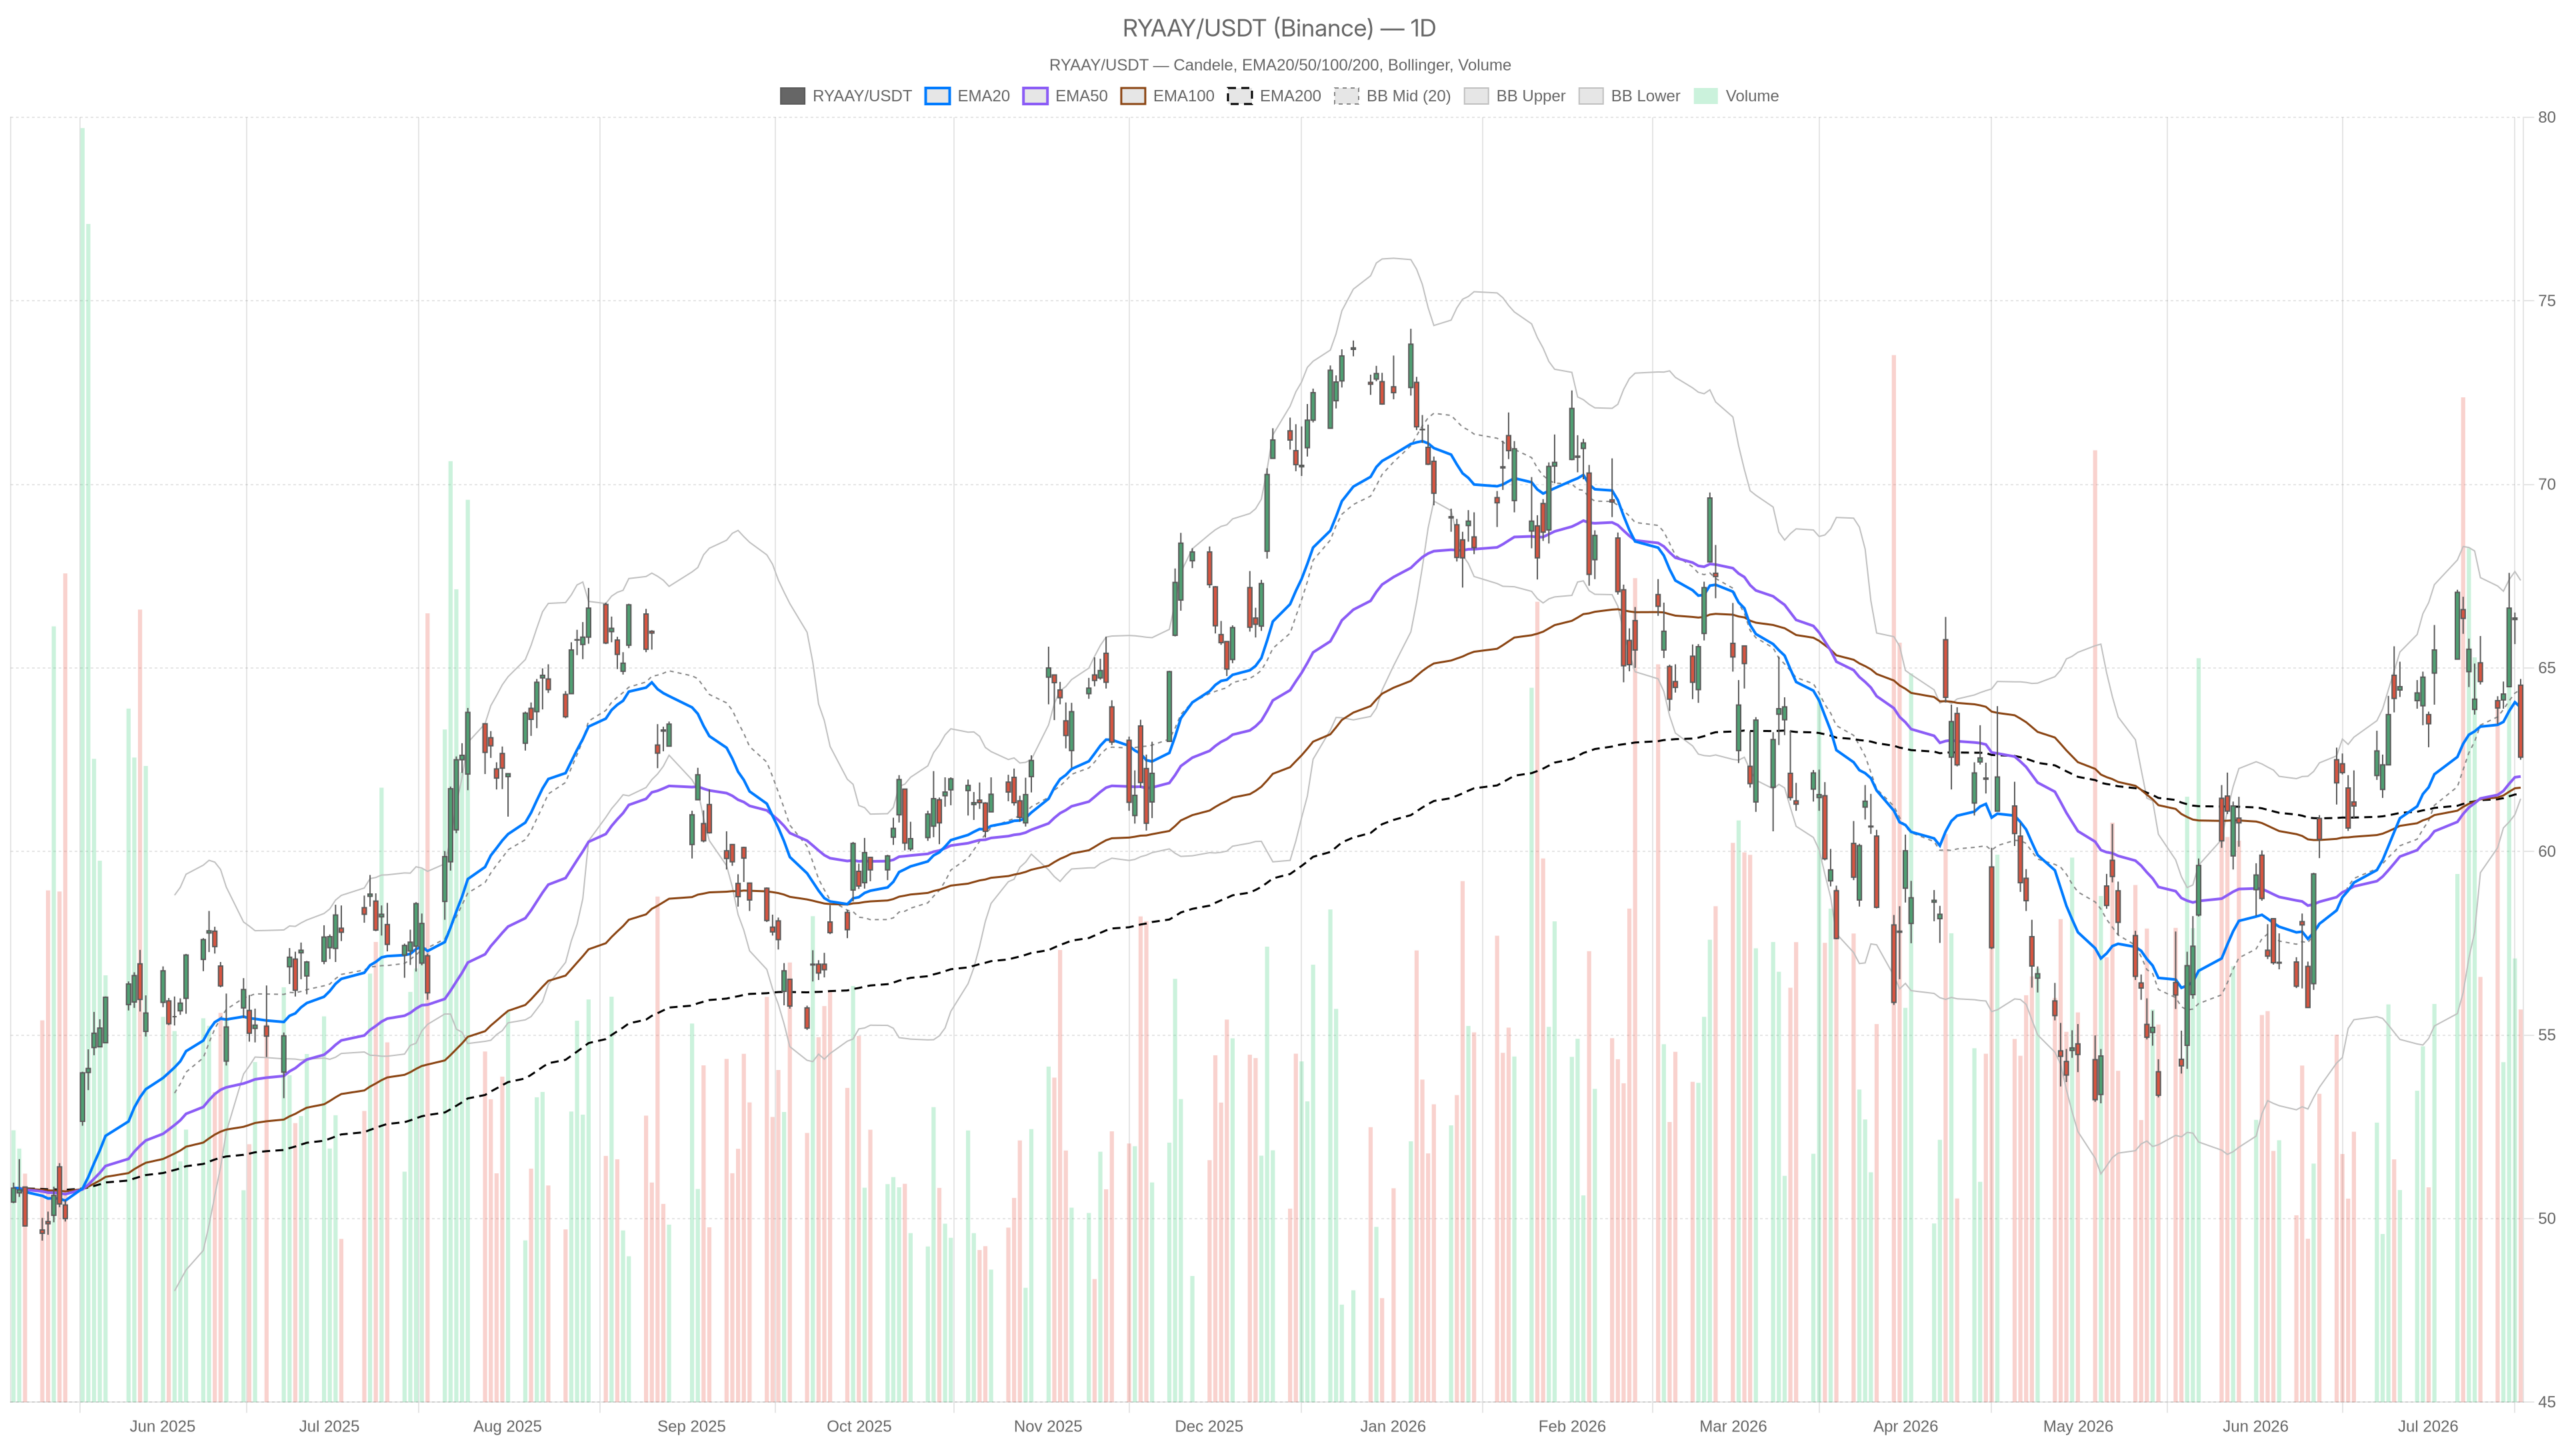
- RYAAY closed at 62.57 on July 17, below the daily EMA20 at 63.92, confirming the short-term trend has flipped to the downside.
- Daily RSI at 47.67 and a bearish MACD crossover signal weakening momentum on the daily chart.
- The EMA200 at 61.56 and Bollinger lower band at 61.44 form a critical structural support zone for Ryanair stock.
- A sustained break below 61.44–61.56 would mark a technical breakdown and likely attract further institutional selling.
Earnings Shock and the Iran War Premium
Ryanair’s Q1 profit fell 34% as Middle East tensions drove consumers to delay bookings. Higher fuel costs compounded the damage. CNBC reported the stock slid 6% on the news. Management flagged a “difficult winter” ahead for struggling airlines, signaling the pressure extends well beyond a single quarter.
Meanwhile, Bernstein reiterated its rating on Ryanair stock earlier in July, citing cost control strength. That view, however, was formed before the Q1 figures landed. The cost discipline Bernstein praised now contends with fuel cost inflation linked by management to geopolitical risk. On balance, the earnings report dominates the fundamental picture.
Ryanair Stock Daily Chart: A Neutral Regime Concealing Real Damage
The daily chart for Ryanair stock shows a neutral regime classification. However, the internal structure reveals significant bearish damage beneath the surface. On July 17, RYAAY closed at 62.57 after opening at 64.53, with an intraday high of 64.70. That session left a clear upper shadow and a closing print near the low of the day — a significant bearish signal.
Moving Averages Signal a Short-Term Downtrend
Turning to the moving averages, the EMA20 sits at 63.92, the EMA50 at 62.04, and the EMA200 at 61.56. Price is currently below the EMA20, meaning the short-term trend has already flipped to the downside. Notably, the EMA50 and EMA200 remain below current price, offering potential support. However, that cushion is thin given the proximity.
Still, the daily RSI at 47.67 confirms the neutral read — neither oversold nor under accumulation pressure. Its position below the 50 midline leans slightly bearish.
Momentum and Volatility Indicators Flash Warning
On the momentum front, the MACD histogram has turned negative at -0.29, with the MACD line at 1.19 crossing below the signal line at 1.48. That crossover is a momentum warning. It is not yet a confirmed downtrend, but directionally it points lower.
In terms of volatility, Bollinger Bands show a midline at 64.41, with price now trading below it at 62.57. The lower band sits at 61.44 — close to where the EMA200 at 61.56 also clusters. That zone around 61.44–61.56 becomes a critical structural floor. A break below it would force a reassessment of the entire medium-term thesis. The daily ATR of 1.80 indicates meaningful volatility, consistent with the 6% post-earnings gap risk.
Meanwhile, daily pivot analysis places the pivot point at 63.26, with R1 at 64.01 and S1 at 61.81. Price is already below the PP, reinforcing the near-term bearish lean.
Hourly Structure Confirms the Selling Pressure
The hourly chart confirms active selling pressure across Ryanair stock. All key moving averages are stacked bearishly above current price. At the close of the last hourly bar at 62.53, price sits well below the 1H EMA20 at 64.67 and the EMA50 at 64.95. It hovers just above the EMA200 at 63.10. All three EMAs are stacked in bearish order, confirming the short-term trend is firmly to the downside.
Notably, the 1H RSI at 28.21 is approaching oversold territory. That number warrants attention. A reading below 30 typically signals exhaustion in a selling wave — not necessarily a reversal, but a potential pause. Therefore, a short-term bounce from current levels cannot be ruled out, particularly near the 1H S1 pivot at 62.24.
The 1H MACD line at -0.56, against a signal of -0.16, reflects strong downside momentum. The histogram at -0.41 confirms active selling, not mere drift. Meanwhile, the Bollinger Band lower boundary on the 1H sits at 62.48 — almost exactly where price is trading. That compression near the lower band often precedes a technical bounce. In trending moves, however, it can also mark the start of a band-walk lower.
15-Minute Execution Context: Deeply Oversold, But Momentum Still Negative
On the 15-minute chart, Ryanair stock shows deeply oversold conditions with an RSI at 22.24. Price closed at 62.53, below all short-term moving averages. The 15m regime is explicitly classified as bearish. The MACD histogram at -0.02 is nearly flat, suggesting the short-term selling impulse is decelerating. However, decelerating momentum is not the same as reversal.
Therefore, for execution purposes, the 15m picture suggests that aggressive new short positions carry meaningful rebound risk from current levels. A technical relief rally is statistically more likely than not after a multi-timeframe RSI collapse like this. The 15m pivot R1 at 62.91 and the 1H PP at 62.79 mark the first meaningful resistance zone for any bounce attempt.
The Bullish Scenario: What Would Need to Change
A credible bullish case for Ryanair stock requires price to reclaim the daily EMA20 at 63.92 on a closing basis. That alone would neutralize the short-term bearish signal. Additionally, the daily MACD histogram would need to stop widening and begin recovering toward zero — a sign that the momentum deterioration is stabilising. The geopolitical risk premium embedded in fuel costs would also need to ease. Alternatively, Ryanair would need to demonstrate successful hedging at the next reporting event.
Notably, the EMA50 at 62.04 and the EMA200 at 61.56 form a meaningful demand cluster just below current price. If buyers defend that zone aggressively, the longer-term bullish structure — built on years of cost leadership and European travel demand — could reassert itself. Bernstein’s continued constructive stance on cost control remains a supporting data point for that thesis.
The Bearish Scenario: How the Case Strengthens
The bearish scenario for Ryanair stock has stronger immediate momentum behind it. A daily close below 61.81 — the S1 pivot — would place price dangerously close to the Bollinger lower band at 61.44 and the EMA200 at 61.56. A sustained breach of that cluster would mark a genuine technical breakdown and likely attract further institutional selling.
In contrast to the Bernstein view, the earnings picture now points to structural margin compression. A difficult winter, as management flagged, means the next catalyst is more likely to disappoint than surprise. If fuel costs remain elevated and the Middle East crisis persists, the fundamental case for recovery becomes harder to sustain through 2026.
Positioning and Volatility Outlook
Ryanair stock sits in a precarious position. The daily bias leans bearish despite the neutral regime classification. At the same time, the hourly chart confirms the pressure and the 15m shows extreme oversold readings. These warrant tactical caution against chasing shorts at current levels.
Overall, a short-term technical bounce toward 62.79–63.07 is plausible. However, unless price reclaims the daily EMA20 with conviction, that bounce is most likely to be sold into. With an ATR of 1.80 on the daily and geopolitical uncertainty still unresolved, volatility remains elevated. Traders and investors should size positions accordingly. Any relief rally should be treated as a stress test for the broader thesis rather than a clean reversal signal.
FAQ
What caused Ryanair stock to drop?
Ryanair’s Q1 profit fell 34% as Middle East tensions caused consumers to delay bookings. Higher fuel costs compounded the damage, and the stock slid 6% on the news. Management also flagged a “difficult winter” ahead, signaling the pressure extends beyond a single quarter.
What are the key support levels for Ryanair stock?
The critical support zone for Ryanair stock lies between 61.44, the Bollinger lower band, and 61.56, where the daily EMA200 sits. A sustained break below this zone would signal a technical breakdown and likely attract further institutional selling.
Is Ryanair stock oversold right now?
On the 15-minute chart, the RSI has dropped to 22.24, indicating deeply oversold conditions for Ryanair stock. The 1H RSI at 28.21 is also approaching oversold territory. These readings suggest a short-term technical bounce is plausible, though they do not guarantee a reversal.
What would need to happen for Ryanair stock to turn bullish?
Price would need to reclaim the daily EMA20 at 63.92 on a closing basis to neutralize the short-term bearish signal. The MACD histogram must begin recovering toward zero, indicating stabilising momentum. Additionally, geopolitical risks affecting fuel costs would need to ease materially.
Disclaimer: This article is for informational purposes only and does not constitute financial advice, an investment recommendation, or a solicitation to buy or sell any financial instrument or cryptocurrency. The analysis provided is not indicative of future results. Investing in crypto assets and financial markets carries a high risk of capital loss. Always do your own research (DYOR) and consult a qualified financial advisor before making any decision.
Article produced with the assistance of artificial intelligence and reviewed by the editorial team.
