




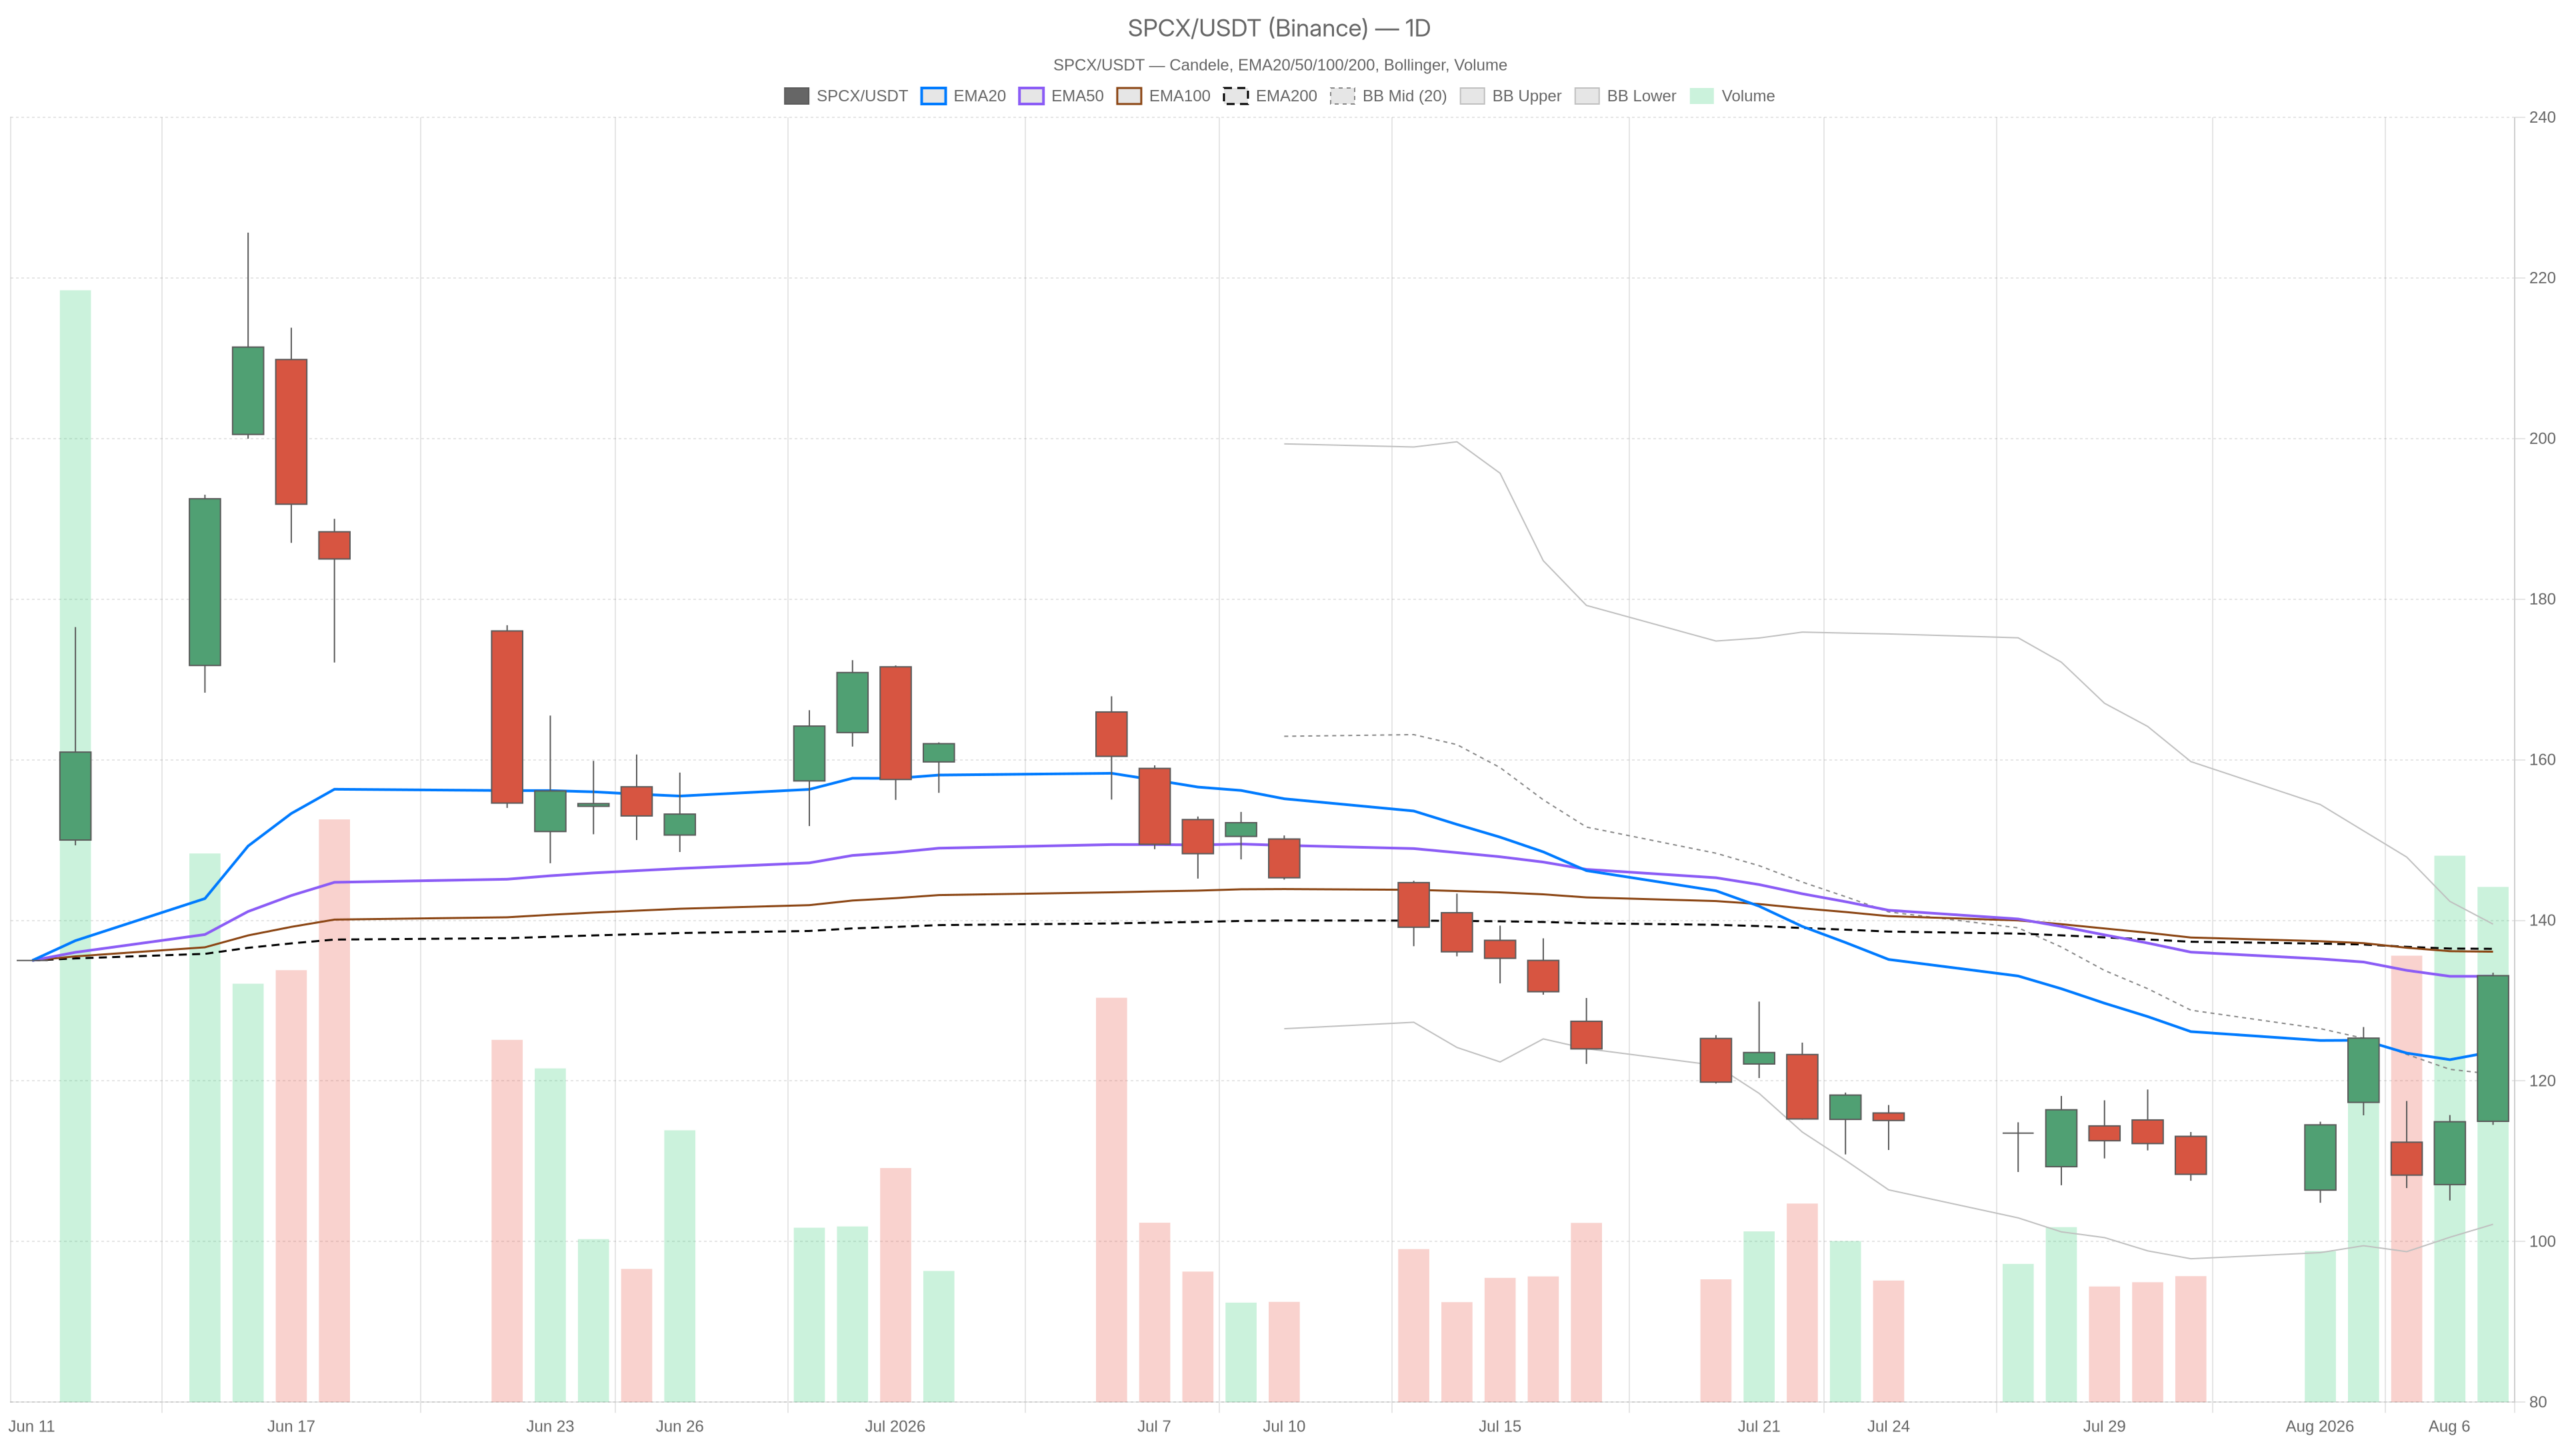
SpaceX Stock surged Friday, August 7, from an open of 114.97 to a close of 133.11 — a full-range engulfing candle on 240.6 million shares. Yet the broader daily structure remains unresolved. That tension defines the current setup.
Summary
Key takeaways
- SpaceX Stock (SPCX) jumped 15.8% on Friday despite a lockup expiration releasing over 900 million shares
- The 200-day EMA at 136.45 remains the defining resistance for any trend reversal
- Daily RSI sits at 54.77 with MACD histogram turning positive at 1.82
- The decisive structural zone lies between 136.45 and 139.55
- Short-term RSI readings on the 1H and 15m charts warn of overbought conditions
What the Daily Chart Says About SpaceX Stock
The daily chart signals a neutral structure with a short-term bullish tilt. Price has reclaimed the 20-day EMA but remains trapped below the 200-day EMA at 136.45 — the true gatekeeper for any trend reversal.
EMA Alignment Still Points Lower
For now, the EMA stack remains bearish. The 20-period average at 123.65 sits below the 50-period at 133.03, and both sit beneath the 200-period at 136.45. Price has simply risen into the top of this compressed cluster. That pattern is typical of a bottoming attempt, not an established uptrend.
Momentum Improves Without Confirming a Turn
The daily RSI at 54.77 has barely crossed the midline after a deeply oversold stretch. There is ample room before overbought conditions become a concern. Meanwhile, the MACD line at -6.79 remains below zero but has crossed above its signal at -8.61. That leaves a positive histogram of 1.82, signaling exhausted downside momentum and short-term buyer control.
Volatility and Pivots Frame the Decisive Zone
At the same time, the daily ATR at 10.22 is enormous relative to a 133 handle. Bollinger Bands show the mid at 120.84, the upper at 139.52, and the lower at 102.15. Friday’s close pushed into the upper half of that envelope but stopped short of the band itself. The move has not yet reached statistical exhaustion on the daily scale.
On the pivot front, the daily pivot stands at 127.04, with R1 at 139.55 and S1 at 120.60. Notably, R1 and the upper Bollinger band converge just above the 200-day EMA. That cluster between roughly 136.45 and 139.55 is the decisive zone for the entire structure.
The 1H Chart Confirms Strength but Flags Stretch
The hourly chart confirms the short-term uptrend while flagging overbought conditions. Price holds above all three hourly EMAs, but the 1H RSI at 72.44 warns the move is running hot.
Price at 133.10 trades above the 1H 20-EMA at 121.41, the 50-EMA at 117.91, and the 200-EMA at 129.30. The hourly MACD is positive, with the line at 4.40 over a 2.40 signal and a histogram of 2.00. Short-term trend and momentum are both aligned to the upside.
However, the hourly RSI at 72.44 is firmly overbought. The upper hourly Bollinger band sits at 135.33, only marginally above spot. Hourly ATR of 4.48 shows how fast this instrument is moving intraday. The 1H chart confirms the daily improvement. Still, the move needs either consolidation or a shallow pullback to reset.
Hourly pivots are tight: pivot 132.30, R1 134.25, S1 131.15. Those levels are the immediate battleground. Holding above 132.30 keeps the intraday bid intact.
15m Execution Context
The 15-minute chart shows a bullish EMA alignment but reveals early momentum decay. RSI at 79.06 and a slightly negative MACD histogram suggest the immediate impulse is tiring.
On the 15-minute chart, the regime reads bullish, with EMAs stacked in textbook order: 128.14 over 122.84 over 116.73. However, this is where the first cracks show. RSI at 79.06 is extreme, and price at 133.10 is trading above the upper band at 132.24. The MACD histogram has flipped slightly negative at -0.19 despite a positive line. That is early evidence of momentum decay into the close.
For execution, 15m ATR of 1.26 defines normal noise. The 15m pivot at 132.46 and S1 at 131.47 mark the levels where short-term buyers must defend. Chasing strength into an RSI near 79 rarely offers good entry geometry.
Bullish Scenario
The bullish scenario requires holding the pivot shelf and clearing the 200-day EMA at 136.45. A decisive daily close above the 136.45–139.55 zone would flip the structure from recovery to confirmed trend change.
In practice, the bullish case is straightforward. SpaceX Stock must hold above the 132.30–132.46 pivot shelf. It then needs to clear hourly R1 at 134.25 and the 1H upper band at 135.33. From there, the real test is the 200-day EMA at 136.45. Next comes the confluence of daily R1 at 139.55 and the upper daily Bollinger band at 139.52.
A decisive daily close above that zone would flip the structure from recovery to trend change. The MACD histogram turning positive on the daily, combined with an RSI still only in the mid-50s, gives the move room to extend. The news backdrop fits: the stock climbed 15.8% on Friday despite a lockup expiration that released over 900 million shares on Thursday. Absorbing that supply without breaking is a genuine sign of demand.
Bearish Scenario
The bearish case hinges on a rejection at the 134–136 resistance zone with short-term indicators already overbought. A failed breakout here would expose a drop back toward the daily mid at 120.84.
On the other hand, the bearish case remains alive and cheap to argue. The 200-day EMA at 136.45 is still overhead, and the daily MACD line is deeply negative. A rejection at 134–136 with the 15m and 1H RSI already stretched would be a classic failed breakout.
The first crack would be a loss of hourly S1 at 131.15, followed by a slip back under the 1H 200-EMA at 129.30. Below that, daily S1 at 120.60 and the daily Bollinger mid at 120.84 become the reference zone. The 20-day EMA at 123.65 serves as an intermediate cushion. Losing the daily mid would invalidate the bullish thesis entirely and reopen the lower band near 102.15.
Fundamental commentary reinforces the two-sided risk. Jim Cramer has publicly argued for accumulating the name for the long term despite its capital requirements. Meanwhile, a Seeking Alpha piece labels it a sell on valuation grounds, citing declining ARPU and limited scale. With the stock still down 34% from its post-IPO peak, positioning is clearly contested.
Closing Read
This is a market in transition, not one with a settled trend. Conflicting signals across timeframes point to a wide, high-energy range with genuine two-way uncertainty until the 136.45–139.55 resistance zone is resolved.
Overall, the daily chart says neutral and improving, the hourly says bullish but overextended, and the 15-minute chart says the immediate impulse is tiring. That combination usually resolves through a pullback that either finds buyers or exposes the rally as mechanical.
Volatility is the main risk to manage. A daily ATR above 10 means position sizing matters more than direction here. Until the 136.45–139.55 band is cleared or the 129.30 level fails, the honest read on SpaceX Stock is a wide, high-energy range. Genuine two-way uncertainty defines this moment.
FAQ
Is SpaceX Stock a buy at current levels?
The daily chart shows improvement but has not confirmed a trend reversal. The 200-day EMA at 136.45 remains overhead resistance, and short-term RSI readings on the 1H and 15m charts are overbought. Traders may prefer to wait for either a pullback to support or a confirmed close above 139.55.
What is the key resistance level for SpaceX Stock?
The decisive zone lies between the 200-day EMA at 136.45 and the confluence of daily R1 at 139.55 with the upper Bollinger band at 139.52. A close above this band would confirm a structural trend change.
Why did SpaceX Stock surge 15.8% on Friday?
The stock rallied despite a lockup expiration that released over 900 million shares on Thursday. Absorbing that supply without breaking signals genuine demand. The daily MACD histogram also turned positive at 1.82, confirming exhausted downside momentum.
What are the downside risks for SpaceX Stock?
A rejection at the 134–136 zone with overbought short-term RSI could trigger a failed breakout. Key support sits at hourly S1 of 131.15, then the 1H 200-EMA at 129.30. Below that, the daily mid at 120.84 becomes the reference. Losing that level would reopen the lower Bollinger band near 102.15.
Disclaimer: This article is for informational purposes only and does not constitute financial advice, an investment recommendation, or a solicitation to buy or sell any financial instrument or cryptocurrency. The analysis provided is not indicative of future results. Investing in crypto assets and financial markets carries a high risk of capital loss. Always do your own research (DYOR) and consult a qualified financial advisor before making any decision.
Article produced with the assistance of artificial intelligence and reviewed by the editorial team.
