



Ryanair stock is testing resistance near the low‑60s as momentum turns higher. RYAAY has reclaimed short‑term trend markers but remains capped by the 200‑day average, keeping a neutral stance with an upside tilt amid robust full‑year earnings and a seasonal Q4 loss that tempers enthusiasm near resistance.
Summary
Daily technical view: Ryanair stock near the 200‑day EMA
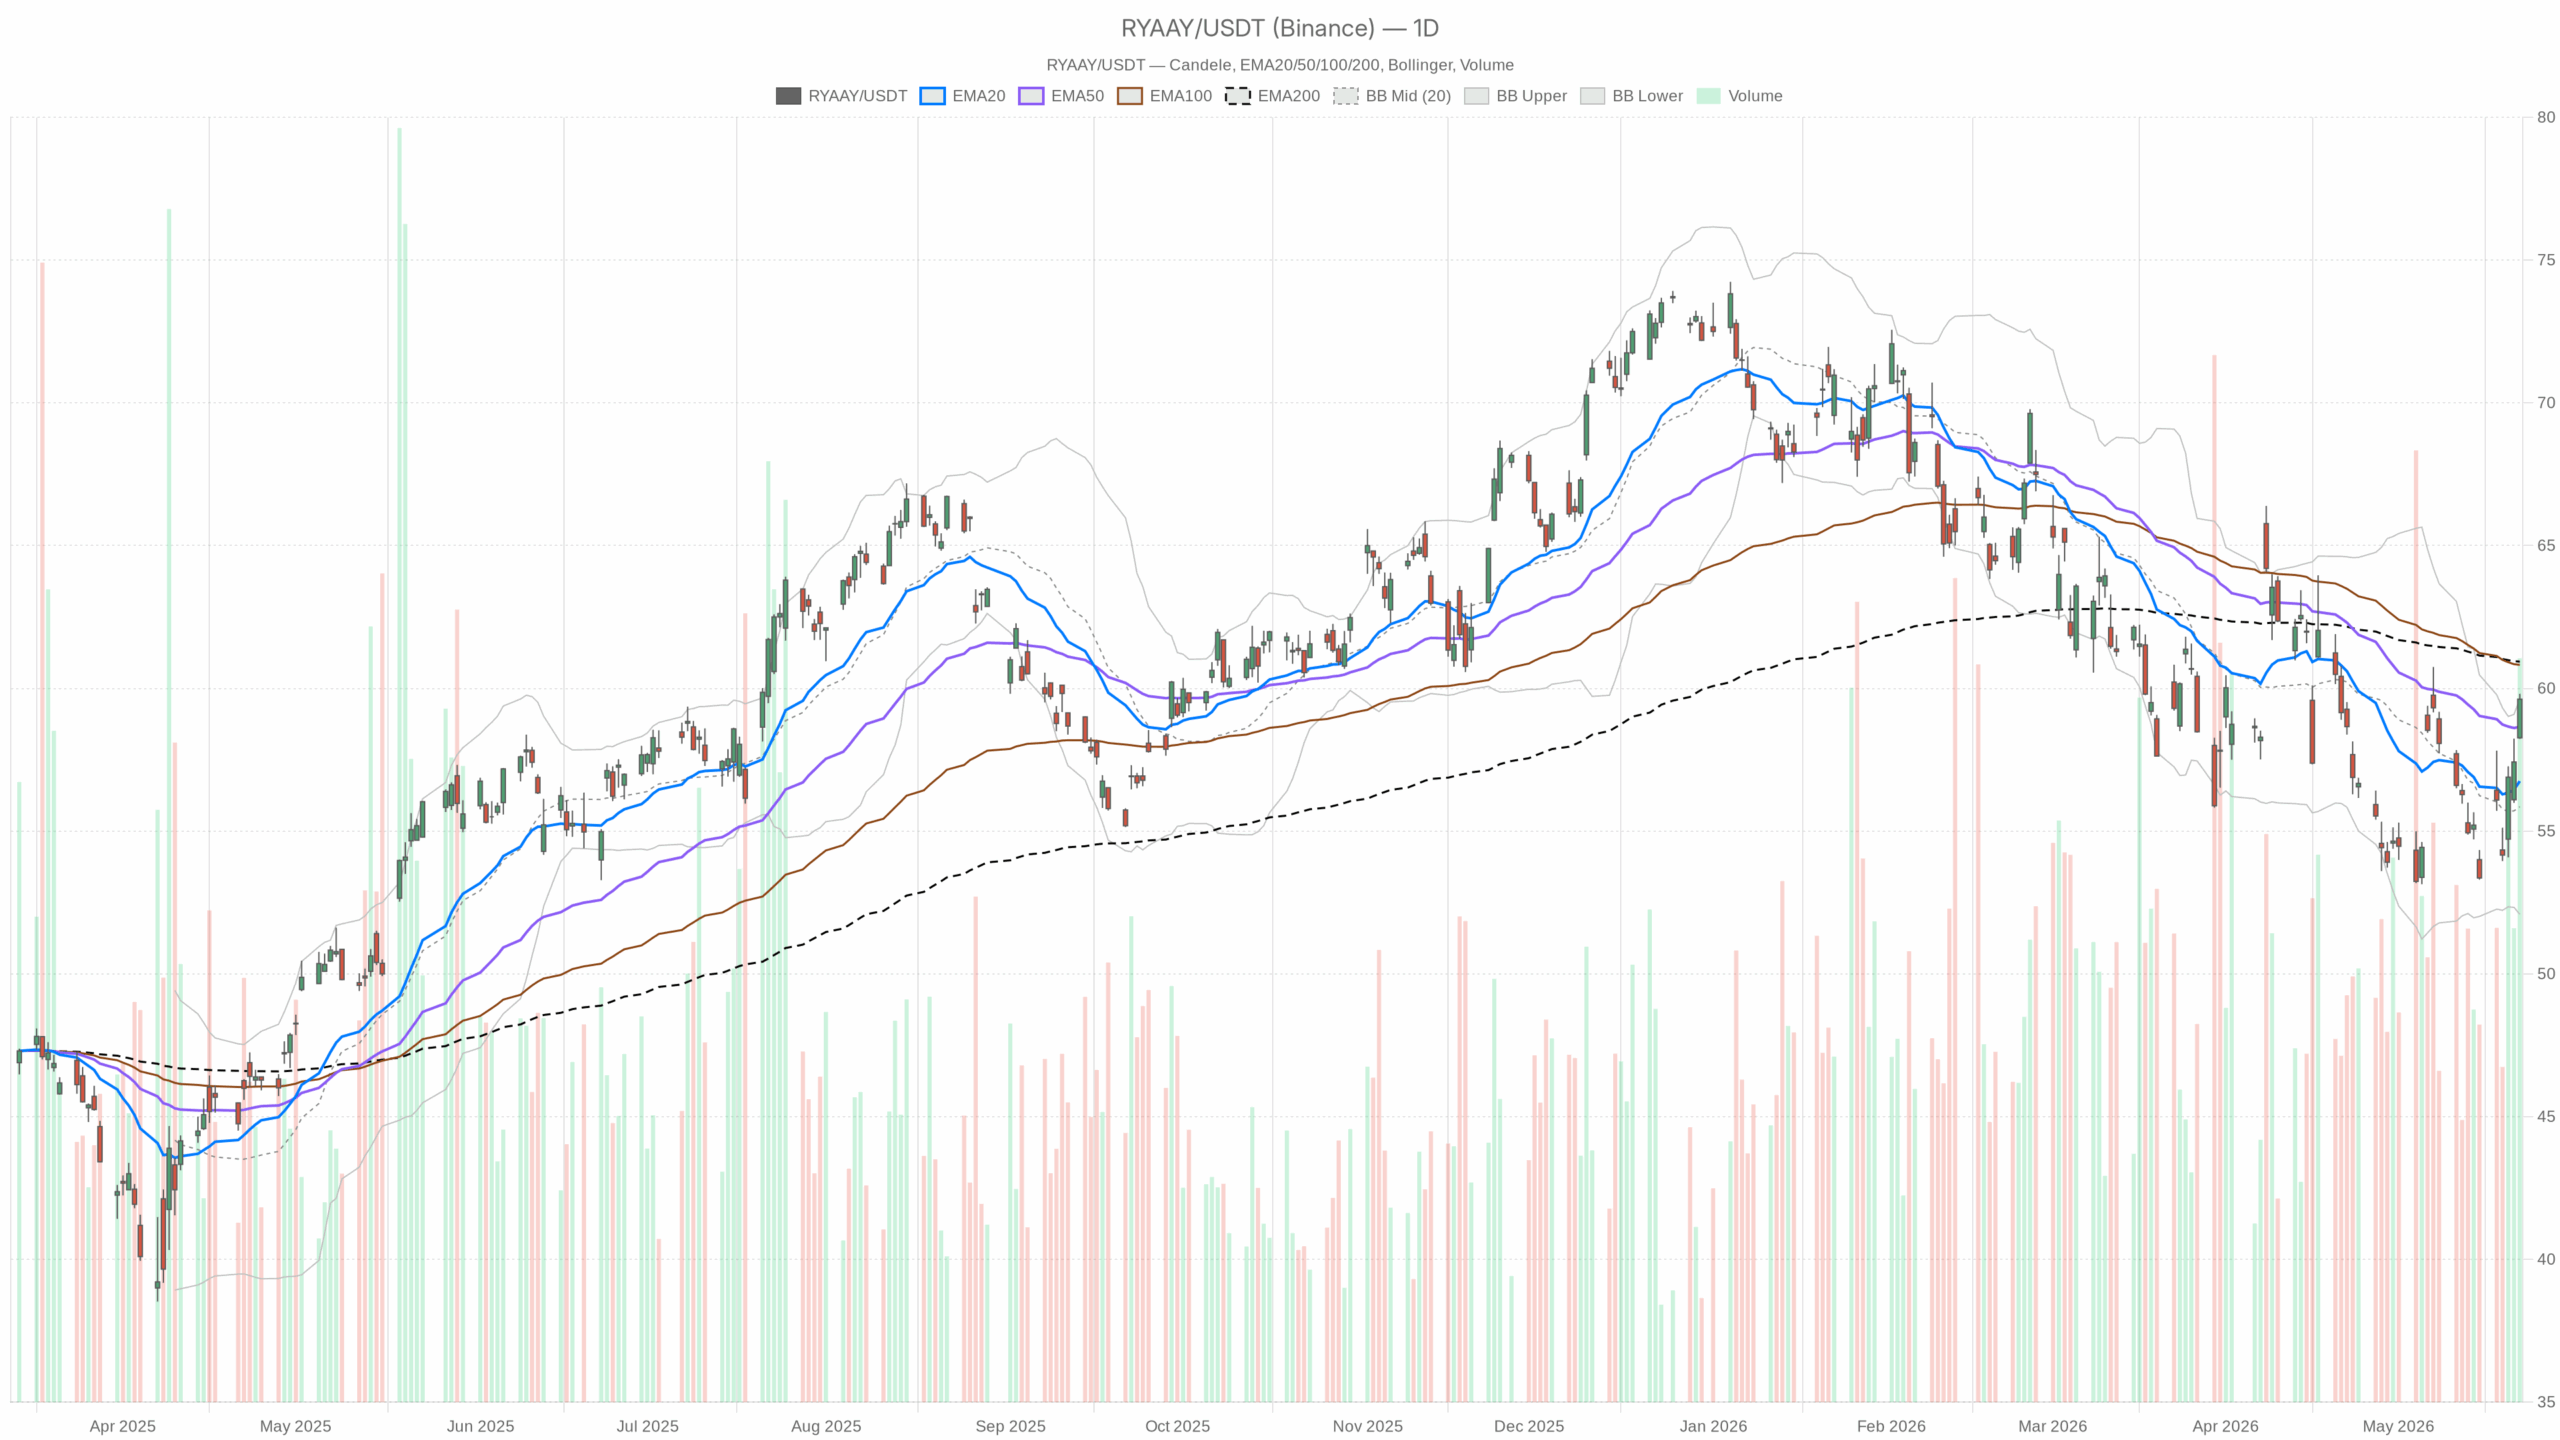
On the daily timeframe, RYAAY closed at 59.62, above the 20‑day EMA at 56.75 and the 50‑day EMA at 58.65. The 200‑day EMA at 60.94 still lingers overhead. Short‑term trend is improving, while the longer‑term ceiling remains intact.
Notably, daily RSI14 56.37 shows positive momentum without being stretched. The daily MACD prints line −0.45 versus signal −0.95 with a +0.50 histogram, a bullish inflection as momentum turns up.
Meanwhile, Bollinger Bands place the upper band at 59.63 with price kissing it, signaling strength near resistance. ATR14 2.23 points to moderate volatility. Therefore, holding above the daily pivot at 59.22 tilts risk toward a test of R1 60.21, while S1 58.63 marks initial support.
Hourly chart: short‑term trend firm, resistance close
On the hourly chart, price at 59.60 sits above the 20/50/200‑hour EMAs at 58.02, 56.91, and 57.12. The short‑term trend is firmly up. However, RSI14 70.23 is overbought, flagging near‑term pause risk.
Momentum remains constructive, with the hourly MACD positive and a small +0.19 histogram. Meanwhile, the upper Bollinger band near 60.22 sits just ahead, underscoring nearby resistance. Intraday volatility is contained, with ATR14 0.58. Finally, the hourly pivot at 59.63 has price fractionally below, showing minor hesitation at a key level.
15‑minute execution context
For execution, EMAs are positively stacked (20 > 50 > 200) with price near 59.60, keeping the tactical uptrend intact. Still, RSI14 64.84 is bullish without being extreme.
Meanwhile, the MACD histogram has slipped to −0.07, signaling momentum cooling on the very short term. Price trades between the Bollinger mid at 59.43 and the upper band at 59.94, a range consolidation near the top. At the same time, ATR14 0.21 shows tight micro volatility. The 15‑minute pivot is 59.67 with S1 59.53 close by.
Fundamental backdrop for Ryanair stock
Fundamentally, Ryanair reported a record full‑year 2026 PAT of €2.26 billion, up 40% year over year, a clear profitability tailwind.
At the same time, the company posted a Q4 loss but beat revenue estimates and is guiding for 216 million passengers in fiscal 2027. This demand resilience offsets seasonal softness. These headlines help explain why momentum is improving as price approaches resistance, with dips in Ryanair stock met by buyers.
Bullish scenario: what confirms an upside break
Therefore, the bullish pathway hinges on clearing nearby ceilings. A sustained daily close above R1 60.21 and, more importantly, the 200‑day EMA at 60.94 would open 61+ as the next zone. On that path, daily RSI holding above 50 and a positive MACD histogram would underpin a band‑walk along the upper Bollinger. Hourly RSI easing from 70 without price damage would further validate the move.
Bearish scenario: where the upside tilt fails
In contrast, the bearish case gains traction if the stock fails at the 60 handle and slips below the daily pivot at 59.22. A drop through S1 58.63 and the 50‑day EMA at 58.65 would likely invite a deeper mean reversion toward the 20‑day EMA at 56.75. On lower timeframes, an hourly RSI break below 50 with a rolling MACD histogram to negative and a retreat from the upper Bollinger band would invalidate the upside tilt.
Bottom line on Ryanair stock
Overall, Ryanair stock sits in a transition phase: constructive but not yet trending higher on the longer timeframe. Volatility is moderate on the daily and contained intraday, which favors orderly tests of nearby levels rather than disorderly swings. Until the 200‑day is reclaimed or the 50‑day is lost, positioning likely stays balanced with a mild bullish bias and event‑driven uncertainty.
