



Ryanair Holdings plc stock faces a precarious moment. RYAAY reversed sharply from a $64.70 intraday high on July 17, closing at $62.57 near session lows. The daily regime is neutral, but weakening momentum and a bearish MACD cross tell a more cautious story.
Summary
Key takeaways
- RYAAY closed at $62.57 on July 17, reversing sharply from a $64.70 intraday high and settling near session lows.
- The daily MACD has registered a bearish cross, with the MACD line at 1.19 falling below the signal line at 1.48.
- Hourly RSI has collapsed to 28.21, placing RYAAY in oversold territory on the intraday frame.
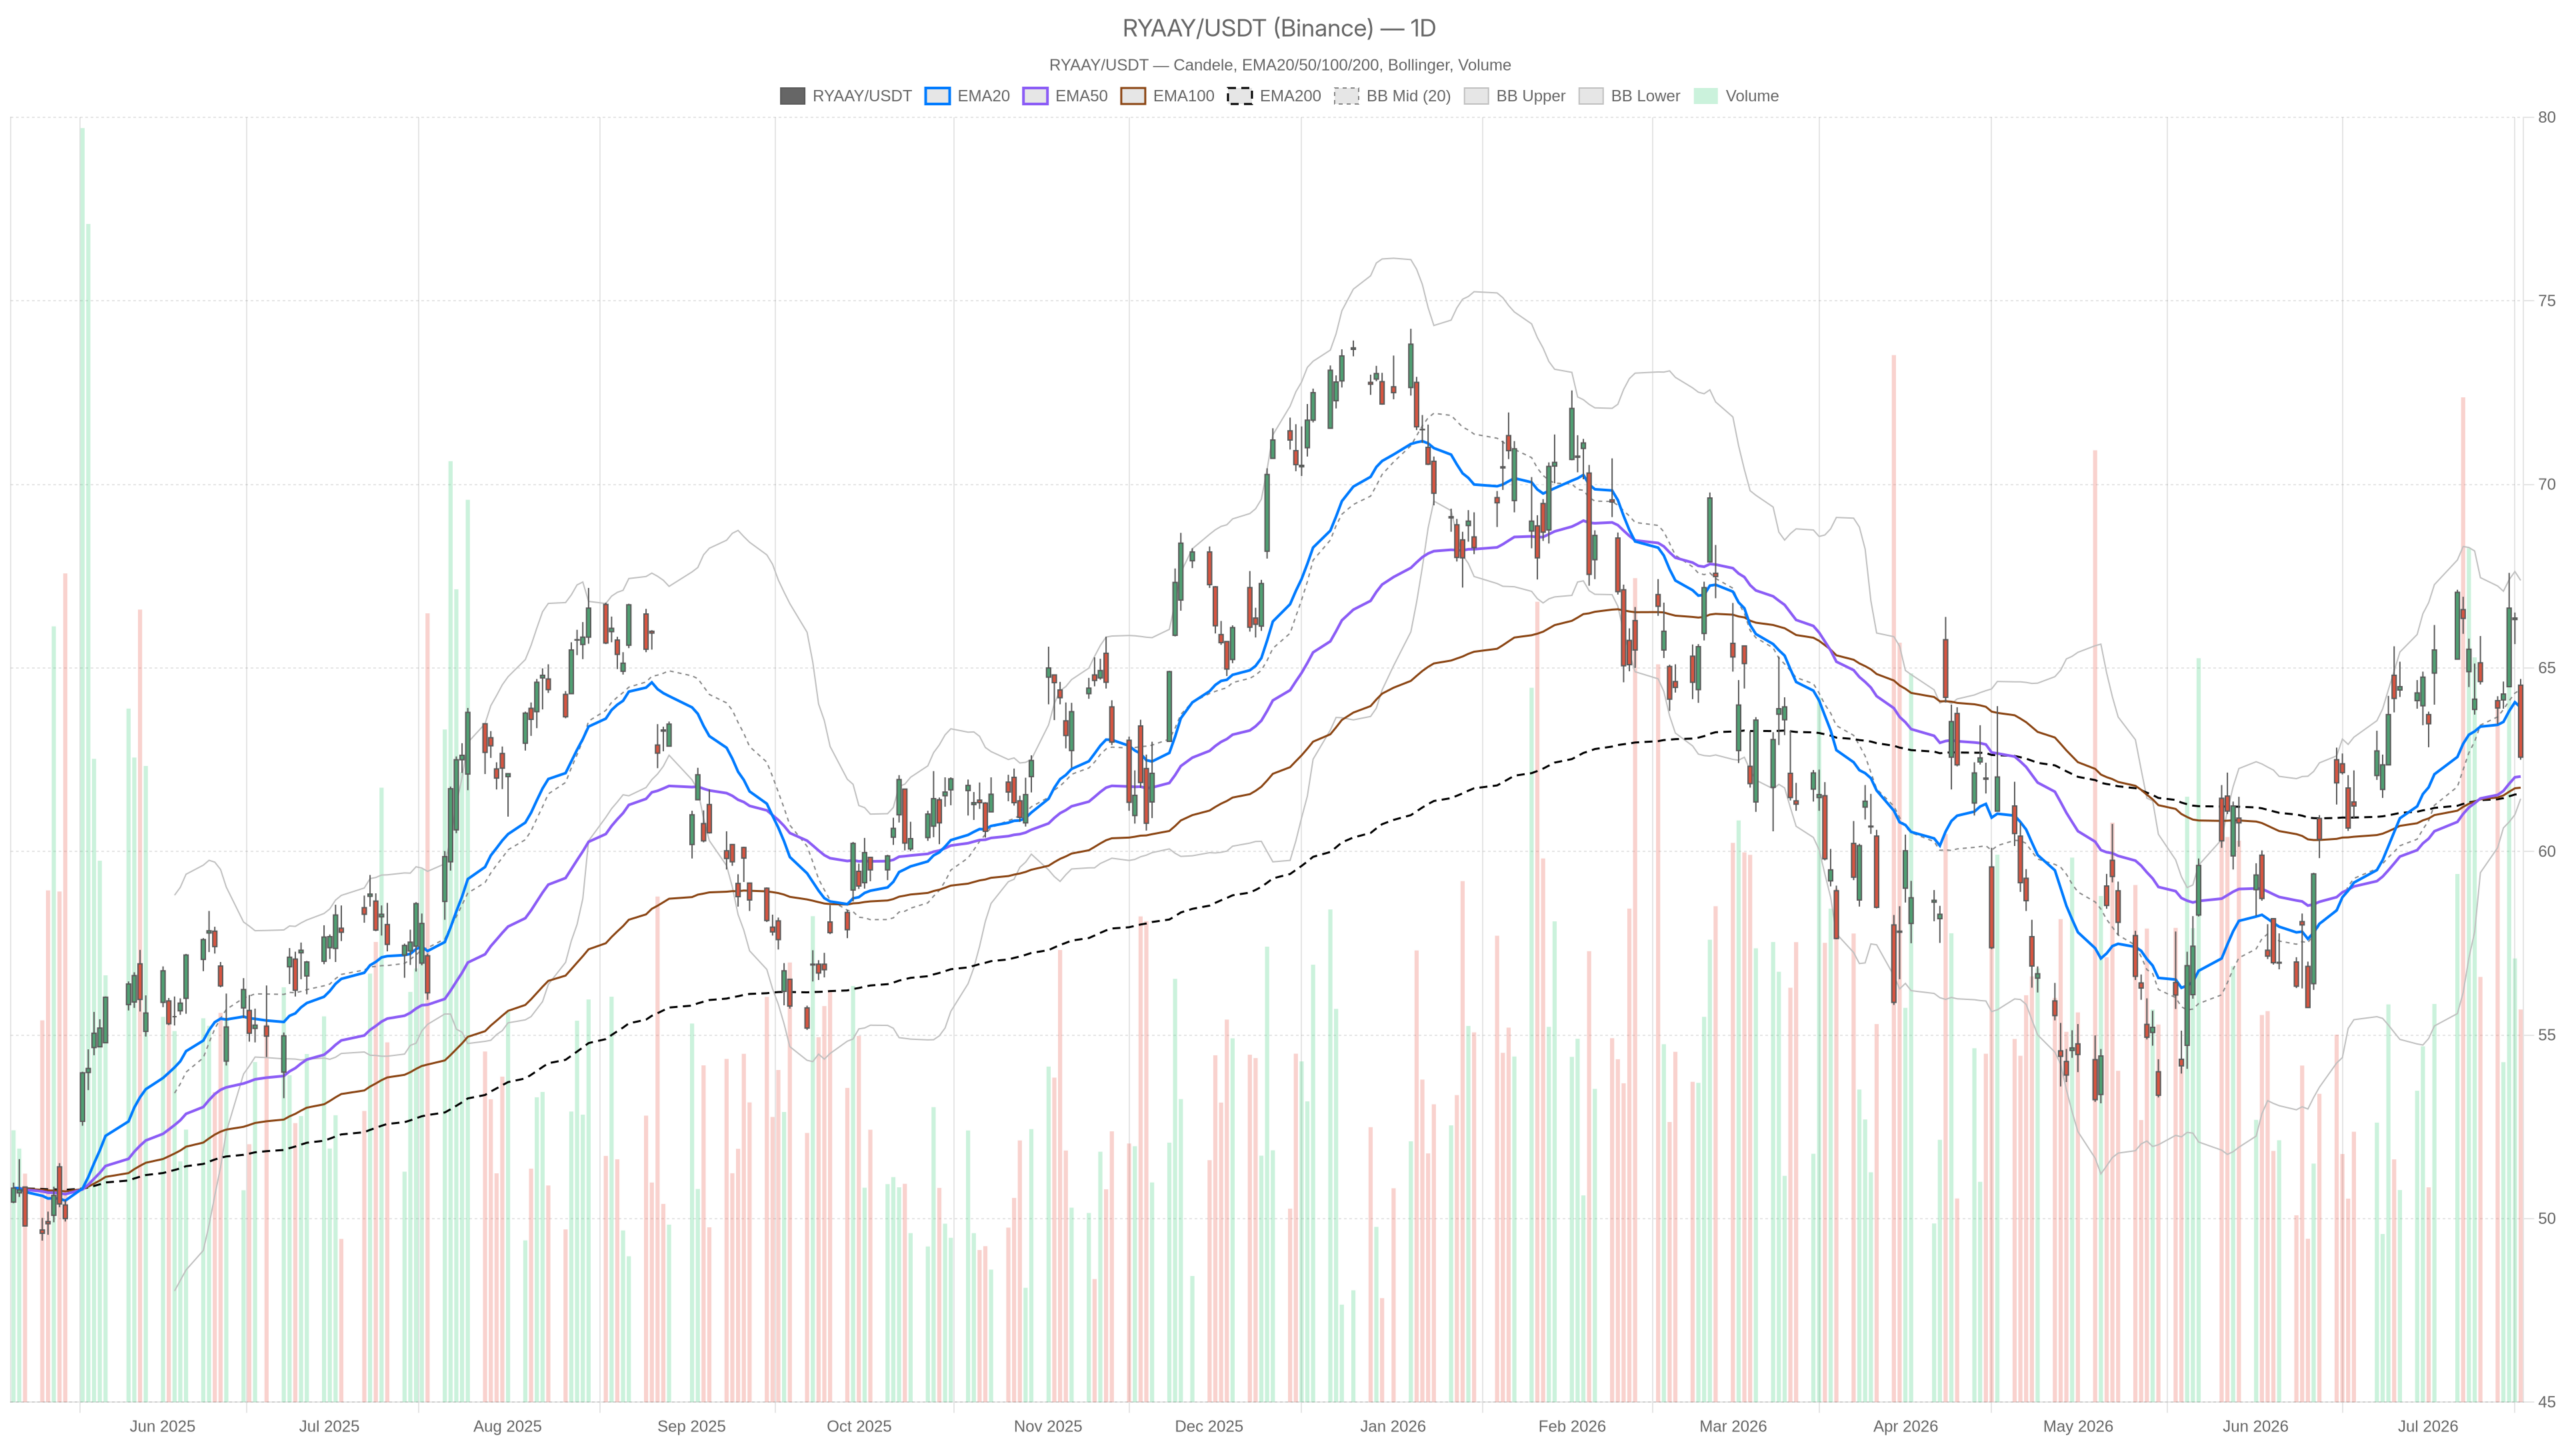
- Long-term structural support sits between $61.56 (EMA200) and $62.04 (EMA50) on the daily chart.
- A sustained reclaim of the daily EMA20 at $63.92 is the minimum requirement for bulls to regain meaningful control.
Ryanair Holdings plc Stock Daily Bias: Neutral With a Bearish Lean
The daily outlook for Ryanair Holdings plc stock is neutral with a bearish lean. RYAAY at $62.57 sits below the EMA20 at $63.92. However, it still holds above the EMA50 at $62.04 and the EMA200 at $61.56.
However, the inability to hold above the EMA20 after the intraday high signals that bulls lack conviction to extend the recent recovery. The long-term trend structure remains intact, but near-term momentum is clearly deteriorating.
Momentum Indicators Flash Caution
The daily MACD reinforces this concern. The MACD line at 1.19 sits below the signal line at 1.48, producing a negative histogram of -0.29. A bearish cross is already in effect. Meanwhile, the daily RSI at 47.67 drifts toward neutral territory, pointing lower and well off any overbought extreme. Neither reading is catastrophic, but together they confirm fading upside momentum.
Bollinger Bands and Pivot Levels
Bollinger Band context adds further nuance. The daily midband sits at $64.41, with the lower band at $61.44. Price has broken below the midband and now drifts toward the lower half of the channel. At the same time, daily ATR stands at $1.80 — a wide enough range to make false moves costly.
Meanwhile, the daily pivot at $63.26 already sits above the current close. RYAAY therefore ended the session technically below its own pivot point. R1 resistance stands at $64.01, while S1 support at $61.81 marks the next level to watch on the downside.
Hourly Timeframe: RYAAY Weakens Further
The 1H chart shows a clear short-term bearish alignment. RYAAY at $62.53 trades below every key EMA on this timeframe. The EMA20 stands at $64.67, the EMA50 at $64.95, and the EMA200 at $63.10.
RSI in Oversold Territory
More strikingly, the 1H RSI has collapsed to 28.21, placing the stock in oversold territory on an hourly basis. However, oversold alone is not a buy signal. In a trending selloff, RSI can remain depressed for extended periods. What matters is whether a reversal confirmation emerges — and at this stage, none has.
MACD Confirms Unfinished Selling Pressure
The hourly MACD paints a similarly grim picture. The MACD line at -0.56 has pushed deep below the signal line at -0.16. The histogram at -0.41 is still expanding to the downside, implying that intraday selling pressure has not yet exhausted itself.
At the same time, the hourly Bollinger midband at $65.49 sits far above current price. This confirms the stock has moved sharply to the lower portion of its intraday range. Notably, the hourly lower band at $62.48 is essentially where price now trades. This zone could act as short-term technical support, but price is pressing against it rather than bouncing from it.
15-Minute Frame: Execution Context Points to Exhaustion
The 15-minute chart is explicitly bearish, yet hints at possible short-term exhaustion. RYAAY at $62.53 sits below the EMA20 at $63.68, the EMA50 at $64.50, and the EMA200 at $64.98 — a fully bearish EMA stack.
The 15m RSI at 22.24 is deep in oversold territory — one of the most extreme readings across all three timeframes analyzed. In contrast to the daily and hourly, however, the 15m MACD histogram at just -0.02 hints that short-term selling may be approaching a temporary exhaustion point.
Therefore, from a pure timing perspective, the 15m setup suggests a short-term bounce could emerge. That said, a bounce in a deteriorating structure is not a trend reversal. Traders should treat any near-term recovery as relief within a weak framework, not as confirmation of a new leg higher.
Bullish Scenario for Ryanair Holdings plc Stock: What Needs to Happen
For bulls to regain meaningful control of Ryanair Holdings plc stock, a sustained reclaim of the daily EMA20 at $63.92 is the minimum requirement. Without this, any bounce remains corrective within a weakening structure.
Above that, the pivot point at $63.26 needs to flip back to support. A recovery toward R1 at $64.01 on the daily, combined with a stabilizing MACD histogram and an RSI climbing back above 50, would represent a credible momentum shift.
On the hourly frame, a close above the EMA200 at $63.10 would be an early signal that the intraday trend is beginning to repair. In that scenario, the deeply oversold hourly RSI near 28 would provide fuel for a sharper bounce. The EMA50 and EMA200 stack on the daily remains supportive between $61.56 and $62.04. Long-term structural damage has not occurred, providing a relatively defined risk level for those considering a bullish view.
Bearish Scenario: Where the Risk Lies
The bearish risk is clear: a failure to reclaim $63.10–$63.26 and continued pressure below the current close brings S1 support at $61.81 into focus. Below that, the daily EMA200 at $61.56 becomes the last meaningful structural defense.
A break there would signal that the broader recovery in RYAAY is being fully unwound. The bearish case is reinforced by cross-timeframe MACD deterioration. Daily, hourly, and 15-minute MACD are all negative or rolling over simultaneously. That degree of alignment across timeframes reflects a genuine shift in near-term selling pressure, not noise.
Notably, the daily Bollinger lower band at $61.44 roughly coincides with long-term EMA support. This makes the $61.44–$61.81 zone a critical area to watch in any downside extension scenario.
Positioning, Volatility, and the Uncertainty Ahead
Overall, RYAAY holds a position where the daily trend structure remains technically intact, but the weight of near-term evidence leans cautious. The intraday reversal on July 17, the MACD bearish cross on the daily, and deep oversold readings on lower timeframes collectively describe a stock under stress rather than one building for a breakout.
In this context, the daily ATR of $1.80 underscores that volatility is real and that moves in either direction can be sharp. Prudent positioning means respecting the current weakness while monitoring the $61.56–$62.04 support cluster below. Until price reclaims the daily EMA20 with conviction, the bias for Ryanair Holdings plc stock remains cautiously to the downside.
FAQ
Is Ryanair Holdings plc stock currently in a bear market?
No. The daily trend structure remains technically intact. RYAAY at $62.57 still holds above both the EMA50 at $62.04 and the EMA200 at $61.56. The official daily regime is neutral, not bearish, though near-term momentum has clearly deteriorated.
What are the key support levels for RYAAY?
The immediate support cluster sits between $61.56 (daily EMA200) and $62.04 (daily EMA50). S1 support on the daily pivot framework stands at $61.81. The daily Bollinger lower band at $61.44 roughly coincides with this zone, making $61.44–$61.81 a critical area to watch.
What would signal a bullish reversal for Ryanair Holdings plc stock?
A sustained reclaim of the daily EMA20 at $63.92 is the minimum requirement. Additionally, the hourly EMA200 at $63.10 must be recaptured, the MACD histogram must stabilize, and the daily RSI needs to climb back above 50. Until then, any bounce should be treated as corrective.
Why did RYAAY reverse so sharply on July 17?
RYAAY traded as high as $64.70 intraday but closed at $62.57 — a sharp $2.13 reversal. The price rejection near the daily EMA20 and pivot zone, combined with a bearish daily MACD cross already in effect, suggests sellers overwhelmed buyers at higher levels, driving price back near session lows.
Disclaimer: This article is for informational purposes only and does not constitute financial advice, an investment recommendation, or a solicitation to buy or sell any financial instrument or cryptocurrency. The analysis provided is not indicative of future results. Investing in crypto assets and financial markets carries a high risk of capital loss. Always do your own research (DYOR) and consult a qualified financial advisor before making any decision.
Article produced with the assistance of artificial intelligence and reviewed by the editorial team.
