




Alibaba Group Holding Limited stock trades at a critical junction after a string of AI announcements. At $114.97 on the July 17 close, BABA sits at its 50-day EMA of $115.76 — a level historically separating recovery from renewed pressure. The AI narrative is compelling, but confirmation remains elusive.
Summary
Key takeaways
- BABA closed at $114.97 on July 17, trading right at the 50-day EMA of $115.76.
- The daily RSI at 57.33 supports a cautiously bullish read, while the MACD histogram surged to +2.82.
- Alibaba secured regulatory approval to power Apple devices in China and launched the Qwen3.8 Max model.
- A daily close above $115.76 would open the path toward $120.57; failure could send BABA toward $109.86.
- The daily ATR of $3.97 signals significant session-to-session price risk in both directions.
Daily Structure: Recovery Faces the 50 EMA Test
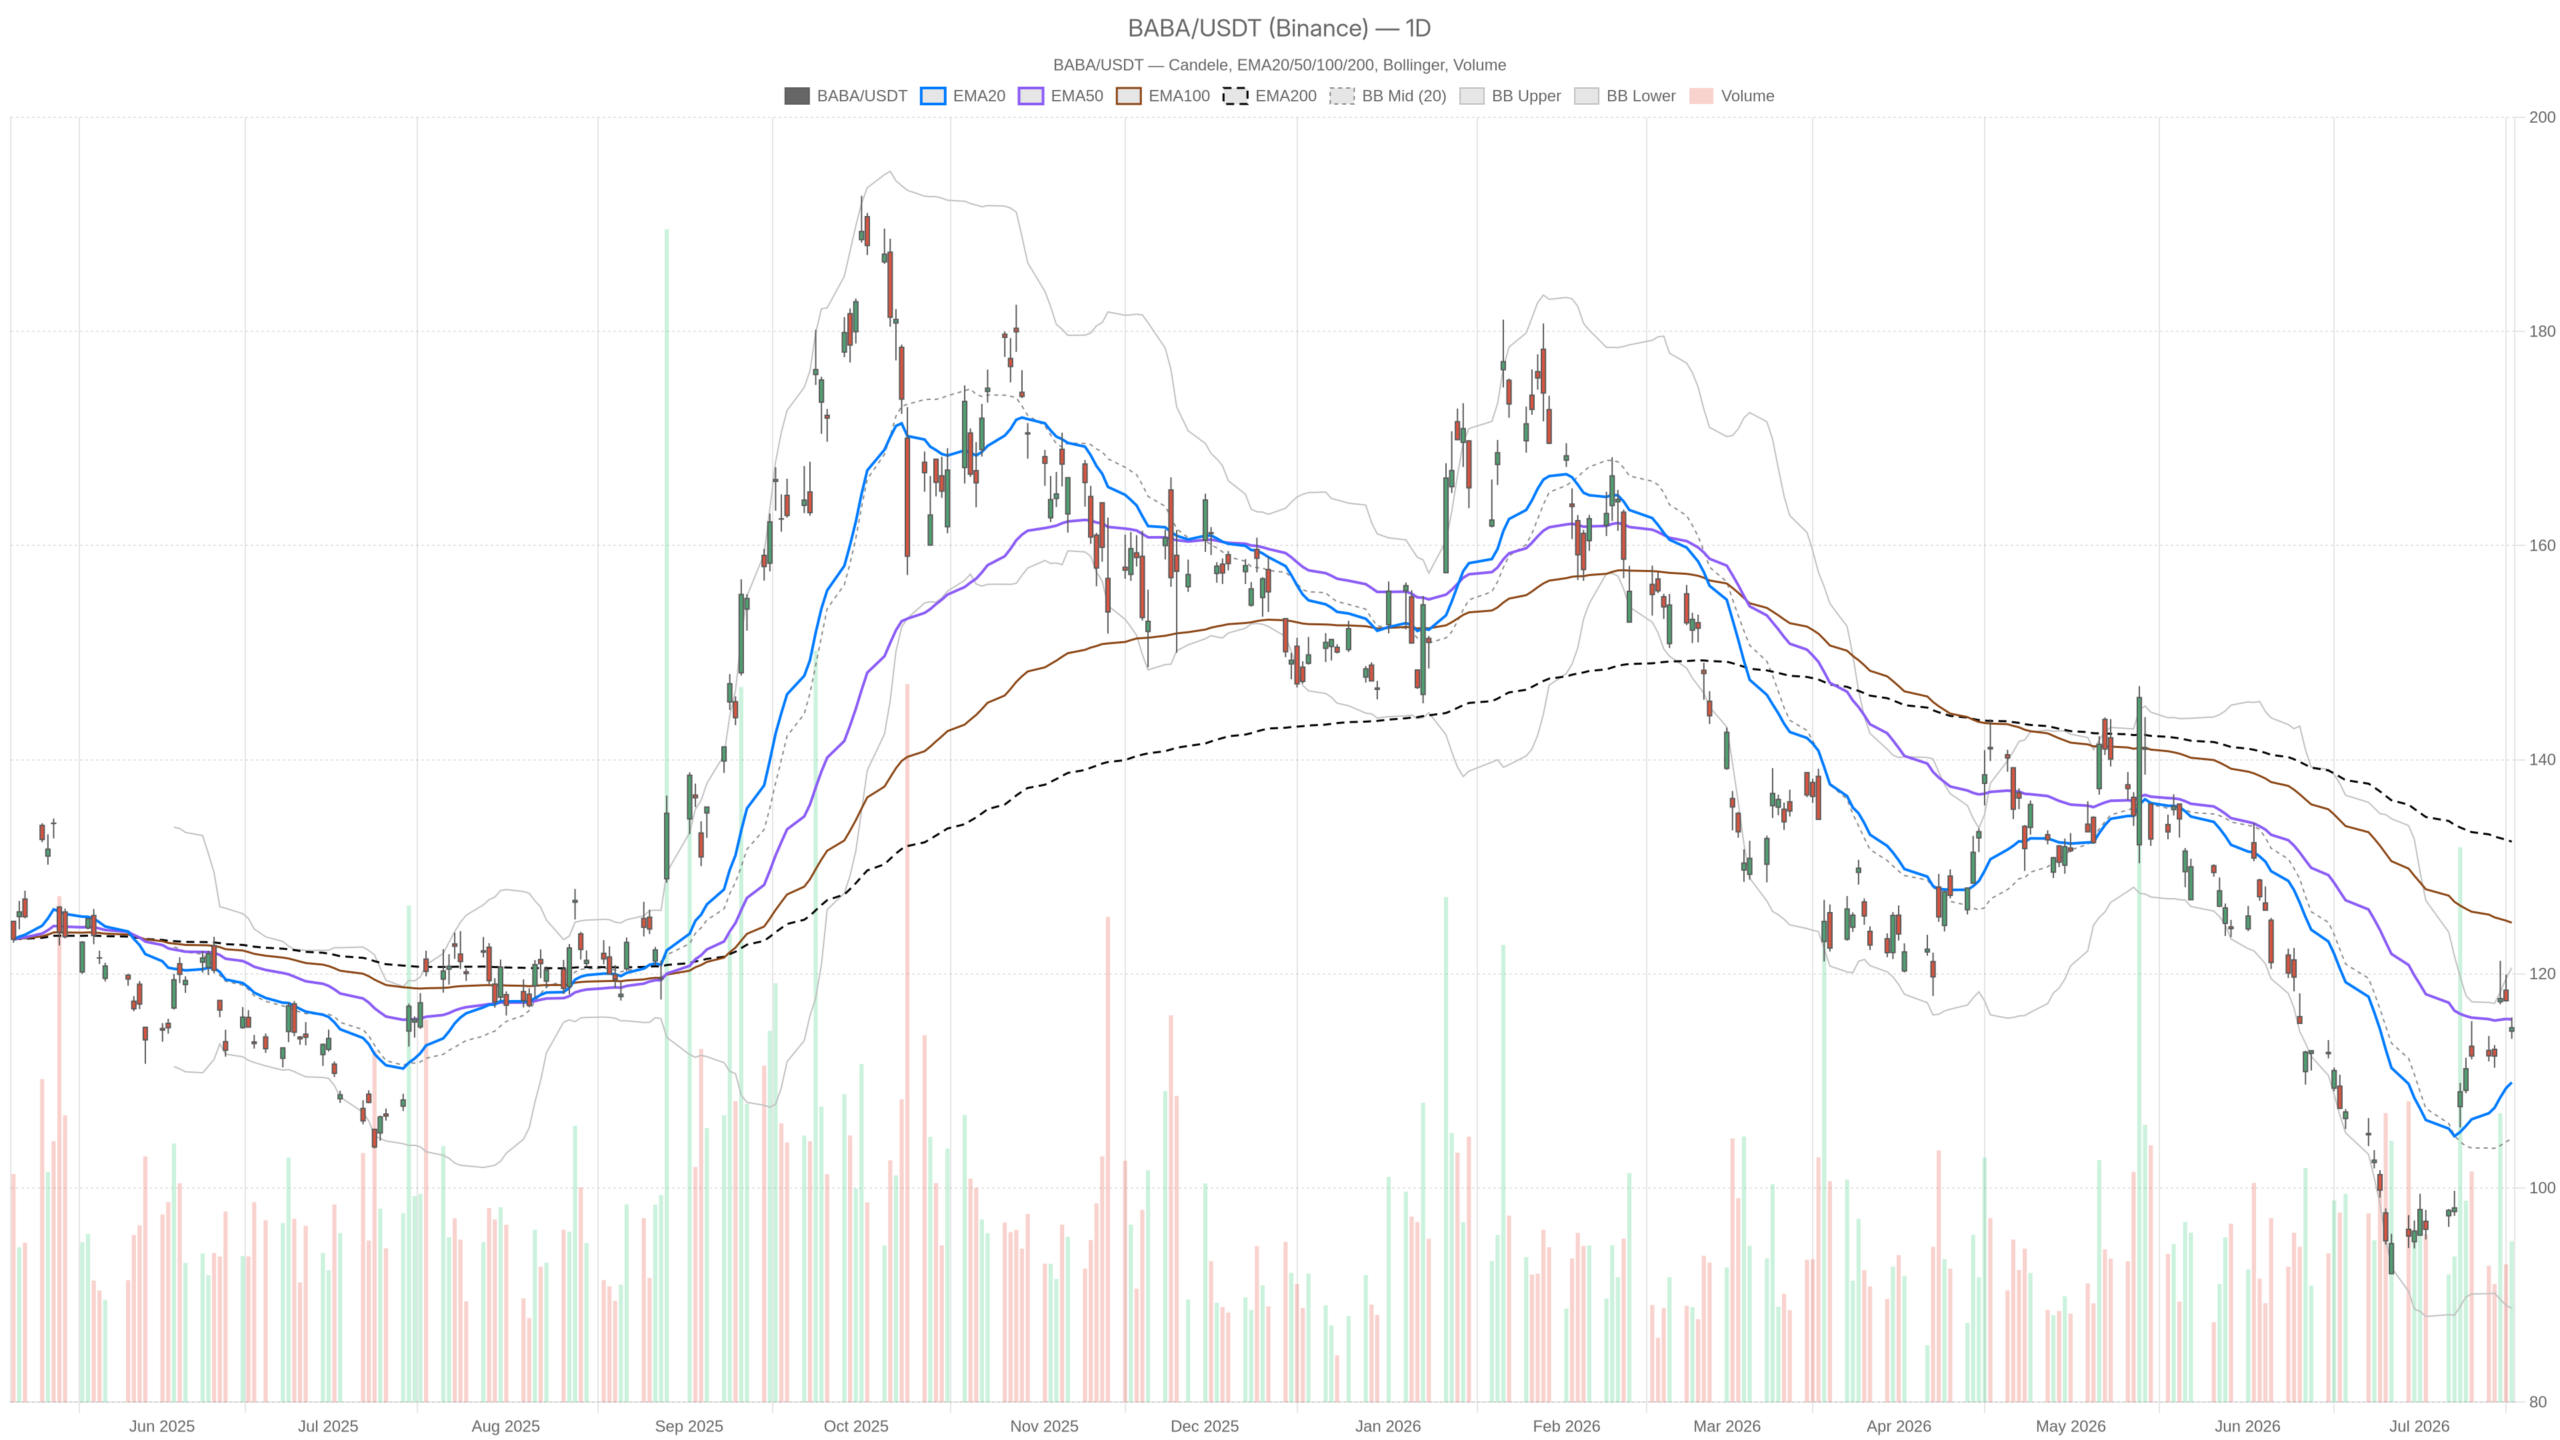
The daily chart shows BABA recovering but not yet breaking above the critical 50-day EMA at $115.76, keeping the trend in neutral territory. Alibaba stock trades well above its 20-day EMA at $109.86, confirming near-term upward momentum. However, the 50-day EMA at $115.76 sits just above the current close of $114.97. Price has not yet convincingly broken above it. Meanwhile, the 200-day EMA at $132.35 remains a distant ceiling, underscoring that the longer-term trend is still structurally impaired.
Momentum Indicators Flash Bullish Divergence
Meanwhile, the daily RSI at 57.33 supports the cautiously bullish read, sitting above the midpoint without being overbought. This suggests room for further upside before momentum exhausts. The MACD picture is more encouraging than it first appears. The MACD line at -0.01 is essentially flat. However, the histogram has expanded sharply to +2.82. That divergence — a histogram well ahead of a near-zero MACD line — reflects a fast-moving bullish shift building beneath the surface.
Bollinger Bands and Volatility Context
Notably, Bollinger Bands place the current price of $114.97 comfortably within the upper half, between the midpoint at $104.66 and the upper band at $120.57. This positioning is consistent with a stock that has made a meaningful move off the lows. Yet it has not entered overextension territory. The daily ATR of $3.97 confirms that BABA remains a volatile name. Each session carries meaningful price risk in both directions.
Alibaba Group Holding Limited Stock: AI Narrative Driving the Bid
Alibaba’s AI developments provide credible fundamental catalysts for the recent price strength in BABA stock. The Qwen AI received regulatory approval from the Cyberspace Administration of China to power Apple devices in China — a partnership linking Alibaba directly to the world’s largest smartphone market. The market reacted decisively, with shares rallying on the news around July 15–16. Then, on July 19, Alibaba launched a preview version of its flagship Qwen3.8 Max model. According to Bloomberg, shares rose as much as 5.4% on that session alone.
However, these are not minor incremental updates. The Apple integration approval represents a structural commercial foothold in China’s AI ecosystem. The Qwen3.8 Max launch signals that Alibaba is competing at the frontier of global large language model development. Together, they provide a credible fundamental reason for the recent price strength. This narrative could continue to attract institutional interest if execution follows through.
Hourly Timeframe: Momentum Fading Into Resistance
The 1-hour chart shows momentum fading, with price slipping below the 20-hour EMA at $116.00 and the hourly RSI dropping below neutral at 45.51. The hourly price of $114.96 sits above both the 50-hour EMA at $113.42 and the 200-hour EMA at $111.18 — a positive broader structure. However, it has rolled below the 20-hour EMA at $116.00.
This intraday weakening suggests the recent momentum surge is losing steam near resistance. The hourly RSI at 45.51 sits below the neutral 50 line. Combined with the MACD histogram at -0.58, the hourly setup points to a short-term pause rather than immediate continuation.
The 1-hour Bollinger Bands reinforce this view. Price at $114.96 has slipped toward the lower end of the band, with the lower band at $114.32 and the midpoint at $117.24. That positioning reflects fading intraday momentum. Hourly pivot support sits at $114.79 (S1) and $115.09 (PP), providing near-term reference levels. A hold above $114.79 keeps the hourly structure intact. A break below it would likely accelerate selling toward the $113–$113.42 range, where the 50-hour EMA provides support.
15-Minute Context: Short-Term Exhaustion
Short-term exhaustion is evident on the 15-minute chart, with RSI approaching oversold at 37.4 and price hugging the lower Bollinger Band. The RSI at 37.4 suggests sellers controlled the action into the July 17 close. The MACD histogram at +0.06 hints at a tentative attempt at stabilization, but it carries little conviction.
At the same time, the 15-minute Bollinger Bands are relatively compressed, with an ATR of just $0.31, indicating low immediate volatility. Price is hugging the lower edge of the band near the S1 pivot at $114.80. Overall, intraday momentum has been grinding lower into the close — not the setup of a stock about to break higher without a catalyst.
Bullish Scenario: Breaking Above the 50 EMA
The bullish case requires a daily close above the 50-day EMA at $115.76, which would open a path toward the upper Bollinger Band at $120.57. A close above that level — ideally on expanding volume — would represent a structural breakout. The next meaningful technical target is the daily upper Bollinger Band at $120.57. Given the daily ATR of $3.97, such a move could unfold over two to three sessions if momentum accelerates.
Still, the AI narrative provides the fundamental fuel. Additional positive headlines around Qwen adoption, Apple integration milestones, or broader China technology sentiment could serve as the trigger. A confirmed hold above $115.76 on a closing basis would shift the daily bias from neutral to constructive.
Bearish Scenario: Rejection and Pullback Risk
A rejection at the 50-day EMA would likely send BABA back toward the 20-day EMA at $109.86, reinforcing the medium-term downtrend. A rejection of the 50-day EMA at $115.76 would confirm that BABA remains trapped in a medium-term declining trend — still well below the 200-day EMA at $132.35. In that case, a pullback toward the 20-day EMA at $109.86 becomes the path of least resistance. That level roughly corresponds to the lower half of the daily Bollinger Band range, making it a natural technical resting zone.
However, the bearish case strengthens if the hourly structure breaks below $114.32 — the lower hourly Bollinger Band — which would suggest distribution is accelerating. Any deterioration in China’s regulatory environment for AI or a broader risk-off move in technology names could catalyze such a scenario.
Positioning and Volatility Outlook
BABA stock sits at a meaningful inflection point where patience matters more than speed, as the AI narrative competes with unresolved technical resistance. Overall, Alibaba Group Holding Limited stock is at a genuinely important junction. The daily structure is improving, driven by real AI-related catalysts that carry both commercial and strategic weight. At the same time, the 50-day EMA has not yet been cleared. Hourly momentum is decelerating, and the 200-day EMA remains a distant structural headwind.
Overall, the daily ATR of nearly $4 means that noise around this resistance zone will be substantial. Traders watching BABA closely should treat the $115.76 level as the line in the sand. Until it is convincingly broken, the stock is constructive but unconfirmed. The AI story is compelling; the chart still demands proof.
FAQ
What is the key level to watch for Alibaba Group Holding Limited stock?
The 50-day EMA at $115.76 is the critical level. A daily close above it would signal a structural breakout, while rejection would likely send BABA toward the 20-day EMA at $109.86.
What AI catalysts are driving BABA stock higher?
Alibaba’s Qwen AI received regulatory approval to power Apple devices in China, and the company launched the Qwen3.8 Max model on July 19. Shares rose as much as 5.4% on that session alone, according to Bloomberg.
Is BABA stock bullish or bearish right now?
The daily bias is cautiously constructive but unconfirmed. The stock trades above the 20-day EMA, and momentum indicators show bullish divergence. However, the 50-day EMA at $115.76 remains untested, and the 200-day EMA at $132.35 is a distant headwind.
Where are the next support and resistance levels for BABA?
Key support sits at the 20-day EMA of $109.86 and the hourly level of $114.32. Key resistance is the 50-day EMA at $115.76, with the upper Bollinger Band at $120.57 as the next target above that.
Disclaimer: This article is for informational purposes only and does not constitute financial advice, an investment recommendation, or a solicitation to buy or sell any financial instrument or cryptocurrency. The analysis provided is not indicative of future results. Investing in crypto assets and financial markets carries a high risk of capital loss. Always do your own research (DYOR) and consult a qualified financial advisor before making any decision.
Article produced with the assistance of artificial intelligence and reviewed by the editorial team.
