

TSMC stock enters mid-June 2026 in a confirmed uptrend, closing at $462.12 on June 18 after surging from $438.39 to $465.22. The daily regime is formally bullish across all timeframes, though short-term exhaustion signals warrant caution.
Summary
Key takeaways
- TSMC stock closed at $462.12 on June 18, surging from a $438.39 low to a $465.22 high on volume exceeding 25.8 million shares.
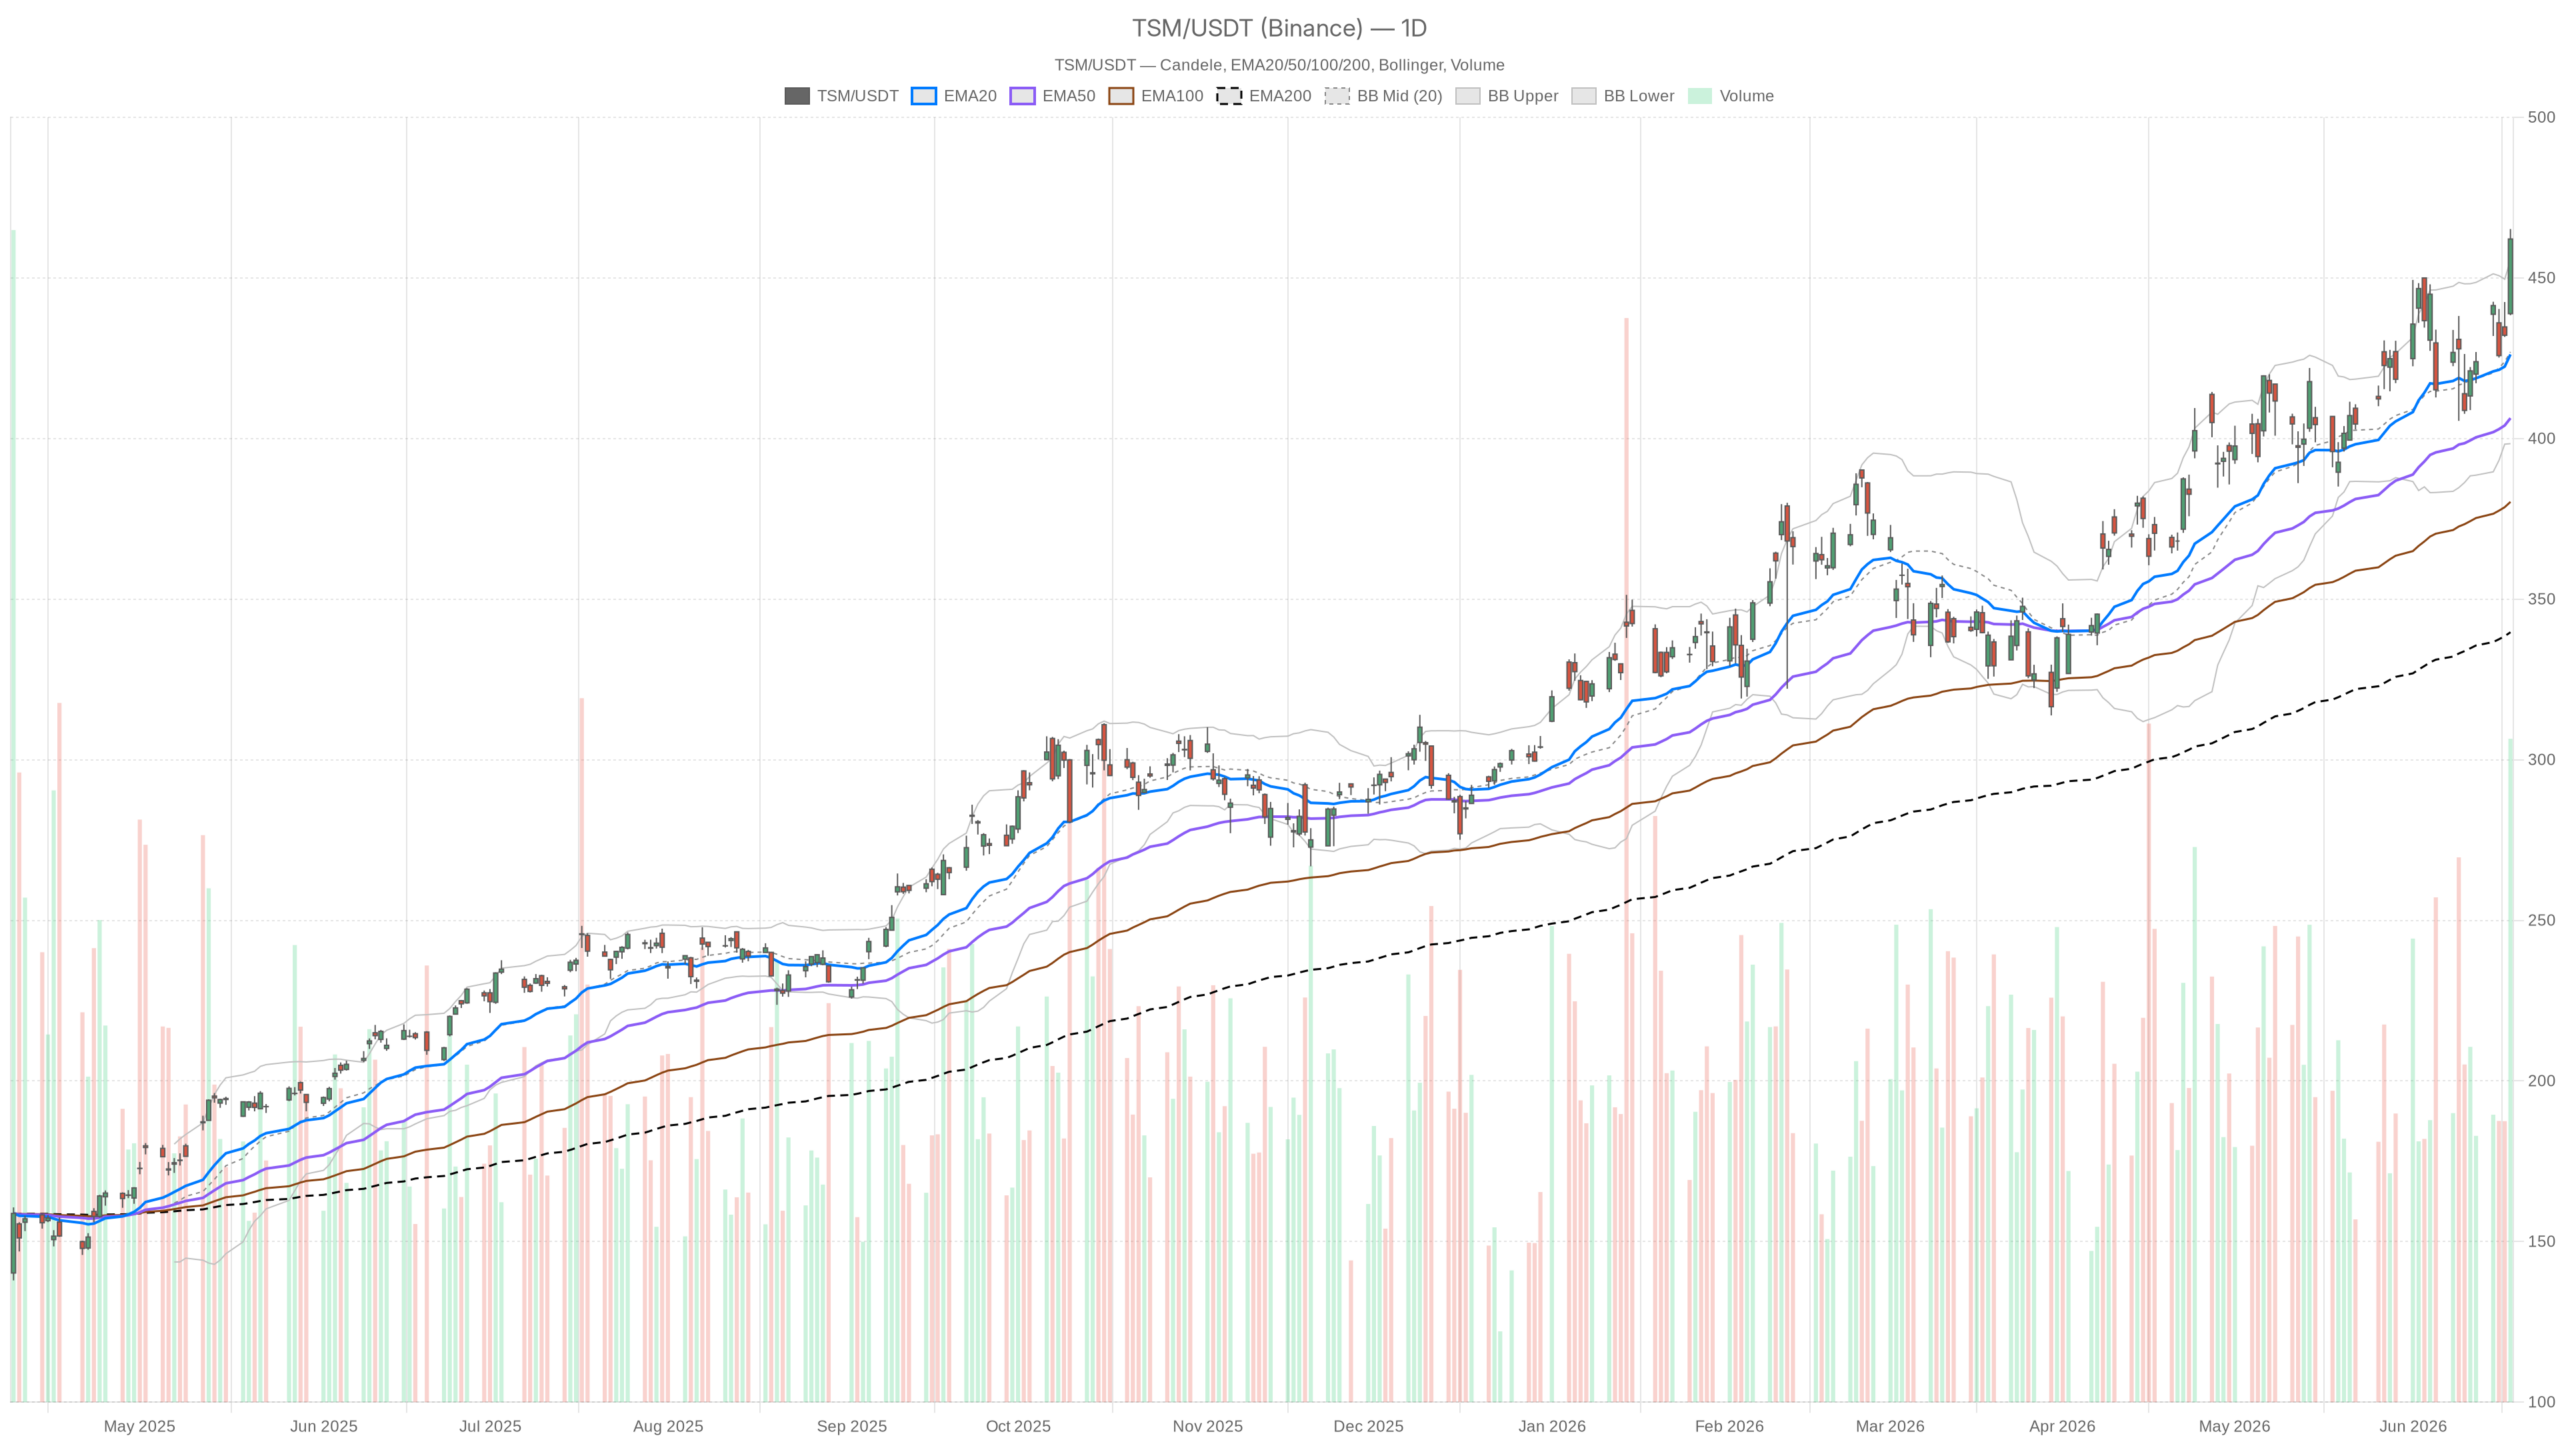
- The daily EMA stack is perfectly aligned bullishly, with price above the EMA20 at $426.19, EMA50 at $406.35, and EMA200 at $339.69.
- The hourly RSI at 73.60 and 15-minute RSI at 76.72 signal overbought conditions, raising near-term pullback risk.
- A sustained break above $465 would open the path toward the daily R1 target at $472.10.
- Institutional support remains robust, with Seeking Alpha upgrading TSM to a buy and Bridgewater Associates flagging it as a top growth stock.
TSMC Stock Daily Technicals: Bullish EMA Stack Confirms the Trend
TSMC stock’s daily chart confirms an unambiguous uptrend. The EMA alignment, momentum readings, and volume all support continued bullish control.
The daily EMA stack tells the core story. Price sits well above the EMA20 at $426.19, the EMA50 at $406.35, and the EMA200 at $339.69. All three are perfectly aligned in a bullish sequence. That kind of clean alignment reflects sustained accumulation rather than market indecision.
Meanwhile, the daily RSI at 63.43 is elevated but not yet overbought. There is still room for momentum to extend before hitting a structural ceiling. The MACD line at 10.03 sits above the signal at 9.06. However, the positive histogram of 0.97 is thin. This suggests the upward impulse is maturing rather than accelerating.
Notably, the daily close at $462.12 punched above the upper Bollinger Band at $455.50. Breaking above the upper band on heavy volume typically signals momentum strength, not a reflexive sell. However, price is stretched relative to the 20-period mean at $426.95. A reversion to the mean remains possible, and the gap is wide enough to matter. The ATR14 at $20.82 reflects a wide daily range. Traders should expect meaningful intraday swings.
Daily Pivot Structure and Key Levels
The daily pivot point sits at $455.24, with R1 at $472.10 and S1 at $445.27. TSM closed above the pivot, reinforcing intraday bullish control. The next upside target of $472.10 is now in play if momentum holds. On the downside, $445.27 represents the first meaningful support to monitor on any pullback.
TSMC Stock Hourly Signals: Overbought RSI Warns of Exhaustion
The hourly chart confirms TSMC stock’s bullish trend but raises a critical caution flag. The H1 RSI has entered overbought territory, signaling that a pullback or consolidation may be imminent.
In the hourly picture, price at $462.22 trades well above the H1 EMA20 at $445.51, EMA50 at $436.59, and EMA200 at $420.93. This is a clean bullish EMA structure across the board. The H1 MACD line at 7.92 leads the signal at 5.65, with a positive histogram of 2.27. That combination confirms the hourly uptrend remains firmly in force.
However, the H1 RSI at 73.60 is technically overbought. This does not invalidate the bullish thesis. But it does introduce real near-term risk of a pullback or sideways consolidation before any fresh leg higher. At the same time, the H1 close near the upper Bollinger Band at $465.05 confirms price is pressing against short-term resistance. The gap to the H1 pivot at $462.50 is narrow, with R1 at $464.94 acting as the immediate ceiling.
15-Minute Chart Shows Clear Micro-Divergence
The 15-minute chart reinforces the exhaustion signal. Short-term buying pressure is visibly fading at current levels.
Specifically, the M15 RSI sits at 76.72 — deeply overbought. The MACD histogram has flipped marginally negative at -0.16. The MACD line at 4.38 has fallen below the signal at 4.54. This micro-divergence confirms that buying pressure is easing. The 15m pivot at $463.03 already sits above the last close of $462.22. R1 at $464.41 is effectively a ceiling within reach. For short-term traders, the 15-minute structure argues against chasing the move right now.
Fundamental Catalysts Supporting TSMC Stock
The bullish technical setup in TSMC stock is backed by strong institutional and fundamental tailwinds. AI demand, manufacturing leadership, and institutional accumulation all support the trend.
In fact, this technical picture is not unfolding in a vacuum. Seeking Alpha upgraded TSM to a buy, citing robust AI demand, disciplined capital expenditure, and TSMC’s structural EUV manufacturing edge. Meanwhile, Ray Dalio’s Bridgewater Associates has reportedly flagged TSM as one of the best growth stocks to own. These endorsements align with what the price action is communicating.
On the other hand, TSMC’s CFO Wendell Huang signaled potential pricing pressure as inflation has increased costs. This leaves open the possibility of price hikes being passed on to customers. Taiwan chip export restrictions on China also remain a headline risk. This adds a geopolitical layer that technical analysis cannot fully price. These factors are not currently breaking the trend. However, they represent structural overhangs that could sharpen any correction if sentiment shifts.
TSMC Stock Scenarios: Bullish Continuation vs. Healthy Pullback
The base case for TSMC stock remains bullish. However, the short-term path depends on whether price can hold above key support at $455.24. Two distinct scenarios are now in play.
Bullish Scenario
To sustain the bullish case, price must hold above the daily pivot at $455.24. It must also maintain its position above the upper Bollinger Band on a closing basis. A sustained break and hold above $465 would open the path toward the daily R1 at $472.10. Continued strength in AI demand, combined with TSMC’s pricing power narrative, would provide fundamental fuel. Institutional buying, evidenced by the June 18 volume of over 25.8 million shares, supports this outcome as the base case.
Bearish Scenario
In contrast, the bearish scenario does not require a trend reversal. It only needs a healthy retracement. A failure to reclaim $464–$465 on the next session could trigger a pullback, amplified by overbought readings across H1 and M15. The likely target is the $445–$450 zone. That level aligns with S1 on the daily pivot and sits just above the EMA20.
A decisive close below $445 would begin to weaken the immediate bullish structure. A drop toward $426 — the EMA20 — would still represent a normal correction within a healthy uptrend, not a breakdown.
Overall, TSMC’s structural bull trend is intact and well-supported across all timeframes. The daily momentum is strong and the EMA alignment is clean. The fundamental narrative around AI demand and institutional accumulation provides a credible tailwind.
Nevertheless, the short-term RSI readings are stretched. The 15-minute MACD shows early signs of exhaustion. Price is pressing against Bollinger Band resistance. Entering aggressively at current levels carries elevated short-term risk. The more disciplined approach is to let the intraday noise settle. Look for a defined entry on a pullback aligned with the daily trend.
FAQ
Is TSMC stock overbought right now?
TSMC stock shows mixed overbought signals across timeframes. The daily RSI at 63.43 remains below the overbought threshold. However, the hourly RSI at 73.60 and the 15-minute RSI at 76.72 are both in overbought territory. This suggests short-term exhaustion rather than a structural top.
What is the next price target for TSMC stock?
The next upside target is the daily R1 at $472.10, which comes into play if price sustains a break above $465. On the downside, the first support zone is $445–$450, aligning with the daily S1 and the EMA20.
What fundamental factors are driving TSMC stock higher?
TSMC stock is supported by robust AI-related demand, the company’s EUV manufacturing leadership, and disciplined capital expenditure. Institutional endorsements from Seeking Alpha and Bridgewater Associates further validate the bullish thesis. However, geopolitical risks tied to Taiwan-China export restrictions remain a structural overhang.
Should traders buy TSMC stock at current levels?
The technical structure argues against aggressive entry at current prices. Overbought readings on short-term timeframes and proximity to Bollinger Band resistance suggest elevated near-term risk. A pullback toward the $445–$450 zone would offer a more favorable risk-reward setup aligned with the daily uptrend.
Disclaimer: This article is for informational purposes only and does not constitute financial advice, an investment recommendation, or a solicitation to buy or sell any financial instrument or cryptocurrency. The analysis provided is not indicative of future results. Investing in crypto assets and financial markets carries a high risk of capital loss. Always do your own research (DYOR) and consult a qualified financial advisor before making any decision.
Article produced with the assistance of artificial intelligence and reviewed by the editorial team.