




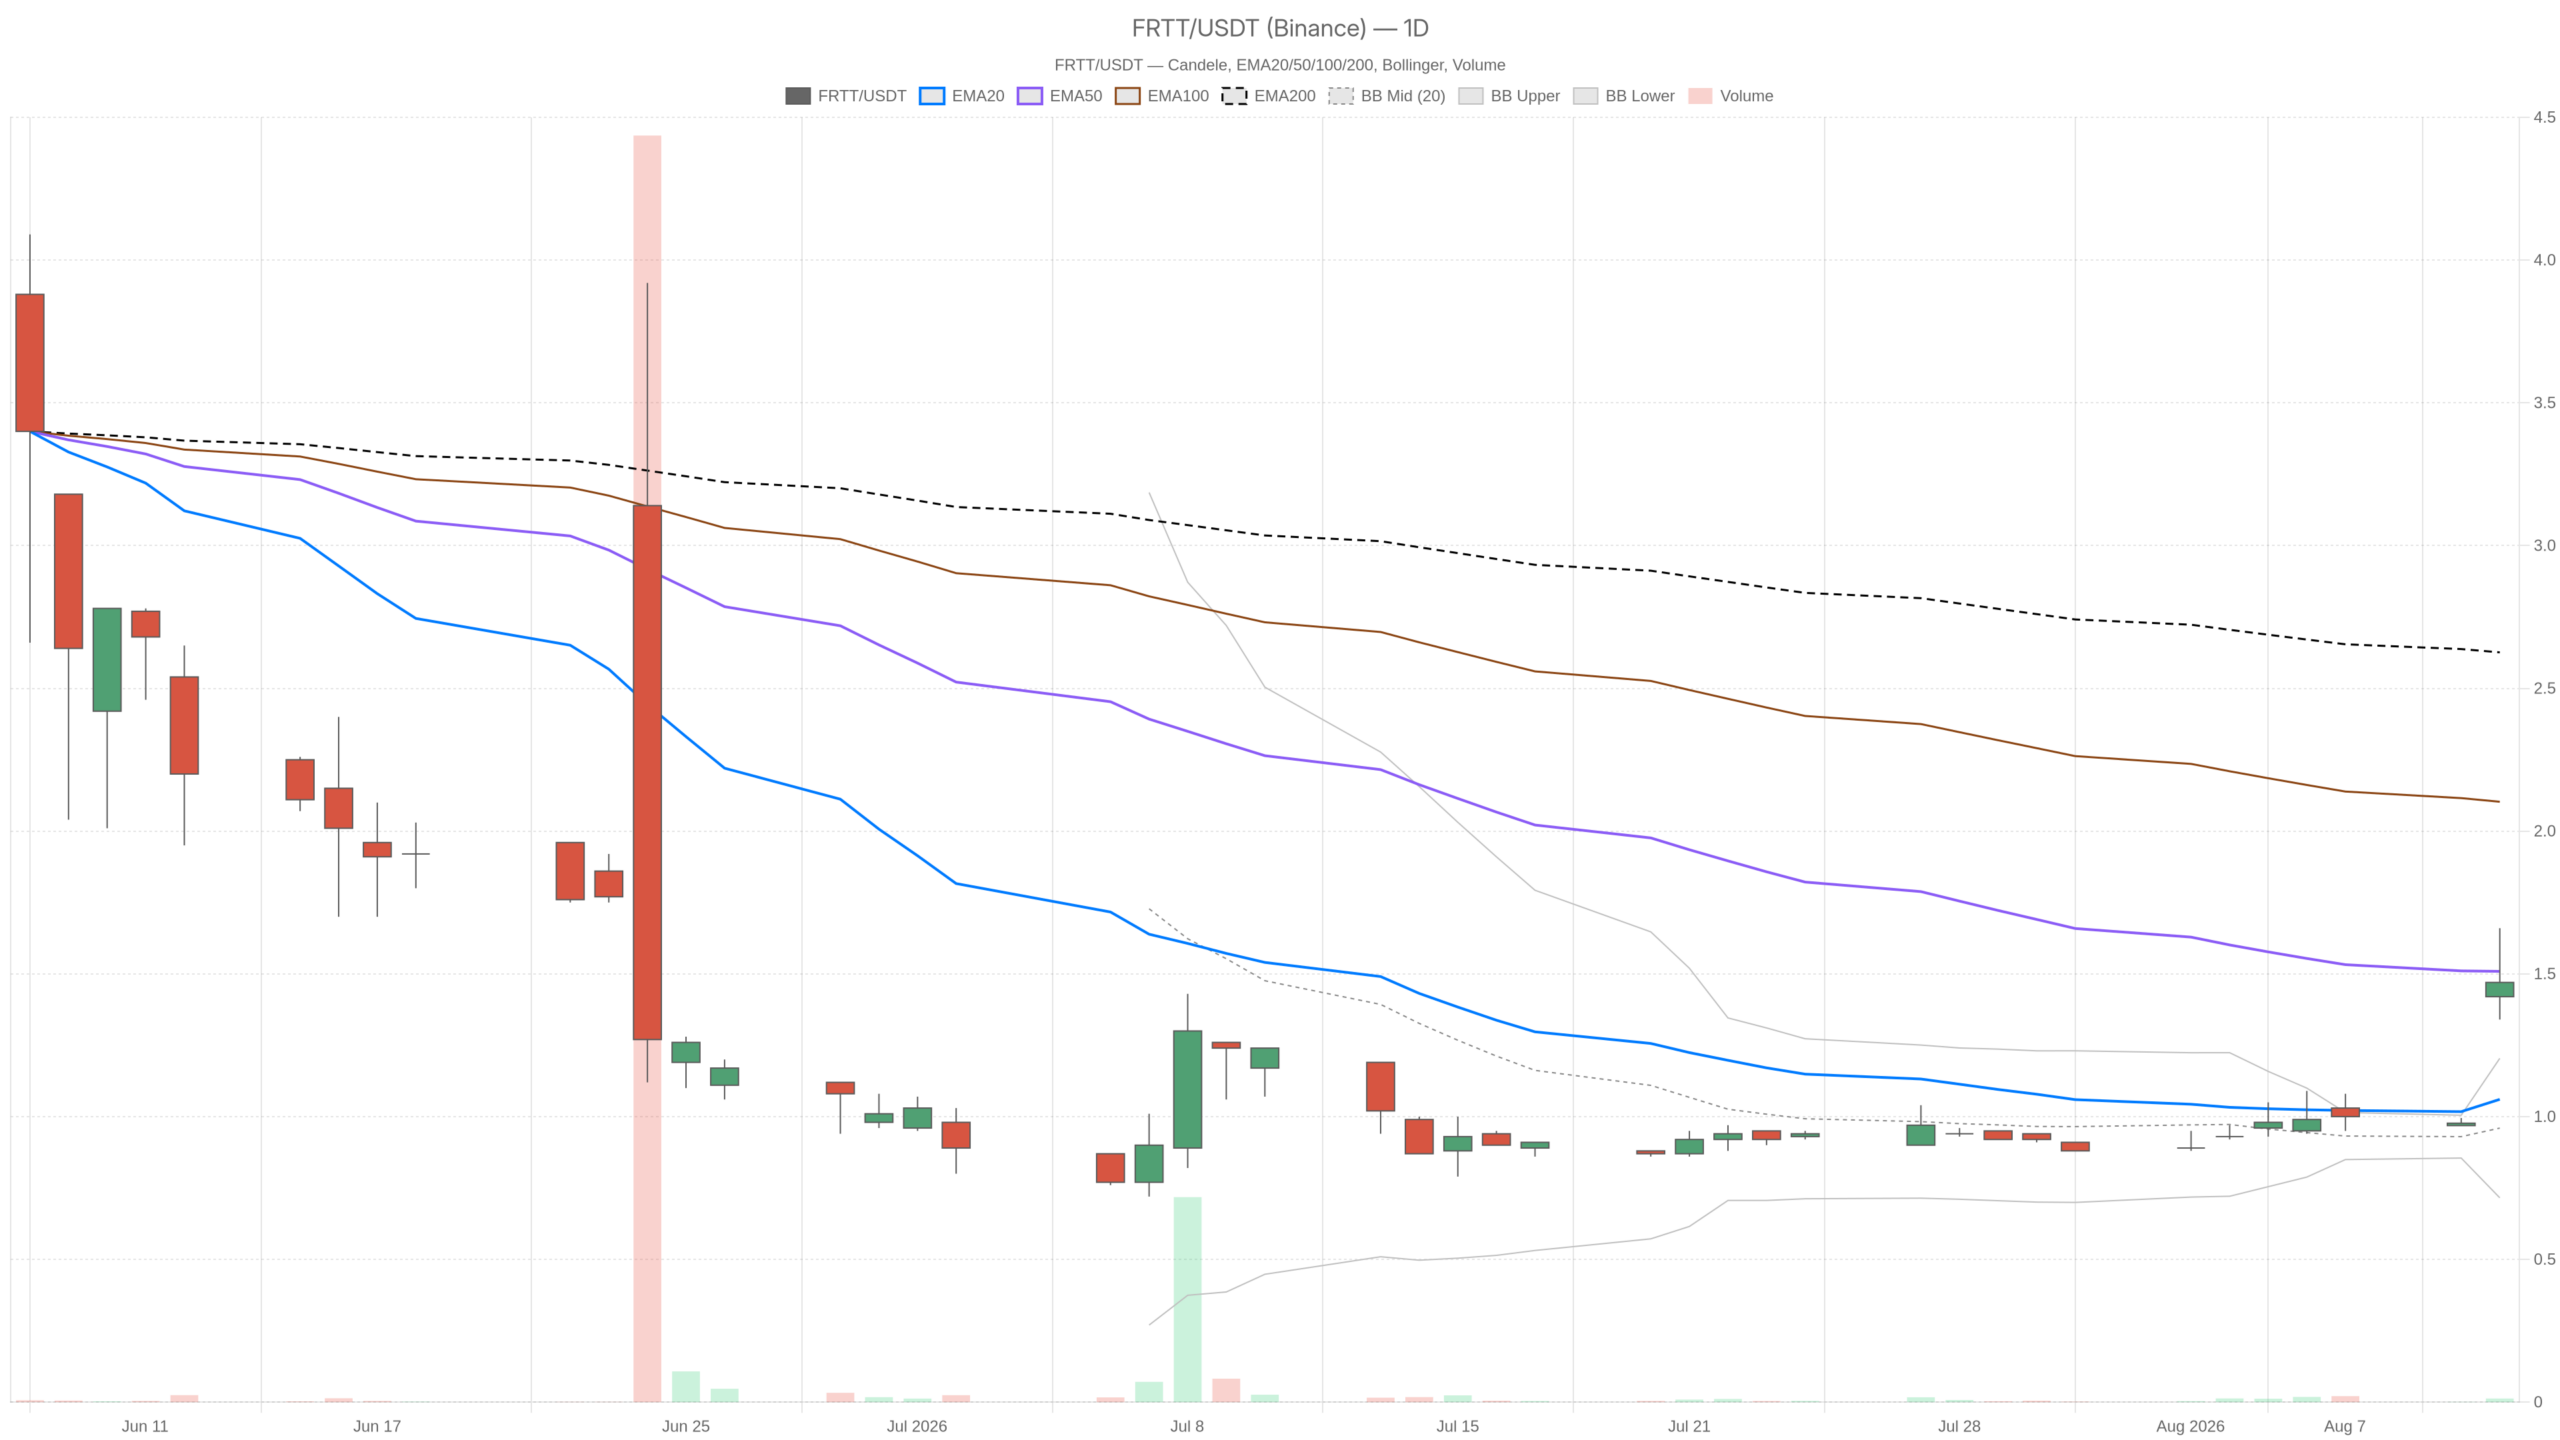
Fort Technology Inc. stock has produced a session that changes short-term behaviour without repairing long-term damage. FRTT closed at 1.47 on 11 August after a volatile session spanning 1.34 to 1.66. The 0.32 daily range was roughly three times the daily ATR of 0.12.
Summary
Key takeaways
- FRTT closed at 1.47 on 11 August with volume reaching 224,554 shares.
- The daily range of 0.32 was roughly three times the daily ATR of 0.12, signalling a volatility expansion event.
- Price sits above the 20-day EMA at 1.06 but remains below the 50-day EMA at 1.51 and the 200-day EMA at 2.63.
- Hourly RSI at 85.65 warns of deeply overbought conditions despite bullish trend alignment.
- The 1.49–1.51 zone is the critical resistance band, merging the daily pivot with the 50-day EMA.
What the Daily Chart Says About Fort Technology Inc. Stock
The daily chart for Fort Technology Inc. stock shows early-stage recovery behaviour rather than a confirmed uptrend. Price has reclaimed the 20-day EMA at 1.06 but remains below the 50-day EMA at 1.51 and the 200-day EMA at 2.63.
Momentum Indicators Show Early Recovery
Meanwhile, daily RSI at 60.36 is constructive rather than extreme. It confirms that buyers have taken control of momentum, yet leaves headroom before the reading becomes stretched on this timeframe. MACD adds nuance: the line sits at -0.09 against a -0.18 signal, with a positive histogram of +0.09. In short, momentum is improving from a negative base. That is early-stage recovery behaviour, not a mature uptrend.
Bollinger Bands Flash Caution on Extension
However, the Bollinger picture is where the caution comes in. The daily bands are centred at 0.96, with the upper band at 1.20. A close at 1.47 is far outside that upper boundary. Moves that extend this far beyond the band rarely continue in a straight line. Some digestion or retracement is the statistical norm, even when the underlying breakout is genuine.
Pivot Levels Define the Immediate Battlefield
Pivot levels frame the immediate battlefield. The daily pivot sits at 1.49, R1 at 1.64 and S1 at 1.32. Notably, FRTT closed at 1.47, marginally below the pivot and just under the 50-day EMA at 1.51. That is a confluence zone. The session high of 1.66 also tagged and rejected R1 at 1.64. Buyers reached resistance, then failed to hold it into the close.
The 1H Chart Confirms Strength but Flags Exhaustion
The 1H chart confirms bullish direction for FRTT while simultaneously warning that the current pace is unsustainable. Hourly RSI at 85.65 is deeply overbought, and price sits far beyond the hourly upper Bollinger band.
Trend Structure vs. Overbought Warnings
On the hourly timeframe, the trend structure is unambiguously positive. Price at 1.47 sits above the 20-, 50- and 200-hour EMAs at 1.03, 0.98 and 1.17 respectively. The MACD line is above zero at 0.05, with a 0.02 signal and a +0.03 histogram. Trend and momentum agree on this timeframe.
Meanwhile, the overbought signals are equally clear. Hourly RSI at 85.65 leaves almost no room for further extension. Price trades well clear of the hourly upper Bollinger band at 1.23, with the band mid at 1.02. Hourly ATR of 0.08 against a 0.32 intraday range underlines how violent the move has been relative to recent conditions.
This is the core conflict. Daily structure remains capped by the 50- and 200-day EMAs, so the bias there is not yet trend-bullish. Lower timeframes, meanwhile, are fully extended to the upside. Both readings can be true, and traders should treat them as different questions: direction versus timing.
15m Execution Context
The 15-minute chart supports a bullish regime for intraday execution, with price above all three key EMAs. However, overbought RSI and a rejection pattern below the micro pivot demand caution.
Price sits above the 20-, 50- and 200-period EMAs at 1.11, 1.04 and 0.97. At the same time, MACD is expanding, with the line at 0.09 versus a 0.03 signal and a +0.06 histogram. RSI at 80.65 is overbought here too.
For execution purposes, the relevant micro levels are the 15m pivot at 1.50, R1 at 1.60 and S1 at 1.37. The last candle opened at 1.53, reached 1.63 and closed back at 1.47. That is a rejection pattern below the micro pivot. Short-term buyers are being asked to defend, not to chase.
Bullish Scenario
For the bullish scenario to hold, FRTT must reclaim and sustain the 1.49–1.51 resistance zone. This band combines the daily pivot with the 50-day EMA.
Acceptance above it would put the 1.60 micro resistance and the 1.64–1.66 area back in play. Continued positive MACD histograms on the daily chart would strengthen the case, and a MACD line crossing toward zero would add further confirmation. Volume needs to stay elevated; the 224,554 print set the bar for participation.
Bearish Scenario
The bearish scenario activates if FRTT loses the 1.37 intraday support level. Below that, the session low of 1.34 and daily S1 at 1.32 become the next downside tests.
A break there would argue for mean reversion toward the stretched moving averages beneath price. The 20-day EMA at 1.06 and the daily band mid at 0.96 mark the realistic downside magnets in that case. Still, the 200-day EMA sits at 2.63, far overhead. This is a reminder that the dominant multi-month trend has not turned.
Overall, Fort Technology Inc. stock is in a high-volatility repair phase rather than a confirmed reversal. Position sizing matters more than direction here, because a daily ATR of 0.12 has just been overwhelmed by a 0.32 range. Until FRTT closes decisively above 1.51 and holds, the burden of proof stays with the bulls. Below 1.32, the recent surge looks more like a spike than a structural change.
FAQ
What is the key resistance level for Fort Technology Inc. stock?
The critical resistance zone is the 1.49–1.51 band, which merges the daily pivot at 1.49 with the 50-day EMA at 1.51. A decisive close above this zone is required to shift the daily bias from neutral to bullish.
Is FRTT in a confirmed uptrend?
No. While the short-term impulse is real, the daily chart shows FRTT remains below both the 50-day EMA at 1.51 and the 200-day EMA at 2.63. The current move is better described as early-stage recovery behaviour rather than a mature uptrend.
What volume threshold matters for confirmation?
The 11 August session printed 224,554 shares. Sustained volume at or above this level would indicate continued institutional participation and strengthen the bullish case.
What happens if FRTT breaks below 1.32?
A break below 1.32, which corresponds to daily S1, would argue for mean reversion lower. The 20-day EMA at 1.06 and the daily Bollinger band mid at 0.96 would become the realistic downside targets.
Disclaimer: This article is for informational purposes only and does not constitute financial advice, an investment recommendation, or a solicitation to buy or sell any financial instrument or cryptocurrency. The analysis provided is not indicative of future results. Investing in crypto assets and financial markets carries a high risk of capital loss. Always do your own research (DYOR) and consult a qualified financial advisor before making any decision.
Article produced with the assistance of artificial intelligence and reviewed by the editorial team.
